Technical Research | February 24, 2012
Daily Technical Report
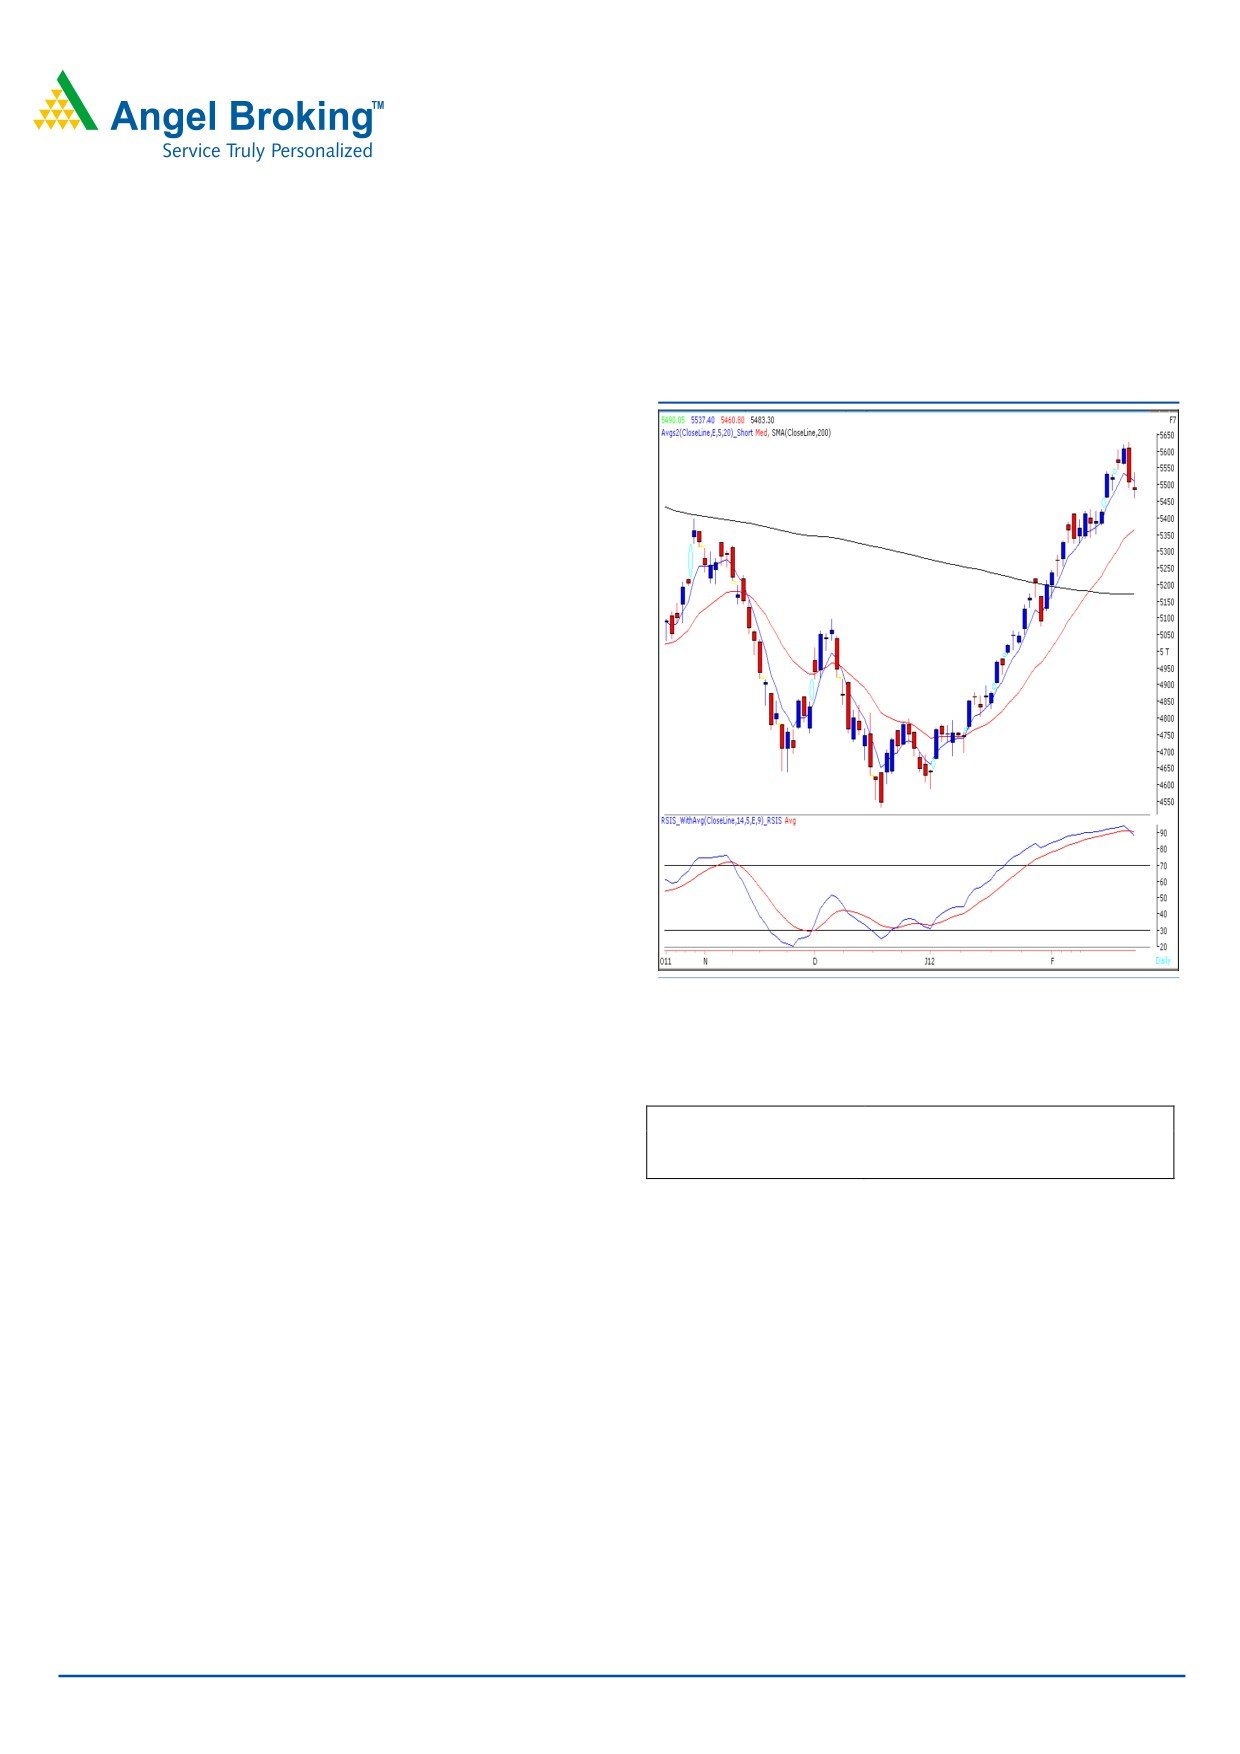
Sensex (18079) / NIFTY (5483)
Exhibit 1: Nifty Daily Chart
Yesterday, markets opened down with a minor gap, traded
with immense volatility throughout the day due to
derivatives expiry and closed marginally below its initial
opening level. On the sectoral front, Realty, Metal and Auto
counters were among the major losers, whereas FMCG and
Power sectors ended on a gaining side. The advance to
decline ratio was strongly in favor of declining counters.
Formation:
• The daily chart depicts a “Bearish Engulfing” pattern.
• On the Weekly chart, indices have closed well above
the “Horizontal Resistance Line” placed at 17908 /
5400 level.
• We are now observing a negative crossover in “RSI-
Smoothened” momentum oscillator.
• The Daily 20 EMA is placed around 17700 - 5364
Source: Falcon
level.
Actionable points:
Trading strategy:
View
Negative below 5460
After a minor gap down opening, indices traded in a range
Expected Targets
5390 - 5364
with very high volatility. Post mid-session indices bounced
Resistance levels
5537 - 5573
back sharply from the day's low and moved towards the
hourly 20 EMA. We observed strong selling pressure near
hourly 20 EMA, which dragged indices significantly lower to
close marginally below its initial opening level. We have
continuously mentioning in our previous reports that the
"RSI-Smoothened" is placed well within the extreme
overbought territory. We are now observing a negative
crossover in this technical tool, which indicates possibility of
a minor correction from current levels, if indices sustain
below yesterday's low of 18005 / 5460. In this scenario
indices can drift towards the daily 20 EMA placed at 17700
/ 5364. Conversely, 18250 - 18339 / 5537 - 5573 levels
may act as resistance in coming trading session.
For Private Circulation Only |
1
Technical Research | February 24, 2012
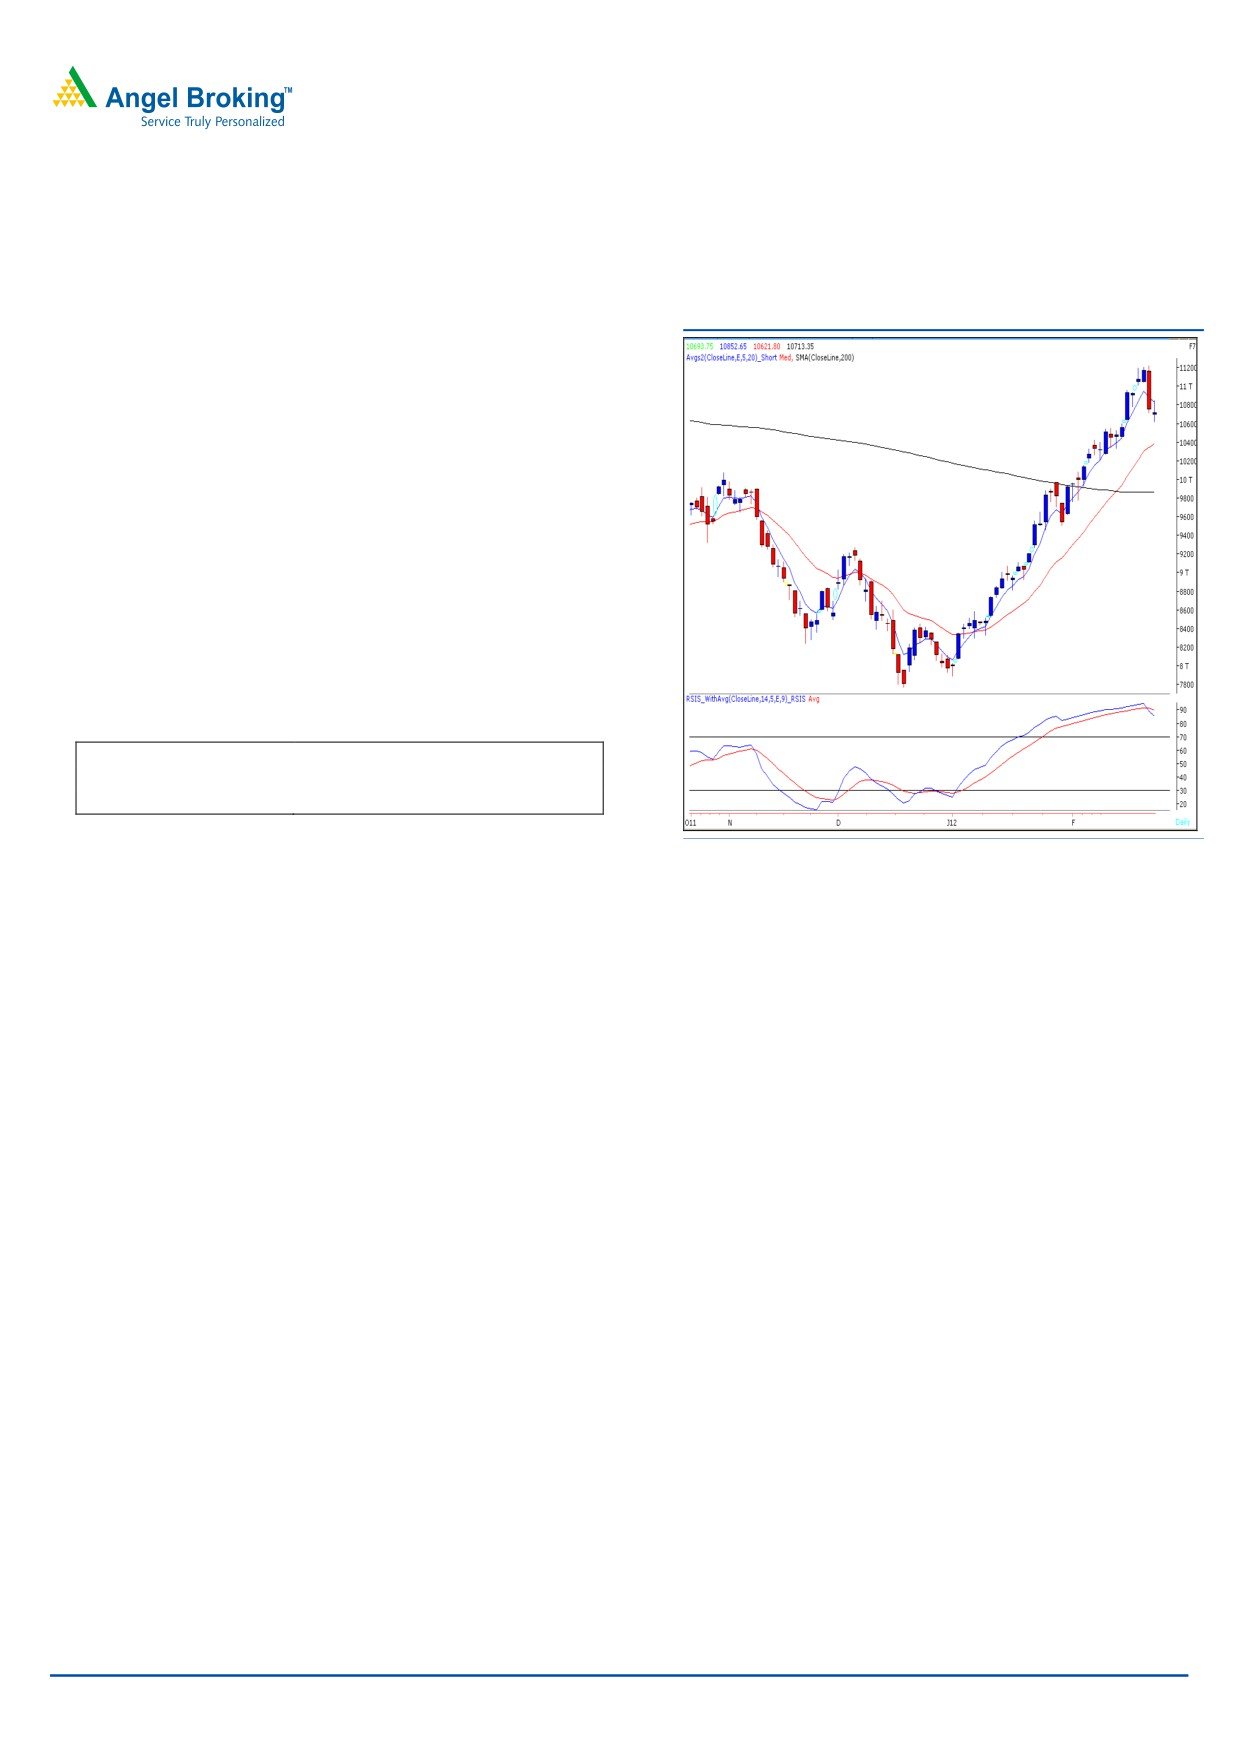
Bank Nifty Outlook - (10713)
Exhibit 2: Bank Nifty Daily Chart
Yesterday, Bank Nifty opened flat and traded in a narrow
range throughout the day to close marginally in red. Due
to derivative expiry, we witnessed a high volatility in the
markets. Hence, Bank Nifty tested both support as well as
resistance levels of 10630 and 10875 mentioned in our
previous report. The bearish technical evidences found on
Wednesday are still intact. Therefore, we reiterate our
view that if Bank Nifty sustains below yesterday’s low of
10630 then the index may correct further till
10340
levels. On the upside, 10850 - 10875 levels could act as
resistance in coming trading session.
Actionable points:
View
Bearish
Expected Target
10340
Resistance Levels
10850 - 10875
Source: Falcon
For Private Circulation Only |
2
Technical Research | February 24, 2012
Negative Bias:
20 Day
Expected
Negative Below
Stock Name
CMP
5 Day EMA
Remarks
EMA
Targets
Coal India
322.8
324.7
328.3
308 - 303
Below 318
View will change
above 331
For Private Circulation Only |
3
Technical Research | February 24, 2012
Daily Pivot Levels for Nifty 50 Stocks
SCRIPS
S2
S1
PIVOT
R1
R2
SENSEX
17,867
17,973
18,111
18,217
18,355
NIFTY
5,417
5,450
5,494
5,527
5,570
BANKNIFTY
10,498
10,606
10,729
10,837
10,960
ACC
1,272
1,286
1,307
1,320
1,341
AMBUJACEM
157
159
162
165
168
AXISBANK
1,171
1,194
1,220
1,243
1,269
BAJAJ-AUTO
1,749
1,768
1,793
1,811
1,837
BHARTIARTL
329
334
339
344
349
BHEL
293
302
312
321
330
BPCL
603
629
647
674
691
CAIRN
373
377
384
388
394
CIPLA
308
312
317
321
326
DLF
314
319
322
326
330
DRREDDY
222
228
236
243
251
GAIL
1,594
1,612
1,633
1,651
1,673
HCLTECH
367
370
374
377
381
HDFC
487
491
495
499
502
HDFCBANK
690
696
702
708
714
HEROMOTOCO
523
528
532
537
541
HINDALCO
2,007
2,048
2,108
2,149
2,209
HINDUNILVR
141
144
147
150
154
ICICIBANK
373
380
385
393
397
IDFC
918
931
945
958
972
INFY
137
141
145
150
153
ITC
2,878
2,905
2,944
2,972
3,010
JINDALSTEL
204
206
208
211
213
JPASSOCIAT
587
597
608
619
630
KOTAKBANK
70
72
76
78
82
LT
547
557
566
576
584
M&M
1,360
1,380
1,404
1,424
1,448
MARUTI
702
713
729
740
756
NTPC
1,250
1,265
1,286
1,301
1,322
ONGC
178
182
184
187
190
PNB
282
286
291
296
301
POWERGRID
965
984
1,010
1,029
1,056
RANBAXY
108
110
112
115
117
RCOM
422
431
439
448
456
RELCAPITAL
91
94
96
99
101
RELIANCE
815
828
839
851
862
RELINFRA
567
585
603
621
639
RPOWER
115
118
121
124
128
SAIL
102
103
105
106
108
SBIN
2,201
2,231
2,277
2,307
2,353
SESAGOA
215
221
232
239
250
SIEMENS
788
801
813
825
838
STER
107
111
116
120
125
SUNPHARMA
526
536
547
556
567
SUZLON
26
27
28
29
30
TATAMOTORS
261
265
269
273
277
TATAPOWER
105
108
111
115
118
TATASTEEL
452
462
470
480
489
TCS
1,229
1,244
1,260
1,275
1,290
WIPRO
432
437
441
446
451
Technical Research Team
For Private Circulation Only |
4
Technical Report
RESEARCH TEAM
Shardul Kulkarni
Head - Technicals
Sameet Chavan
Technical Analyst
Sacchitanand Uttekar
Technical Analyst
Mehul Kothari
Technical Analyst
Ankur Lakhotia
Technical Analyst
Research Team: 022-3952 6600
DISCLAIMER: This document is not for public distribution and has been furnished to you solely for your information and must not
be reproduced or redistributed to any other person. Persons into whose possession this document may come are required to observe
these restrictions.
Opinion expressed is our current opinion as of the date appearing on this material only. While we endeavor to update on a
reasonable basis the information discussed in this material, there may be regulatory, compliance, or other reasons that prevent us
from doing so. Prospective investors and others are cautioned that any forward-looking statements are not predictions and may be
subject to change without notice. Our proprietary trading and investment businesses may make investment decisions that are
inconsistent with the recommendations expressed herein.
The information in this document has been printed on the basis of publicly available information, internal data and other reliable
sources believed to be true and are for general guidance only. While every effort is made to ensure the accuracy and completeness of
information contained, the company takes no guarantee and assumes no liability for any errors or omissions of the information. No
one can use the information as the basis for any claim, demand or cause of action.
Recipients of this material should rely on their own investigations and take their own professional advice. Each recipient of this
document should make such investigations as it deems necessary to arrive at an independent evaluation of an investment in the
securities of companies referred to in this document (including the merits and risks involved), and should consult their own advisors to
determine the merits and risks of such an investment. Price and value of the investments referred to in this material may go up or
down. Past performance is not a guide for future performance. Certain transactions - futures, options and other derivatives as well as
non-investment grade securities - involve substantial risks and are not suitable for all investors. Reports based on technical analysis
centers on studying charts of a stock's price movement and trading volume, as opposed to focusing on a company's fundamentals
and as such, may not match with a report on a company's fundamentals.
We do not undertake to advise you as to any change of our views expressed in this document. While we would endeavor to update
the information herein on a reasonable basis, Angel Broking, its subsidiaries and associated companies, their directors and
employees are under no obligation to update or keep the information current. Also there may be regulatory, compliance, or other
reasons that may prevent Angel Broking and affiliates from doing so. Prospective investors and others are cautioned that any
forward-looking statements are not predictions and may be subject to change without notice.
Angel Broking Limited and affiliates, including the analyst who has issued this report, may, on the date of this report, and from time
to time, have long or short positions in, and buy or sell the securities of the companies mentioned herein or engage in any other
transaction involving such securities and earn brokerage or compensation or act as advisor or have other potential conflict of interest
with respect to company/ies mentioned herein or inconsistent with any recommendation and related information and opinions.
Angel Broking Limited and affiliates may seek to provide or have engaged in providing corporate finance, investment banking or
other advisory services in a merger or specific transaction to the companies referred to in this report, as on the date of this report or
in the past.
Sebi Registration No : INB 010996539
For Private Circulation Only |