Technical Research | January 24, 2012
Daily Technical Report
Sensex (16752) / NIFTY (5046)
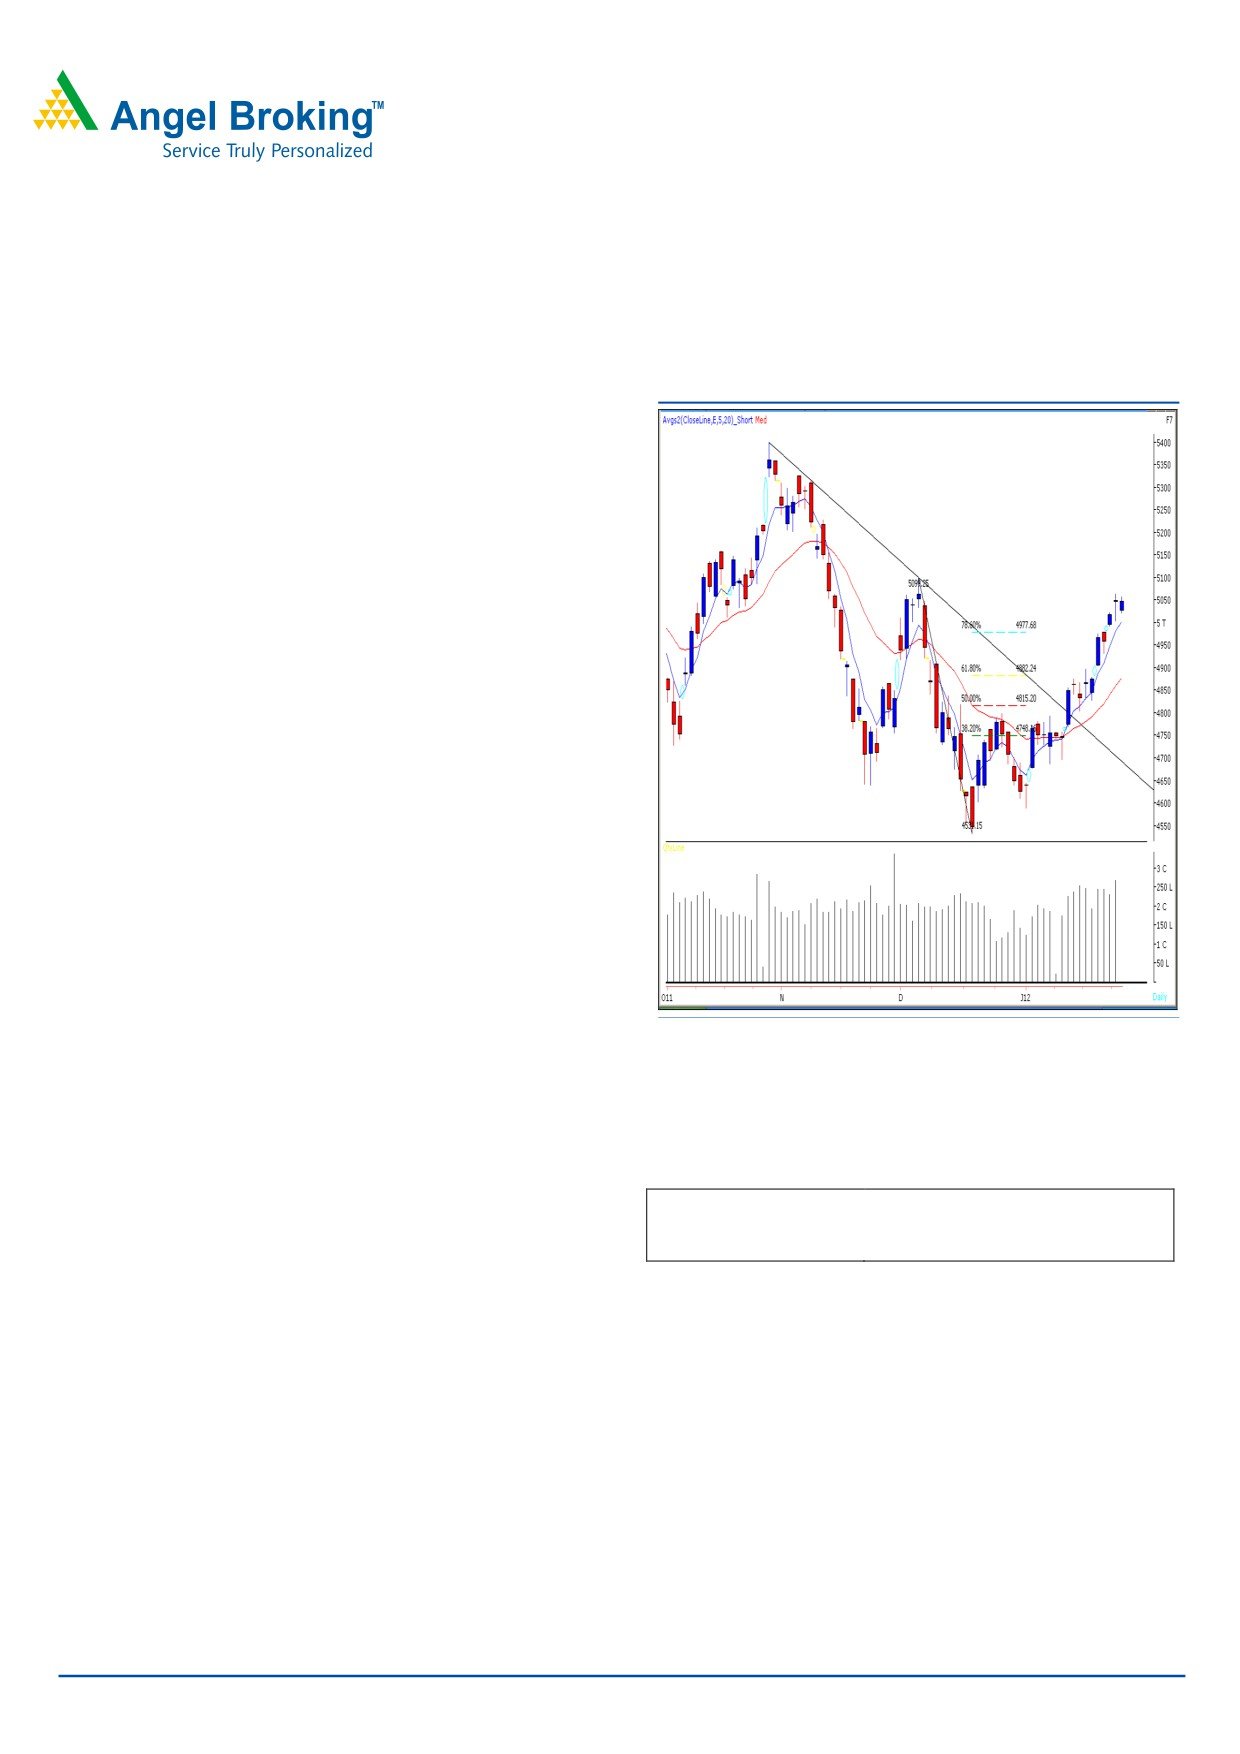
Exhibit 1: Nifty Daily Chart
Yesterday, markets opened on a flat note and traded in a
narrow range throughout the day to close marginally below
5050 mark. On the sectoral front, Metal, Oil & Gas and
Consumer Durables were among the major losers, whereas
FMCG and Realty ended on a gaining side. The advance to
decline ratio was marginally in favor of advancing counters.
Formation:
• The 20-week EMA (Exponential Moving Average) is
placed at 16504 / 4957 level.
• We are witnessing a positive crossover on weekly “RSI -
Smoothened” oscillator.
• Indices are nearing a “Downward Sloping Trend Line”
drawn by joining July 8, 2011, weekly high of 19132 /
5740 and October 28, 2011, weekly high of 17908 /
5400.
• The 200-day SMA is placed at 17384 / 5220 level.
Source: Falcon
• On the daily chart, the “Long Legged Doji” has been
formed on Friday’s session.
Trading strategy:
Actionable points:
View
Neutral
After a flat opening, indices traded in a narrow range of
Resistance levels
5064 - 5100
16784 - 16659 / 5060 - 5020 levels and finally closed
Support levels
4991- 4931
marginally below
5050 mark. Movement was seen in
individual counters but the Indices overall remained
lackluster before the announcement of the monetary policy.
Going forward, if indices sustain below
16572 / 4991
level, then indices are likely to correct towards 16384 -
16116 / 4931 - 4840 levels. On the upside, we continue to
maintain our view that only after a healthy correction or
consolidation, if indices manage to break and sustain
above 17004 / 5100, then we may witness strong upside
momentum, which can push indices to test 200-day SMA
level of 17384 / 5220 level. Traders are advised to remain
light on positions as market may witness immense volatility
during the monetary policy announcement.
For Private Circulation Only |
1
Technical Research | January 24, 2012
Bank Nifty Outlook - (9520)
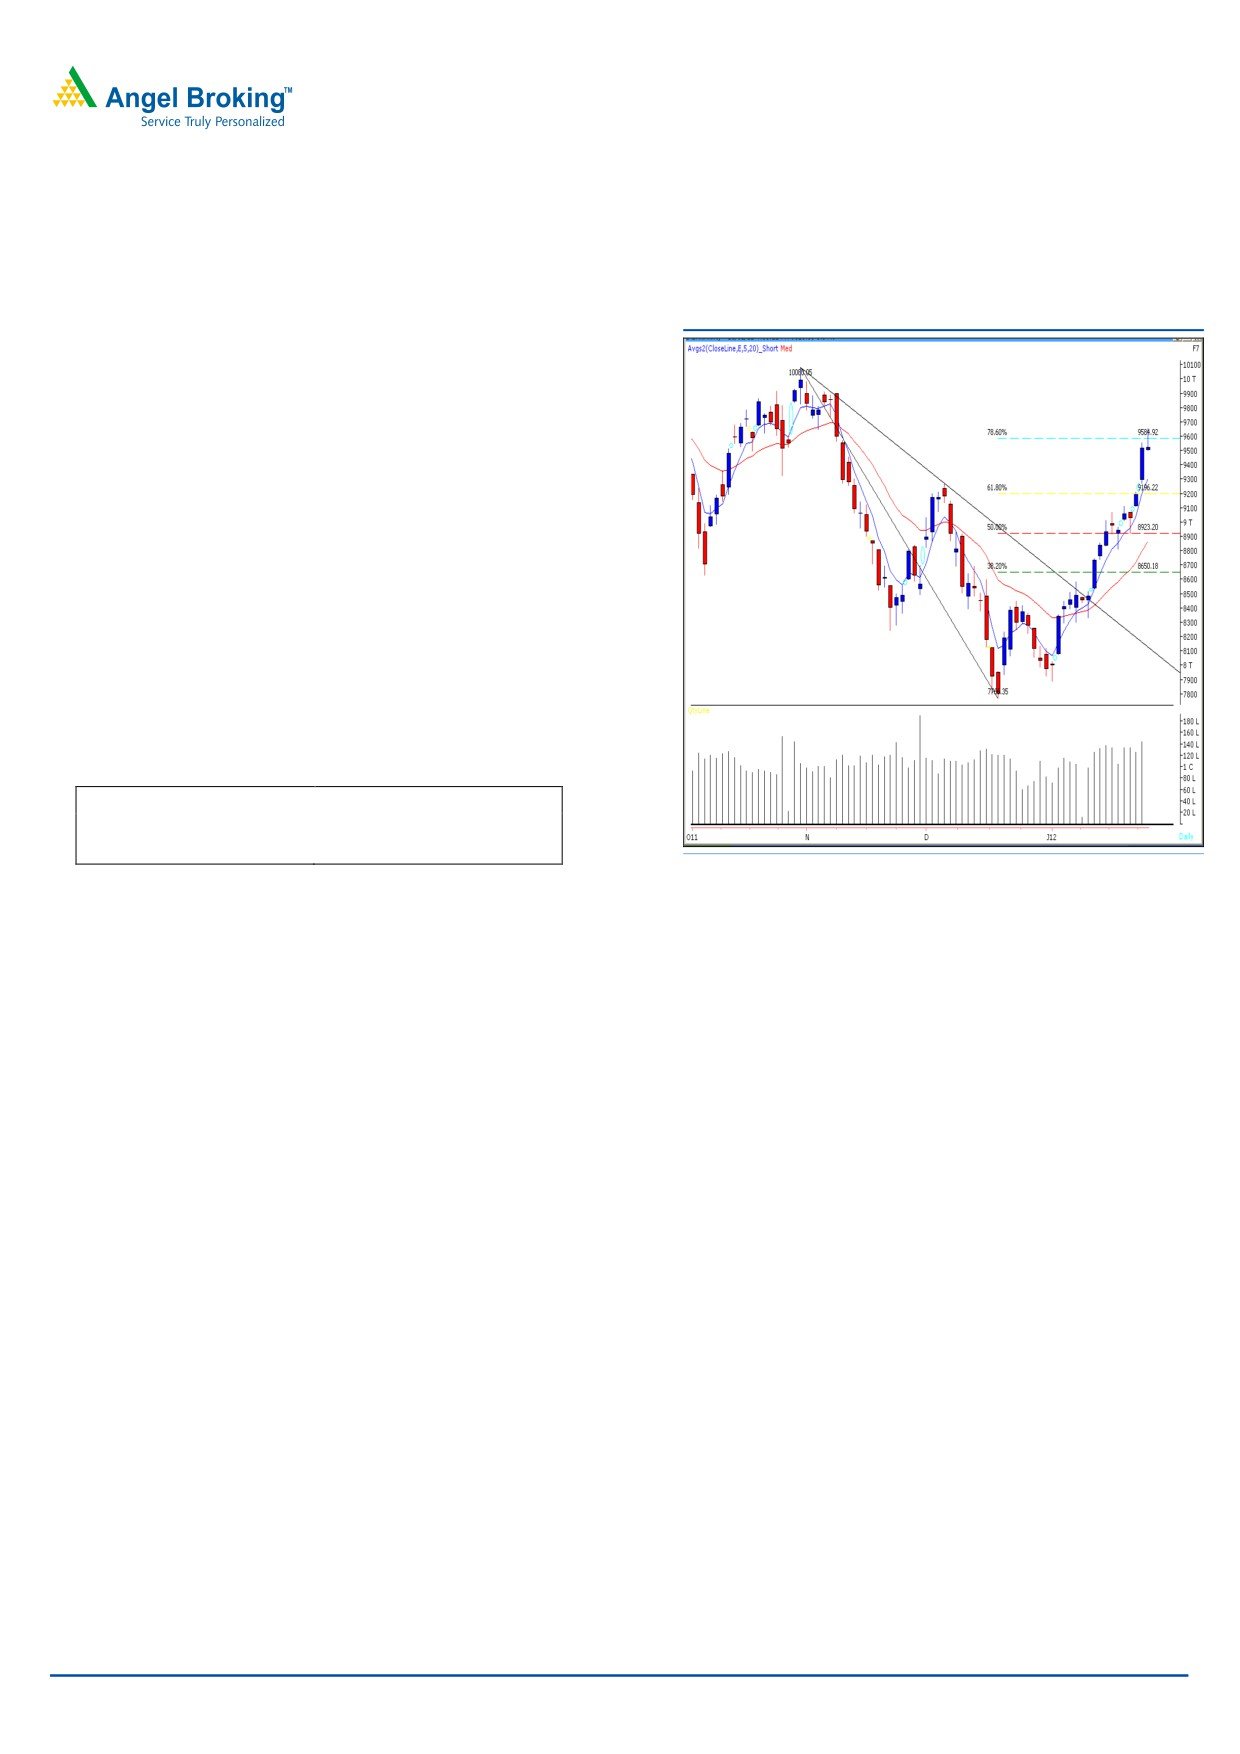
Exhibit 2: Bank Nifty Daily Chart
Yesterday, Bank Nifty opened on a flat note and traded with
positive bias in the initial part of the session. However selling
pressure was seen in the later half ad the index closed near
its initial opening level. We are witnessing a “Shooting Star”
candle stick pattern formation near 78.6% of the fall from
31st October 2011 - 20th December 2011. This pattern is a
reversal pattern but requires confirmation in the form of
closing below the low of the “Shooting star”. In such a case,
if the index trades below yesterday’s low of 9503 then it is
likely to test 9390 - 9265 levels. The high of the pattern
(9659) is likely to act as resistance in coming trading session.
The said pattern will be negated if Bank Nifty manages to
close above 9659 level.
Actionable points:
View
Neutral
Resistance Levels
9659
Support Levels
9390 - 9265
Source: Falcon
For Private Circulation Only |
2
Technical Research | January 24, 2012
Positive Bias:
Expected
Stock Name
CMP
5 Day EMA
20 Day EMA
Remarks
Target
Bharti Airtel
352.1
344.7
341.3
360
View will change below 344.3
For Private Circulation Only |
3
Technical Research | January 24, 2012
Daily Pivot Levels for Nifty 50 Stocks
SCRIPS
S2
S1
PIVOT
R1
R2
SENSEX
16,607
16,679
16,732
16,804
16,856
NIFTY
5,004
5,025
5,042
5,063
5,081
BANKNIFTY
9,405
9,463
9,561
9,619
9,717
ACC
1,123
1,144
1,156
1,177
1,189
AMBUJACEM
155
156
159
160
163
AXISBANK
962
979
1,009
1,026
1,056
BAJAJ-AUTO
1,532
1,553
1,572
1,594
1,613
BHARTIARTL
334
343
349
358
363
BHEL
270
276
280
287
291
BPCL
529
537
549
557
569
CAIRN
334
340
343
348
351
CIPLA
335
338
341
344
347
DLF
208
214
217
223
226
DRREDDY
1,619
1,633
1,646
1,660
1,672
GAIL
359
364
369
374
379
HCLTECH
411
415
420
424
428
HDFC
682
689
695
701
707
HDFCBANK
477
481
484
488
491
HEROMOTOCO
1,808
1,842
1,895
1,929
1,983
HINDALCO
131
134
139
142
147
HINDUNILVR
382
389
396
403
410
ICICIBANK
829
843
857
871
886
IDFC
115
117
120
122
125
INFY
2,575
2,588
2,602
2,614
2,628
ITC
196
200
203
207
209
JINDALSTEL
517
527
537
547
557
JPASSOCIAT
65
66
68
69
70
KOTAKBANK
458
468
484
493
510
LT
1,196
1,237
1,267
1,308
1,338
M&M
648
655
661
667
673
MARUTI
1,032
1,096
1,134
1,199
1,237
NTPC
171
173
175
178
180
ONGC
270
273
276
278
281
PNB
928
944
958
975
989
POWERGRID
99
100
102
103
104
RANBAXY
454
459
467
471
479
RCOM
88
90
91
93
95
RELCAPITAL
310
319
325
333
340
RELIANCE
744
758
769
782
793
RELINFRA
452
462
477
487
502
RPOWER
89
91
92
94
95
SAIL
91
92
93
94
95
SBIN
1,897
1,919
1,943
1,965
1,989
SESAGOA
180
184
189
194
199
SIEMENS
738
744
752
758
766
STER
102
105
110
113
117
SUNPHARMA
511
517
526
532
541
SUZLON
24
25
26
27
28
TATAMOTORS
214
217
220
222
226
TATAPOWER
102
103
106
108
110
TATASTEEL
414
420
429
435
444
TCS
1,064
1,071
1,081
1,088
1,098
WIPRO
406
411
416
421
425
Technical Research Team
For Private Circulation Only |
4
Technical Report
RESEARCH TEAM
Shardul Kulkarni
Head - Technicals
Sameet Chavan
Technical Analyst
Sacchitanand Uttekar
Technical Analyst
Mehul Kothari
Technical Analyst
Ankur Lakhotia
Technical Analyst
Research Team: 022-3952 6600
DISCLAIMER: This document is not for public distribution and has been furnished to you solely for your information and must not
be reproduced or redistributed to any other person. Persons into whose possession this document may come are required to observe
these restrictions.
Opinion expressed is our current opinion as of the date appearing on this material only. While we endeavor to update on a
reasonable basis the information discussed in this material, there may be regulatory, compliance, or other reasons that prevent us
from doing so. Prospective investors and others are cautioned that any forward-looking statements are not predictions and may be
subject to change without notice. Our proprietary trading and investment businesses may make investment decisions that are
inconsistent with the recommendations expressed herein.
The information in this document has been printed on the basis of publicly available information, internal data and other reliable
sources believed to be true and are for general guidance only. While every effort is made to ensure the accuracy and completeness of
information contained, the company takes no guarantee and assumes no liability for any errors or omissions of the information. No
one can use the information as the basis for any claim, demand or cause of action.
Recipients of this material should rely on their own investigations and take their own professional advice. Each recipient of this
document should make such investigations as it deems necessary to arrive at an independent evaluation of an investment in the
securities of companies referred to in this document (including the merits and risks involved), and should consult their own advisors to
determine the merits and risks of such an investment. Price and value of the investments referred to in this material may go up or
down. Past performance is not a guide for future performance. Certain transactions - futures, options and other derivatives as well as
non-investment grade securities - involve substantial risks and are not suitable for all investors. Reports based on technical analysis
centers on studying charts of a stock's price movement and trading volume, as opposed to focusing on a company's fundamentals
and as such, may not match with a report on a company's fundamentals.
We do not undertake to advise you as to any change of our views expressed in this document. While we would endeavor to update
the information herein on a reasonable basis, Angel Broking, its subsidiaries and associated companies, their directors and
employees are under no obligation to update or keep the information current. Also there may be regulatory, compliance, or other
reasons that may prevent Angel Broking and affiliates from doing so. Prospective investors and others are cautioned that any
forward-looking statements are not predictions and may be subject to change without notice.
Angel Broking Limited and affiliates, including the analyst who has issued this report, may, on the date of this report, and from time
to time, have long or short positions in, and buy or sell the securities of the companies mentioned herein or engage in any other
transaction involving such securities and earn brokerage or compensation or act as advisor or have other potential conflict of interest
with respect to company/ies mentioned herein or inconsistent with any recommendation and related information and opinions.
Angel Broking Limited and affiliates may seek to provide or have engaged in providing corporate finance, investment banking or
other advisory services in a merger or specific transaction to the companies referred to in this report, as on the date of this report or
in the past.
Sebi Registration No : INB 010996539
For Private Circulation Only |