Daily Technical Report
May 23, 2012
Sensex (16026) / NIFTY (4861)
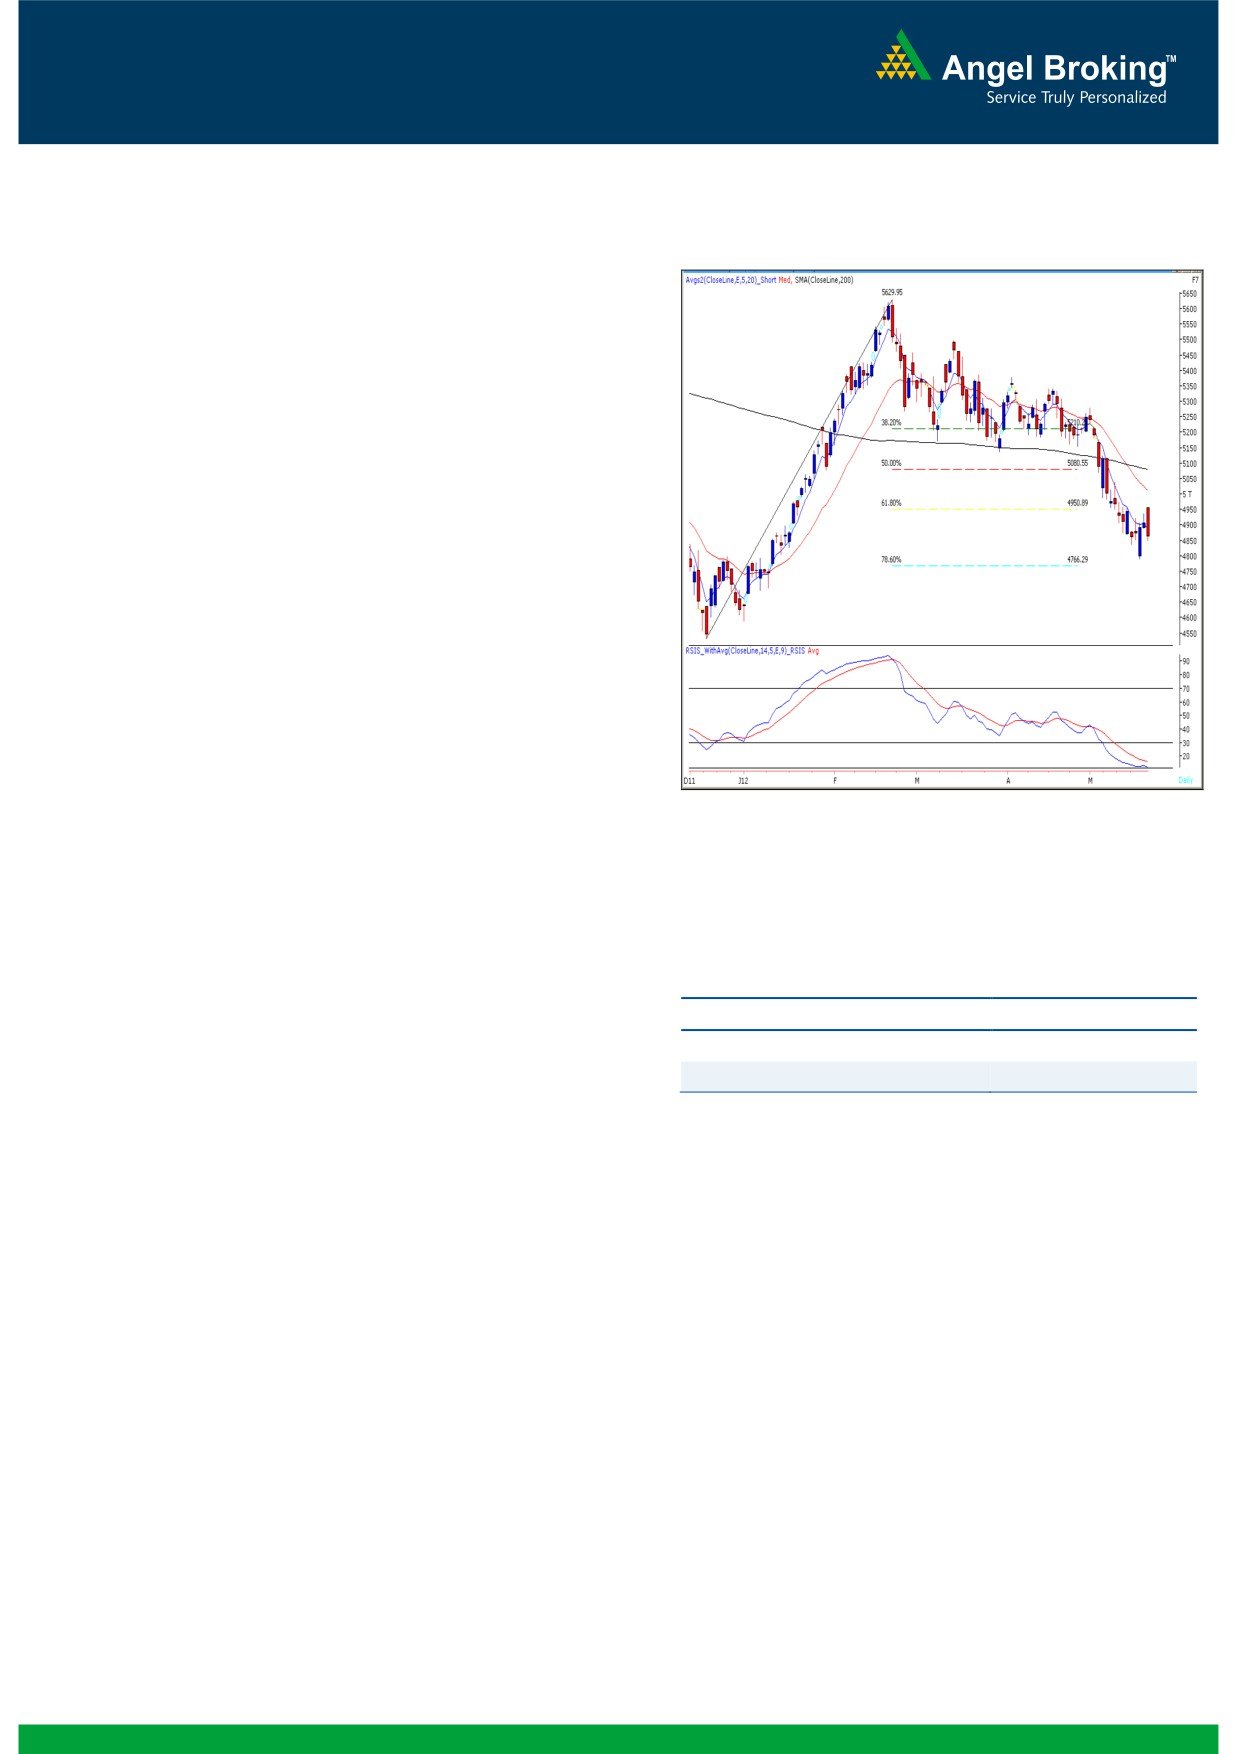
Exhibit 1: Nifty Daily Chart
Yesterday, markets opened significantly higher in-line
strong cues from European and US bourses. However,
once again sharp rupee depreciation continued to
spoil the upward momentum. As a result, indices
drifted sharply from the day’s high to close almost at
the lowest point of the day. On sectoral front, Metal,
Banking and Power corrected sharply during
yesterday’s session; whereas Teck and IT counters
ended on the gaining side. The advance to decline
ratio was strongly in favor of declining counters
Formation
The 200-day SMA (Simple Moving Average) and
20-day EMA (Exponential Moving Average) have
now shifted to 16837 / 5079 and 16532 /
5009, respectively.
The ‘20-Week EMA’ is placed at 17000 / 5150
Source: Falcon
level.
Indices have now tested the 15860 / 4766 level,
which is the 78.6% Fibonacci Retracement level
of the rise from
15135
/
4531 (Low on
December 23, 2011) to 18524 / 5630 (High on
Actionable points:
February 22, 2012).
View
Neutral
The daily ‘RSI - Smoothened’ oscillator is placed
Resistance Levels
4938 - 4957
well inside the oversold territory.
Support Levels
4840 - 4759
The candlestick pattern on the weekly chart
represents a bullish “Hammer”.
Conversely, Friday’s low of 15809 / 4789 is likely
Trading strategy:
to act as a decent support in coming trading
sessions.
Yesterday, markets opened on an optimistic note after
a flat closing on Monday's session. However,
significant rupee depreciation during the second half
had a negative impact on equity markets as we lost
all early gains and eventually closed in the negative
territory. Going forward, we maintain our view that,
although the daily chart continues to be in a lower top
lower bottom formation, due to extreme oversold
condition of 'RSI-Smoothened', we may not witness a
sharp correction in the markets. If indices manage to
sustain above last week's high of 16391 / 4957, then
they are likely to test 16700 - 16840 / 5050 - 5090
levels.
1
Daily Technical Report
May 23, 2012
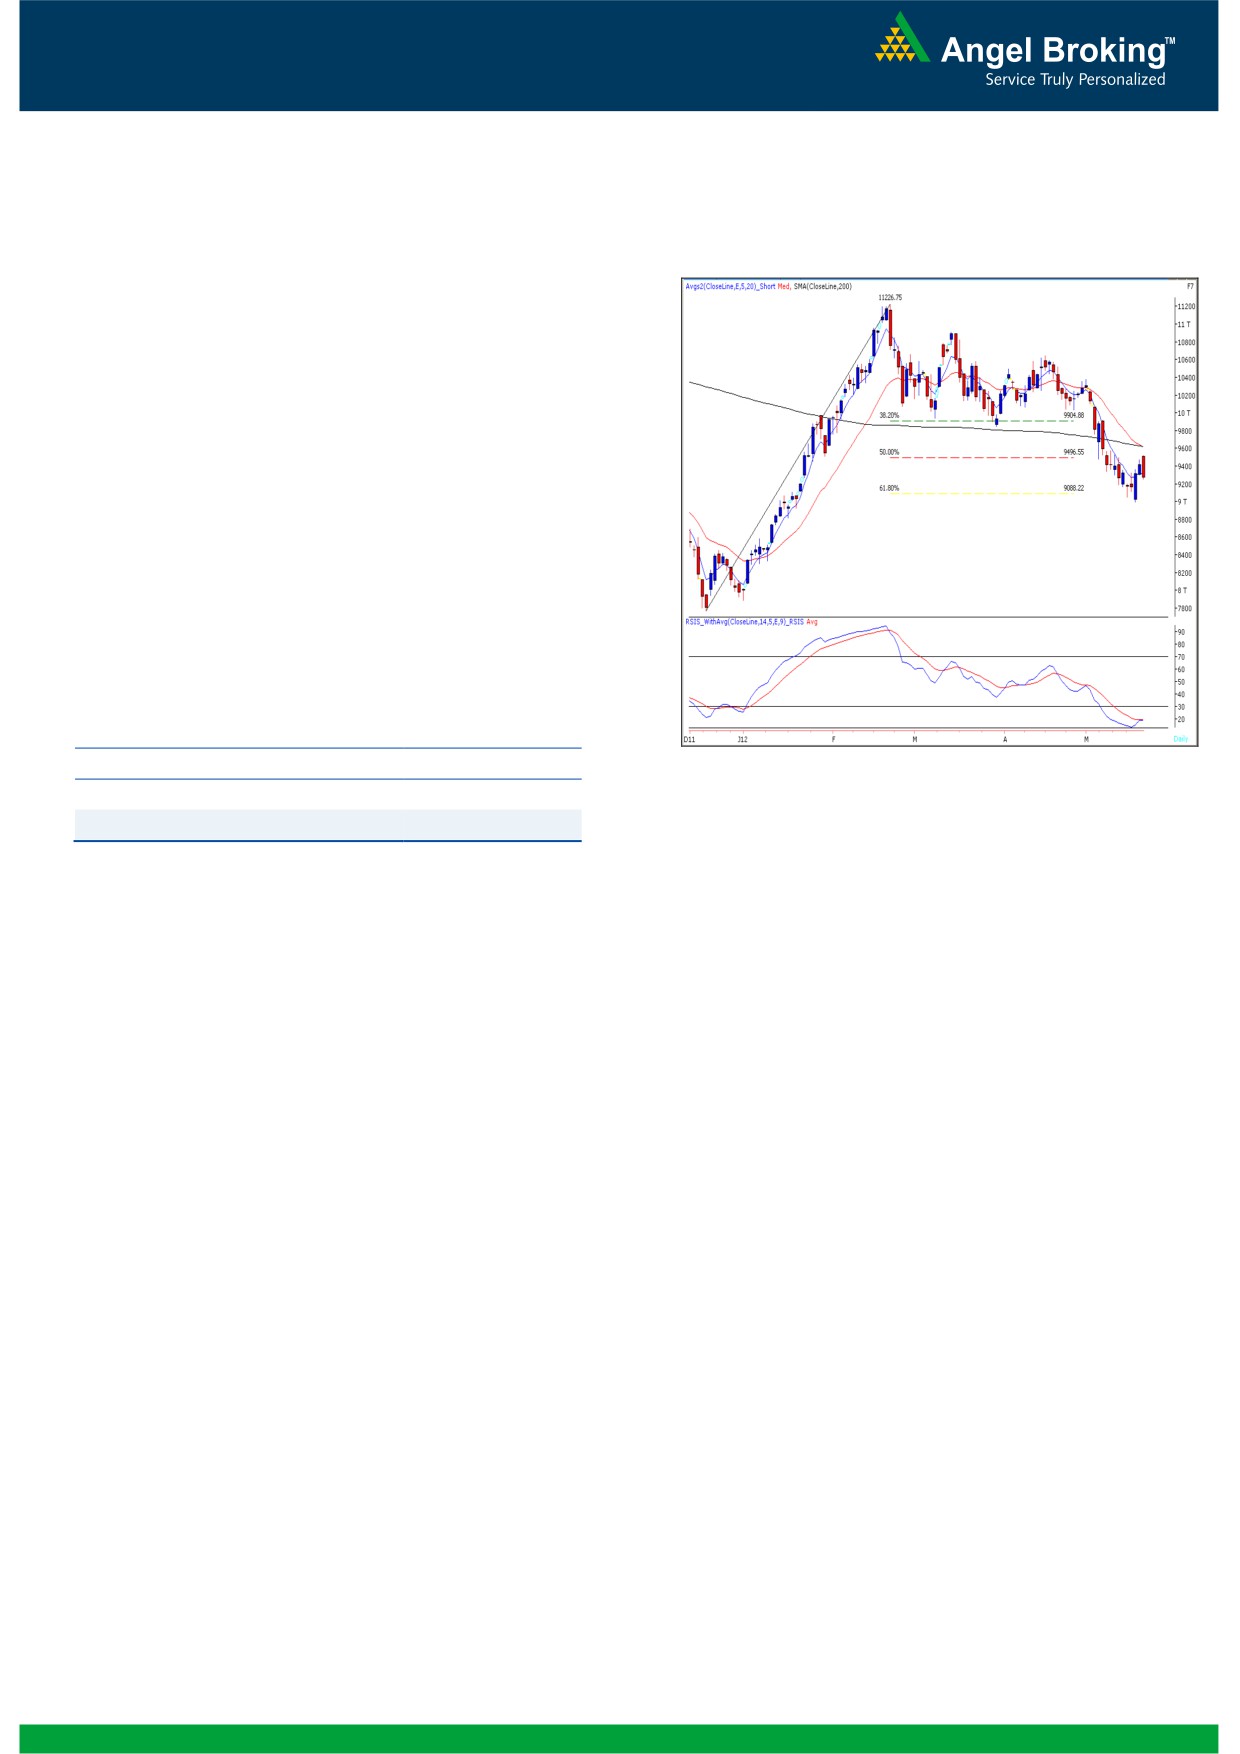
Bank Nifty Outlook - (9269)
Yesterday, Bank Nifty opened on with an upside gap
Exhibit 2: Bank Nifty Daily Chart
and traded in a narrow range during first half of the
session but pared early gains to close near the low
point of the day. As stated in our previous report we
witnessed a pullback from the mentioned resistance
level of 9533. The positive crossover in “Stochastic”
and “RSI” momentum oscillator on the daily chart
mentioned in our previous reports is still intact.
However, the momentum oscillators on the hourly
chart are negatively poised. As the momentum
oscillators on the hourly and daily chart paint a mixed
picture we expect the ongoing volatility to continue.
Thus, going forward 9377 - 9427 are likely to act as
resistance and on the downside 9194 - 9108 are
likely to act as support in coming trading session.
Actionable points:
View
Neutral
Source: Falcon
Resistance Levels
9377 - 9427
Support Levels
9194 - 9108
2
Daily Technical Report
May 23, 2012
Daily Pivot Levels for Nifty 50 Stocks
SCRIPS
S2
S1
PIVOT
R1
R2
SENSEX
15,765
15,896
16,131
16,262
16,497
NIFTY
4,782
4,821
4,889
4,928
4,995
BANKNIFTY
9,079
9,174
9,348
9,443
9,617
ACC
1,105
1,118
1,138
1,150
1,170
AMBUJACEM
136
138
142
144
147
ASIANPAINT
3,598
3,637
3,696
3,735
3,794
AXISBANK
945
955
969
979
993
BAJAJ-AUTO
1,470
1,489
1,513
1,531
1,556
BANKBARODA
648
659
669
680
690
BHARTIARTL
290
293
296
299
302
BHEL
203
206
210
212
216
BPCL
714
721
731
739
749
CAIRN
314
319
327
333
340
CIPLA
307
309
313
315
319
COALINDIA
299
302
309
312
318
DLF
179
183
188
191
197
DRREDDY
1,616
1,638
1,667
1,689
1,718
GAIL
302
308
317
323
332
GRASIM
2,319
2,356
2,402
2,438
2,484
HCLTECH
472
480
487
495
502
HDFC
628
635
644
652
661
HDFCBANK
476
482
494
501
512
HEROMOTOCO
1,811
1,832
1,863
1,884
1,916
HINDALCO
103
105
109
111
114
HINDUNILVR
418
421
425
428
432
ICICIBANK
782
791
808
818
834
IDFC
115
116
119
121
124
INFY
2,300
2,320
2,344
2,365
2,389
ITC
225
229
234
238
243
JINDALSTEL
449
456
465
471
480
JPASSOCIAT
58
60
62
64
66
KOTAKBANK
534
542
556
564
578
LT
1,119
1,139
1,175
1,195
1,231
M&M
623
631
643
651
664
MARUTI
1,093
1,123
1,174
1,205
1,255
NTPC
138
140
142
144
147
ONGC
240
242
247
249
254
PNB
709
715
723
729
737
POWERGRID
102
103
104
104
105
RANBAXY
475
484
490
499
505
RELIANCE
679
685
695
701
711
RELINFRA
428
435
448
456
468
SAIL
90
91
92
93
94
SBIN
1,861
1,900
1,970
2,009
2,079
SESAGOA
175
179
188
193
201
SIEMENS
646
658
679
691
711
STER
91
93
98
100
104
SUNPHARMA
556
565
581
590
606
TATAMOTORS
260
262
266
269
272
TATAPOWER
85
88
92
95
100
TATASTEEL
389
394
402
407
415
TCS
1,199
1,211
1,226
1,238
1,253
WIPRO
376
379
383
386
390
3
Daily Technical Report
May 23, 2012
Research Team Tel: 022 - 39357800
DISCLAIMER
This document is solely for the personal information of the recipient, and must not be singularly used as the basis of any investment
decision. Nothing in this document should be construed as investment or financial advice. Each recipient of this document should make
such investigations as they deem necessary to arrive at an independent evaluation of an investment in the securities of the companies
referred to in this document (including the merits and risks involved), and should consult their own advisors to determine the merits and
risks of such an investment.
Angel Broking Limited, its affiliates, directors, its proprietary trading and investment businesses may, from time to time, make
investment decisions that are inconsistent with or contradictory to the recommendations expressed herein. The views contained in this
document are those of the analyst, and the company may or may not subscribe to all the views expressed within.
Reports based on technical and derivative analysis center on studying charts of a stock's price movement, outstanding positions and
trading volume, as opposed to focusing on a company's fundamentals and, as such, may not match with a report on a company's
fundamentals.
The information in this document has been printed on the basis of publicly available information, internal data and other reliable
sources believed to be true, but we do not represent that it is accurate or complete and it should not be relied on as such, as this
document is for general guidance only. Angel Broking Limited or any of its affiliates/ group companies shall not be in any way
responsible for any loss or damage that may arise to any person from any inadvertent error in the information contained in this report.
Angel Broking Limited has not independently verified all the information contained within this document. Accordingly, we cannot testify,
nor make any representation or warranty, express or implied, to the accuracy, contents or data contained within this document. While
Angel Broking Limited endeavours to update on a reasonable basis the information discussed in this material, there may be regulatory,
compliance, or other reasons that prevent us from doing so.
This document is being supplied to you solely for your information, and its contents, information or data may not be reproduced,
redistributed or passed on, directly or indirectly.
Angel Broking Limited and its affiliates may seek to provide or have engaged in providing corporate finance, investment banking or
other advisory services in a merger or specific transaction to the companies referred to in this report, as on the date of this report or in
the past.
Neither Angel Broking Limited, nor its directors, employees or affiliates shall be liable for any loss or damage that may arise from or in
connection with the use of this information.
Note: Please refer to the important `Stock Holding Disclosure' report on the Angel website (Research Section). Also, please refer to the
latest update on respective stocks for the disclosure status in respect of those stocks. Angel Broking Limited and its affiliates may have
investment positions in the stocks recommended in this report.
Research Team
Shardul Kulkarni
-
Head - Technicals
Sameet Chavan
-
Technical Analyst
Sacchitanand Uttekar
-
Technical Analyst
Mehul Kothari
-
Technical Analyst
Ankur Lakhotia
-
Technical Analyst
Angel Broking Pvt. Ltd.
Registered Office: G-1, Ackruti Trade Centre, Rd. No. 7, MIDC, Andheri (E), Mumbai - 400 093.
Corporate Office: 6th Floor, Ackruti Star, MIDC, Andheri (E), Mumbai - 400 093. Tel: (022) 3952 6600
Sebi Registration No: INB 010996539
4