Technical Research | April 23, 2012
Daily Technical Report
Sensex (17374) / NIFTY (5291)
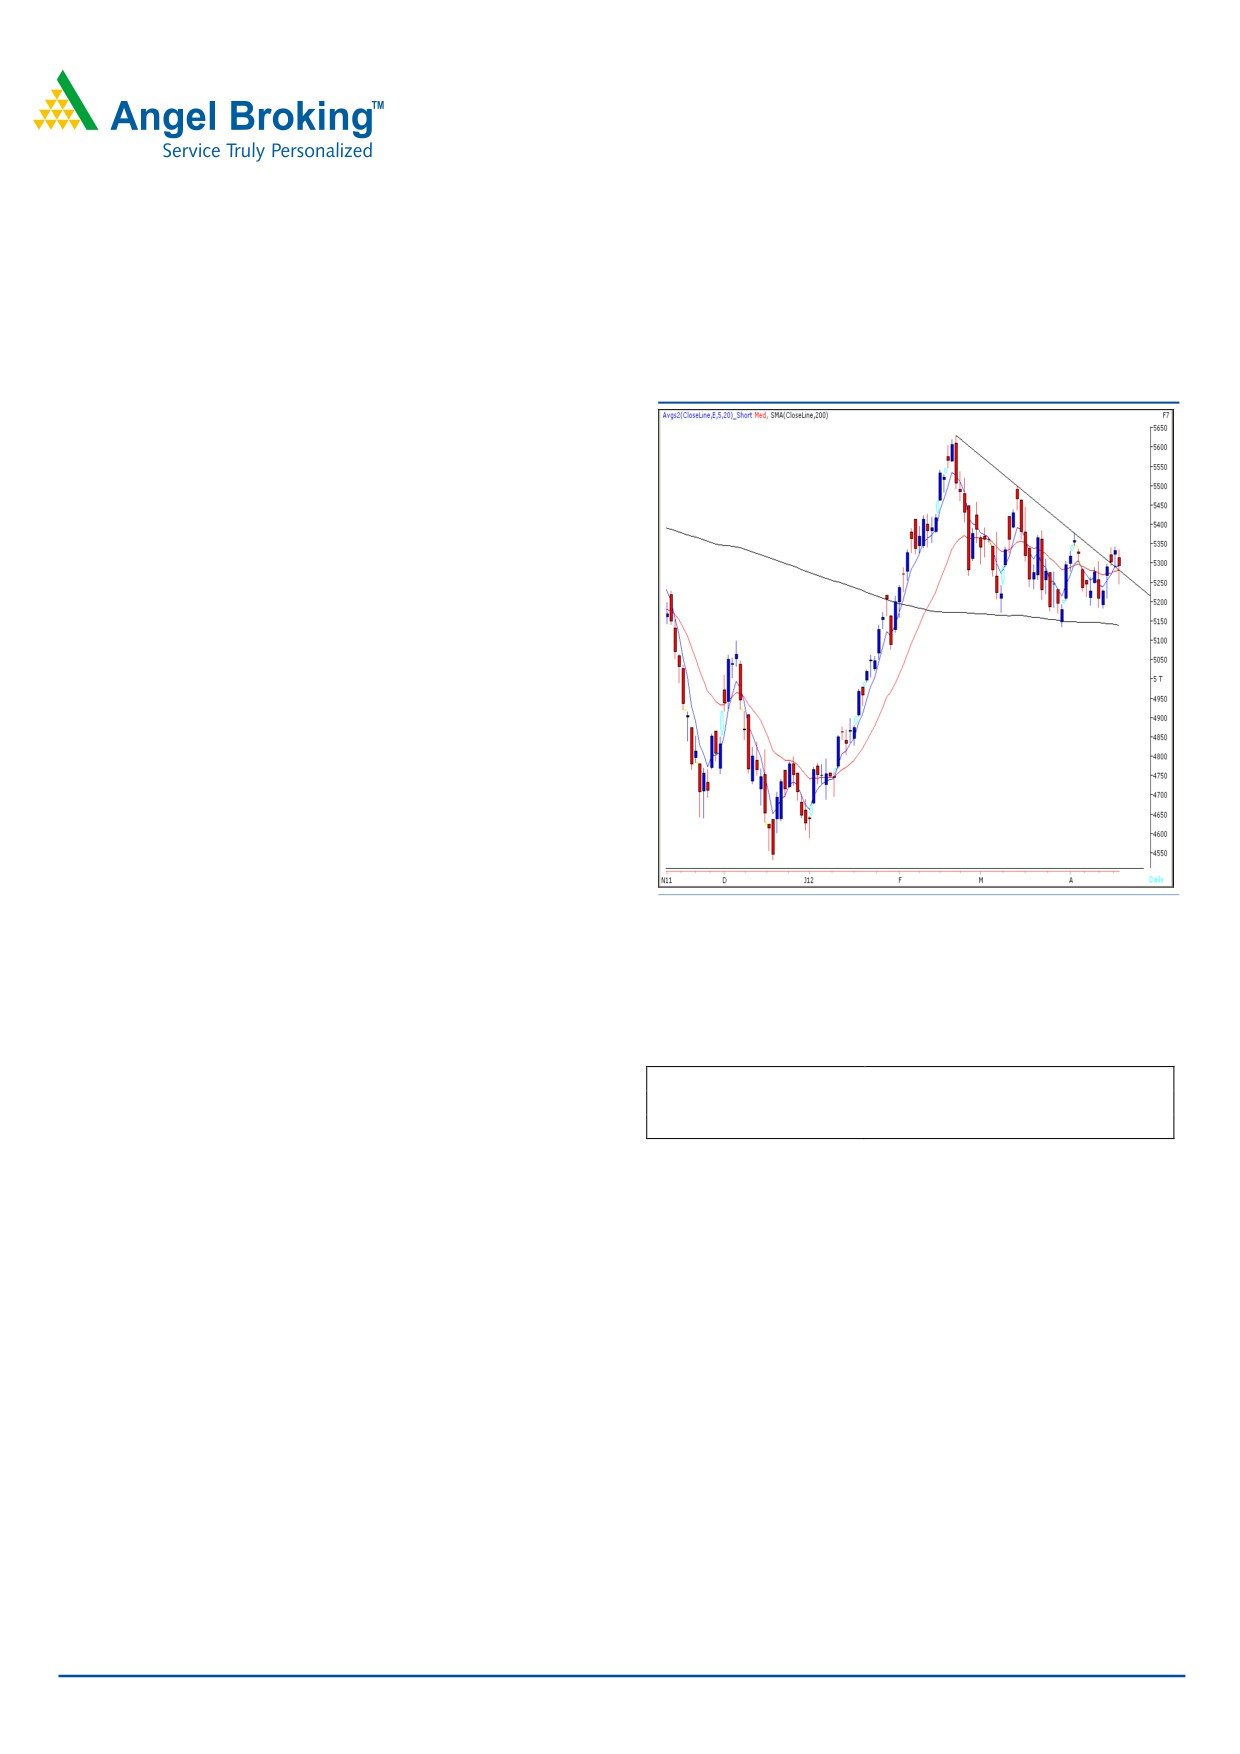
Exhibit 1: Nifty Daily Chart
On Friday, our benchmark indices opened on a flat note
and traded in a narrow range during the first half of the
session. However, profit booking during the latter half
dragged indices to close near mentioned support level of
17361 / 5291. On sectoral front, Consumer Goods, Power
and Realty counters were among the major losers, whereas
FMCG and Auto counters ended with a nominal gain. The
advance to decline ratio was in favour of declining counters
Formation:
• The 200-day SMA (Simple Moving Average) and 20-day
EMA (Exponential Moving Average) have now shifted to
17050 / 5135 and 17400 / 5300, respectively.
• The ‘20-Week EMA’ is placed at 17200 / 5200 level.
Source: Falcon
• We are witnessing a break out from the ‘Downward
Sloping Trend Line’ resistance around 17400 / 5300 level.
Actionable points:
Trading strategy:
View
Positive Above 5343
Broadly speaking, the view on the markets remains
Expected Targets
5380 - 5441
unchanged from last week and indices continue to trade in
Support Levels
5245 - 5217
the trading range of 17000 to 17530 / 5345 to 5180. Only
a breakout from the said range on either side would dictate
As a result, indices may rally towards their next resistance
the direction for the markets. This week indices managed to
levels of 17664 - 17900 / 5380 - 5441. Conversely, the
cross ‘Downward Sloping Trend Line’ resistance of 17400 /
‘200-day SMA’ level of 16920 / 5135 holds key support in
5300 level during the week. However, the movement above
coming trading sessions. A violation of this swing low may
this resistance was observed on very low volumes and
reinforce the selling pressure and then markets are likely to
hence, cannot be construed as an appropriate technical
drift towards the next support levels of 16828 - 16600 /
breakout. We are of the opinion that, if indices sustain
5076 - 5000.
above the weekly high of 17531 / 5343 on the back of
strong volumes, then we are likely to witness enhanced
buying interest among market participants.
For Private Circulation Only |
1
Technical Research | April 23, 2012
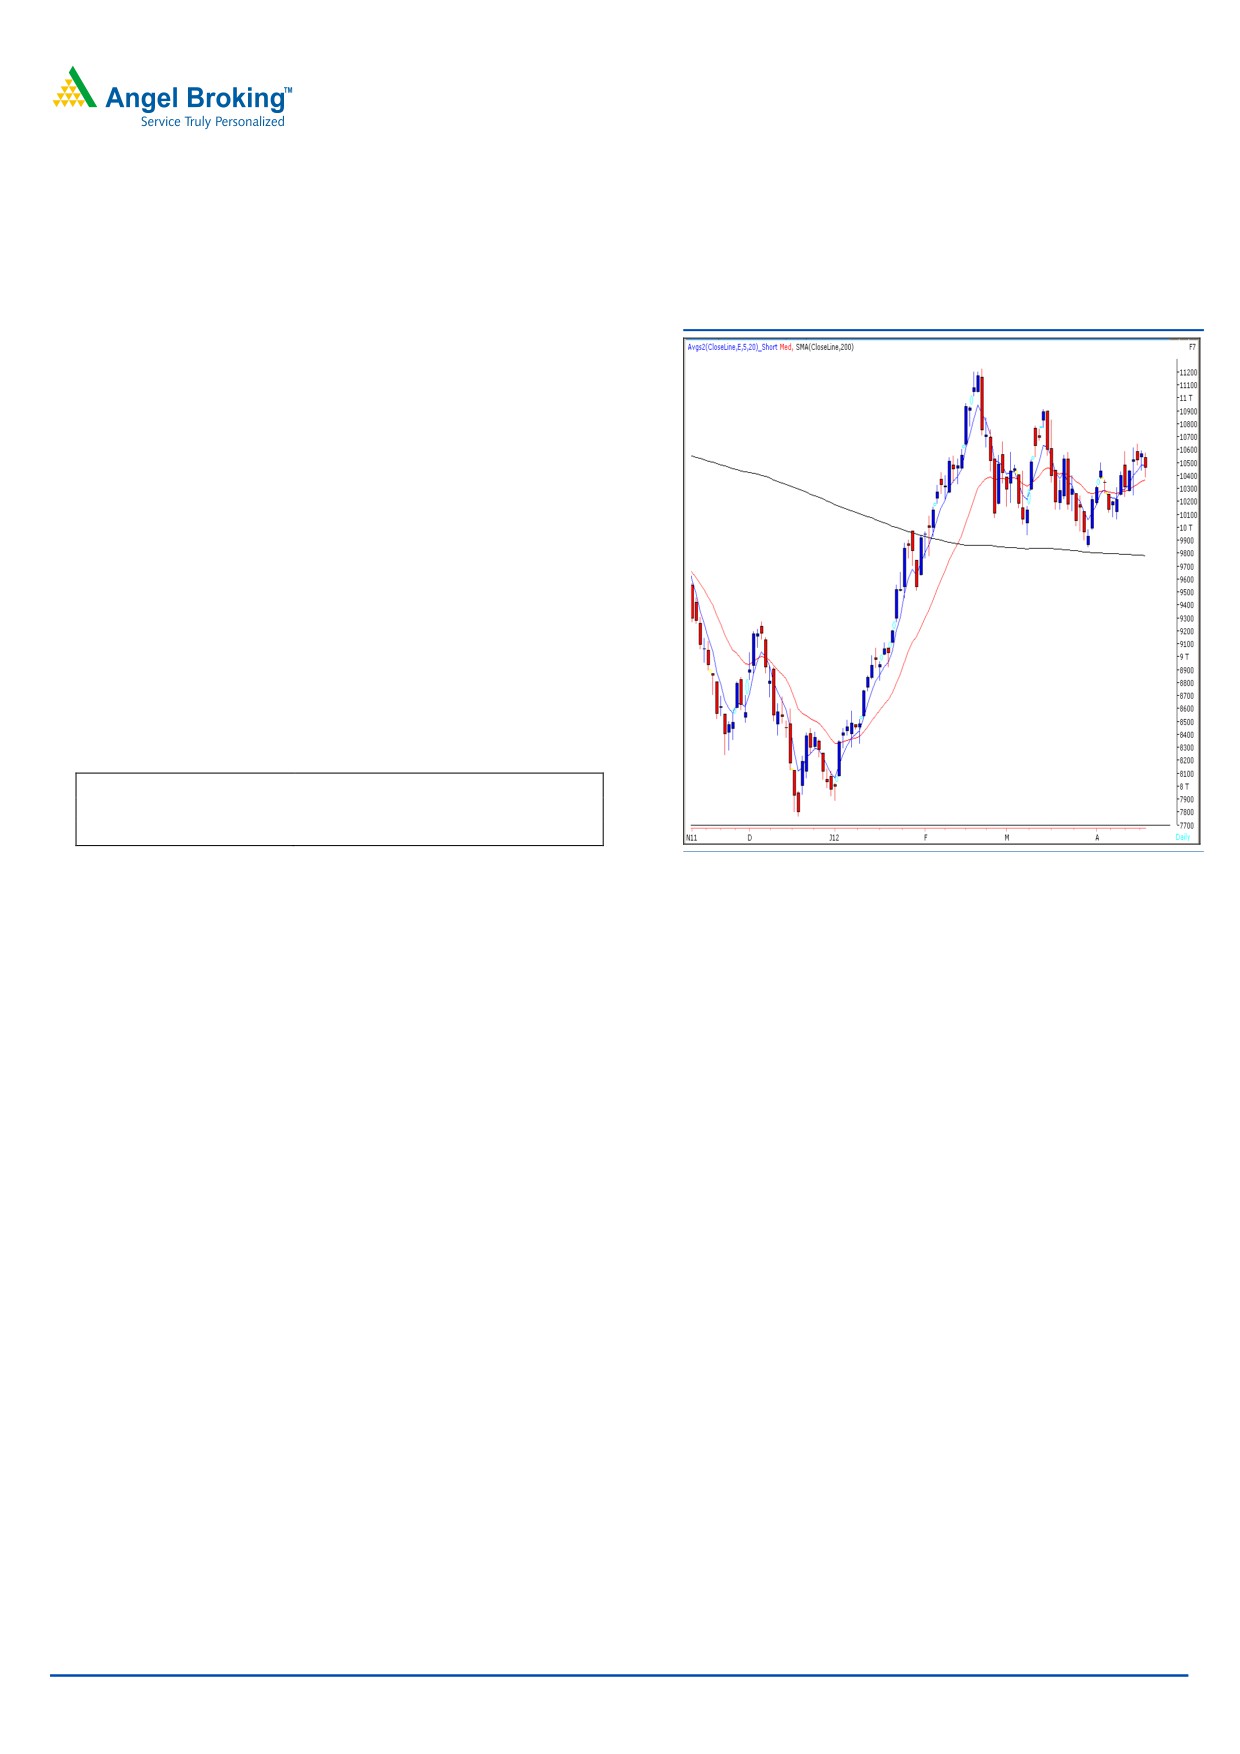
Bank Nifty Outlook - (10457)
Exhibit 2: Bank Nifty Daily Chart
On Friday, similar to the benchmark indices Bank Nifty
opened on a flat note and traded in a narrow range
almost throughout the session. However, during the last
hour of trade we witnessed some selling pressure which
dragged the index lower to test 10400 level. The trading
range of 10600 - 10150 mentioned in our previous
reports is still intact. On the upside only a sustainable
move above 10650 will give clear direction of uptrend
and the index may rally towards the resistance zone of
10750 - 10775. On the downside a sustainable move
below Friday’s low of 10387 will lead the index to test the
support zone of 10300 - 10250.
Actionable points:
View
Neutral
Resistance Levels
10580 - 10650
Support Levels
10387 - 10300 - 10250
Source: Falcon
For Private Circulation Only |
2
Technical Research | April 23, 2012
Positive Bias:
Positive
Expected
Stock Name
CMP
5 Day EMA
20 Day EMA
Remarks
Above
Target
View will change below
TECHM
711.3
711
702
726
760
699
Negative Bias:
Negative
Expected
Stock Name
CMP
5 Day EMA
20 Day EMA
Remarks
Below
Target
Bombay
View will change Above
548.3
559.3
551.2
545
500
Dyeing
574
For Private Circulation Only |
3
Technical Research | April 23, 2012
Daily Pivot Levels for Nifty 50 Stocks
SCRIPS
S2
S1
PIVOT
R1
R2
SENSEX
17,086
17,230
17,375
17,519
17,664
NIFTY
5,200
5,245
5,291
5,336
5,382
BANKNIFTY
10,283
10,370
10,474
10,560
10,664
ACC
1,180
1,203
1,222
1,245
1,264
AMBUJACEM
157
159
161
164
166
AXISBANK
1,140
1,159
1,182
1,200
1,223
BAJAJ-AUTO
1,633
1,671
1,714
1,752
1,796
BHARTIARTL
316
320
324
328
332
BHEL
237
241
247
251
257
BPCL
675
686
697
708
720
CAIRN
339
343
349
353
359
CIPLA
316
319
321
324
326
COALINDIA
352
357
361
366
370
DLF
191
194
198
202
206
DRREDDY
1,748
1,770
1,793
1,816
1,839
GAIL
353
357
361
364
368
HCLTECH
493
499
504
510
515
HDFC
669
677
684
692
699
HDFCBANK
540
546
552
557
563
HEROMOTOCO
2,153
2,171
2,194
2,213
2,236
HINDALCO
121
123
126
128
130
HINDUNILVR
412
418
422
427
431
ICICIBANK
842
851
865
875
889
IDFC
124
126
130
132
135
INFY
2,334
2,370
2,399
2,436
2,465
ITC
240
243
245
248
250
JINDALSTEL
483
495
507
519
531
JPASSOCIAT
75
77
78
80
82
KOTAKBANK
576
584
593
601
611
LT
1,253
1,272
1,294
1,313
1,335
M&M
696
711
720
736
745
MARUTI
1,359
1,375
1,396
1,412
1,433
NTPC
161
163
166
168
171
ONGC
258
262
269
273
280
PNB
879
893
909
922
939
POWERGRID
112
113
114
115
116
RANBAXY
506
512
519
525
532
RCOM
84
85
86
88
89
RELIANCE
720
726
733
739
746
RELINFRA
539
546
556
563
572
RPOWER
112
113
116
118
120
SAIL
95
96
97
98
99
SBIN
2,213
2,237
2,262
2,286
2,311
SESAGOA
184
187
191
194
198
SIEMENS
794
802
817
826
840
STER
106
108
110
111
113
SUNPHARMA
573
581
593
601
613
SUZLON
23
23
24
24
24
TATAMOTORS
308
313
317
321
325
TATAPOWER
101
103
105
107
110
TATASTEEL
459
465
470
475
480
TCS
1,061
1,075
1,091
1,105
1,122
WIPRO
417
421
424
428
432
Technical Research Team
For Private Circulation Only |
4
Technical Report
RESEARCH TEAM
Shardul Kulkarni
Head - Technicals
Sameet Chavan
Technical Analyst
Sacchitanand Uttekar
Technical Analyst
Mehul Kothari
Technical Analyst
Ankur Lakhotia
Technical Analyst
Research Team: 022-3952 6600
DISCLAIMER: This document is not for public distribution and has been furnished to you solely for your information and must not
be reproduced or redistributed to any other person. Persons into whose possession this document may come are required to observe
these restrictions.
Opinion expressed is our current opinion as of the date appearing on this material only. While we endeavor to update on a
reasonable basis the information discussed in this material, there may be regulatory, compliance, or other reasons that prevent us
from doing so. Prospective investors and others are cautioned that any forward-looking statements are not predictions and may be
subject to change without notice. Our proprietary trading and investment businesses may make investment decisions that are
inconsistent with the recommendations expressed herein.
The information in this document has been printed on the basis of publicly available information, internal data and other reliable
sources believed to be true and are for general guidance only. While every effort is made to ensure the accuracy and completeness of
information contained, the company takes no guarantee and assumes no liability for any errors or omissions of the information. No
one can use the information as the basis for any claim, demand or cause of action.
Recipients of this material should rely on their own investigations and take their own professional advice. Each recipient of this
document should make such investigations as it deems necessary to arrive at an independent evaluation of an investment in the
securities of companies referred to in this document (including the merits and risks involved), and should consult their own advisors to
determine the merits and risks of such an investment. Price and value of the investments referred to in this material may go up or
down. Past performance is not a guide for future performance. Certain transactions - futures, options and other derivatives as well as
non-investment grade securities - involve substantial risks and are not suitable for all investors. Reports based on technical analysis
centers on studying charts of a stock's price movement and trading volume, as opposed to focusing on a company's fundamentals
and as such, may not match with a report on a company's fundamentals.
We do not undertake to advise you as to any change of our views expressed in this document. While we would endeavor to update
the information herein on a reasonable basis, Angel Broking, its subsidiaries and associated companies, their directors and
employees are under no obligation to update or keep the information current. Also there may be regulatory, compliance, or other
reasons that may prevent Angel Broking and affiliates from doing so. Prospective investors and others are cautioned that any
forward-looking statements are not predictions and may be subject to change without notice.
Angel Broking Limited and affiliates, including the analyst who has issued this report, may, on the date of this report, and from time
to time, have long or short positions in, and buy or sell the securities of the companies mentioned herein or engage in any other
transaction involving such securities and earn brokerage or compensation or act as advisor or have other potential conflict of interest
with respect to company/ies mentioned herein or inconsistent with any recommendation and related information and opinions.
Angel Broking Limited and affiliates may seek to provide or have engaged in providing corporate finance, investment banking or
other advisory services in a merger or specific transaction to the companies referred to in this report, as on the date of this report or
in the past.
Sebi Registration No: INB 010996539
For Private Circulation Only |