Technical Research | January 23, 2012
Daily Technical Report
Sensex (16739) / NIFTY (5049)
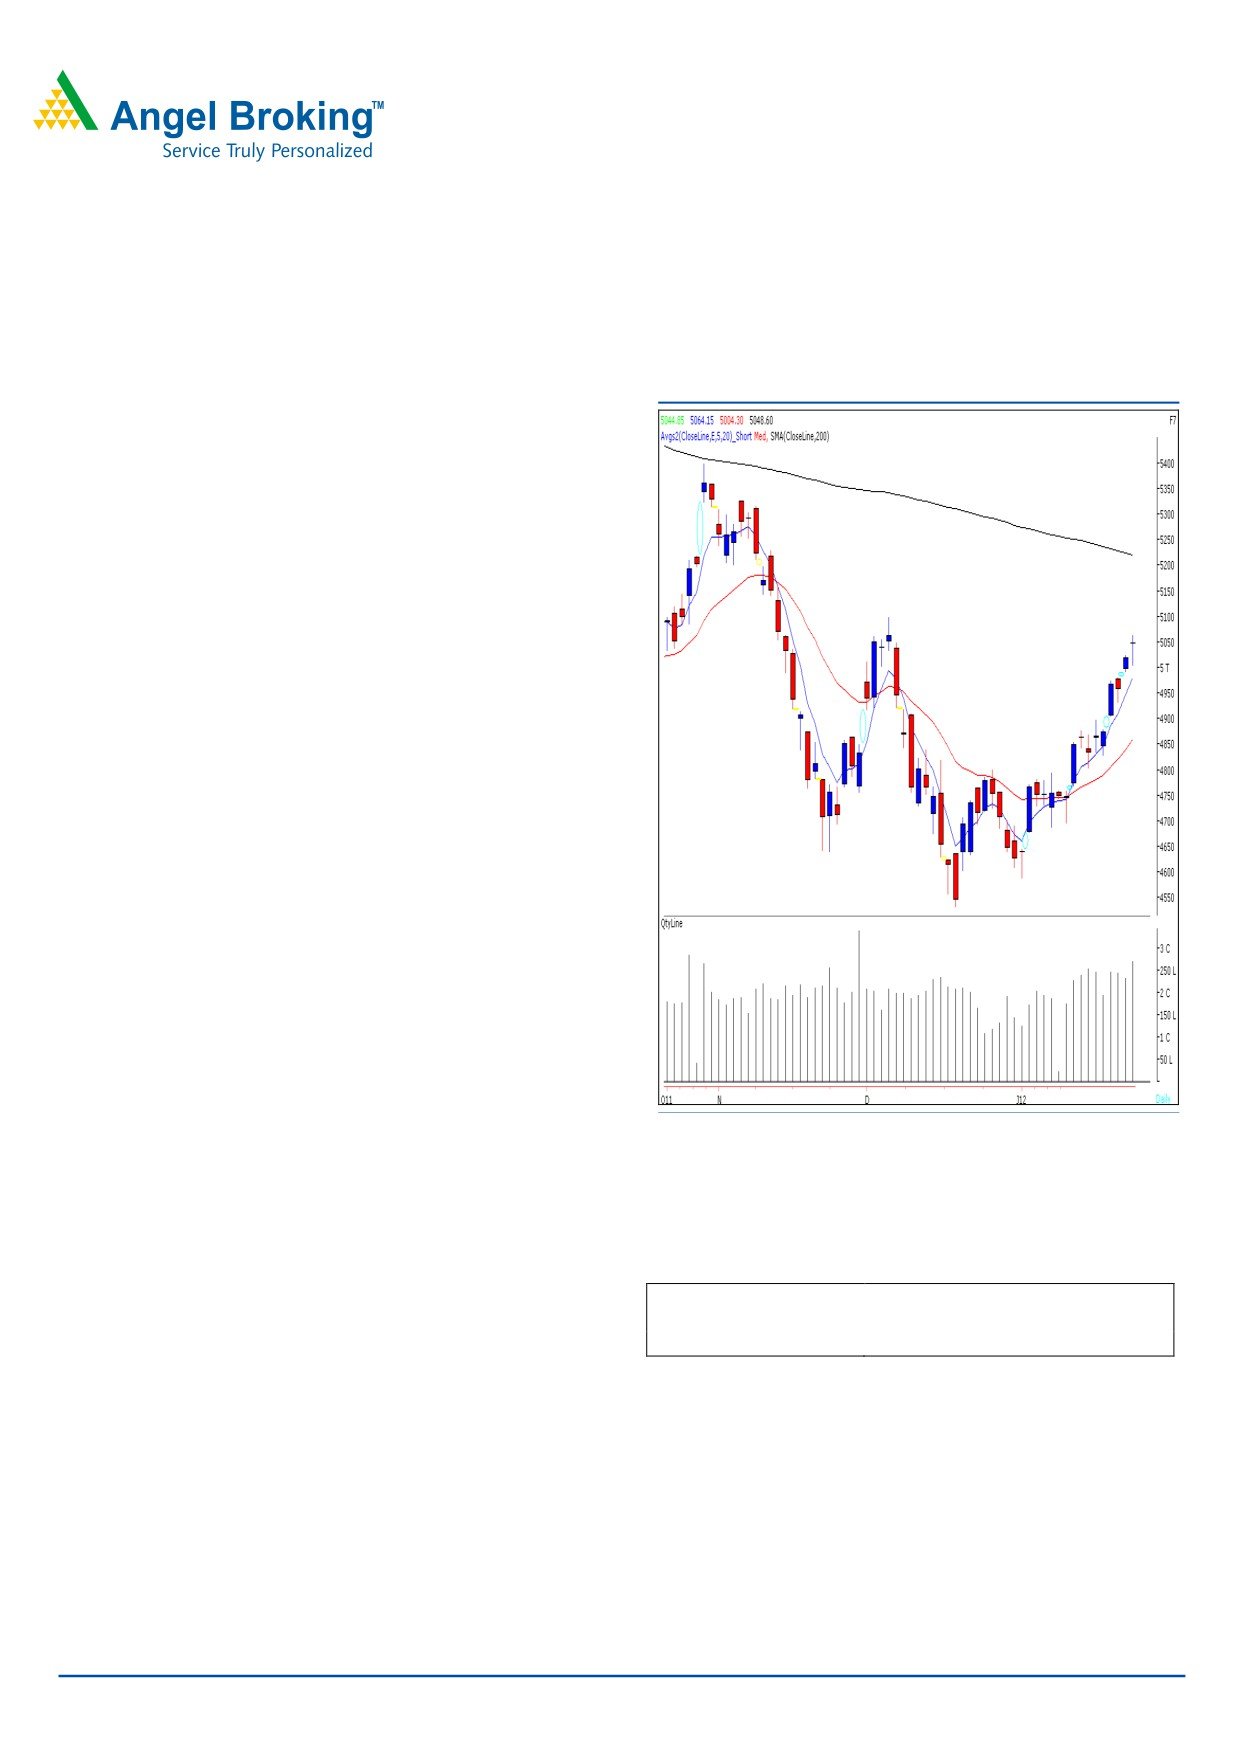
Exhibit 1: Nifty Daily Chart
On Friday, our Benchmark indices witnessed a volatile
trading session and managed to close near 5050 mark.
During the session, indices tested psychological levels of
16600 / 5000 and strong buying in final hour of trade led
Indices to close near days high. On the sectoral front,
Banking, Consumer Durables and Power sectors were
among the major gainers, whereas FMCG ended in the
negative territory. The advance to decline ratio was
marginally in favor of declining counters. (A=1363
Formation:
• The 20-week EMA (Exponential Moving Average) is
placed at 16504 / 4957 level.
• We are witnessing a positive crossover on weekly “RSI -
Smoothened” oscillator.
• Indices are nearing a “Downward Sloping Trend Line”
drawn by joining July 8, 2011, weekly high of 19132 /
5740 and October 28, 2011, weekly high of 17908 /
5400.
• The 200-day SMA is placed at 17384 / 5220 level.
Source: Falcon
• The daily chart indicates formation of “Gravestone
Doji” Japanese candlestick pattern.
Trading strategy:
Actionable points:
View
Neutral
Last week indices have rallied significantly after crossing
Resistance levels
5064 - 5100
16421 / 4920 level and have managed to close almost at
Support levels
4991- 4931
the highest point of the week. Markets are now nearing
strong resistance level of 17004 / 5100. Also, as mentioned
Also, we are observing a positive crossover on weekly “RSI
above, the “Gravestone Doji” candlestick pattern indicates
- Smoothened” oscillator. Therefore, after a healthy
the possibility of a profit booking or a consolidation. We
correction or consolidation, if indices manage to break and
advise traders to book profits in individual counters and stay
sustain above 17004 / 5100, then we may witness strong
light on positions. Going forward, if indices sustain below
upside momentum, which can push indices to test 200-day
16572 / 4991 level, then indices are likely to correct
SMA level of 17384 / 5220 level. In the coming week,
towards 16384 - 16116 / 4931 - 4840 levels. Conversely,
traders are advised to stay cautious as volatility is likely to
indices have closed convincingly above the 20-week EMA
increase on account of the RBI’s monetary policy and
placed at 16504 / 4957 level.
derivative expiry.
For Private Circulation Only |
1
Technical Research | January 23, 2012
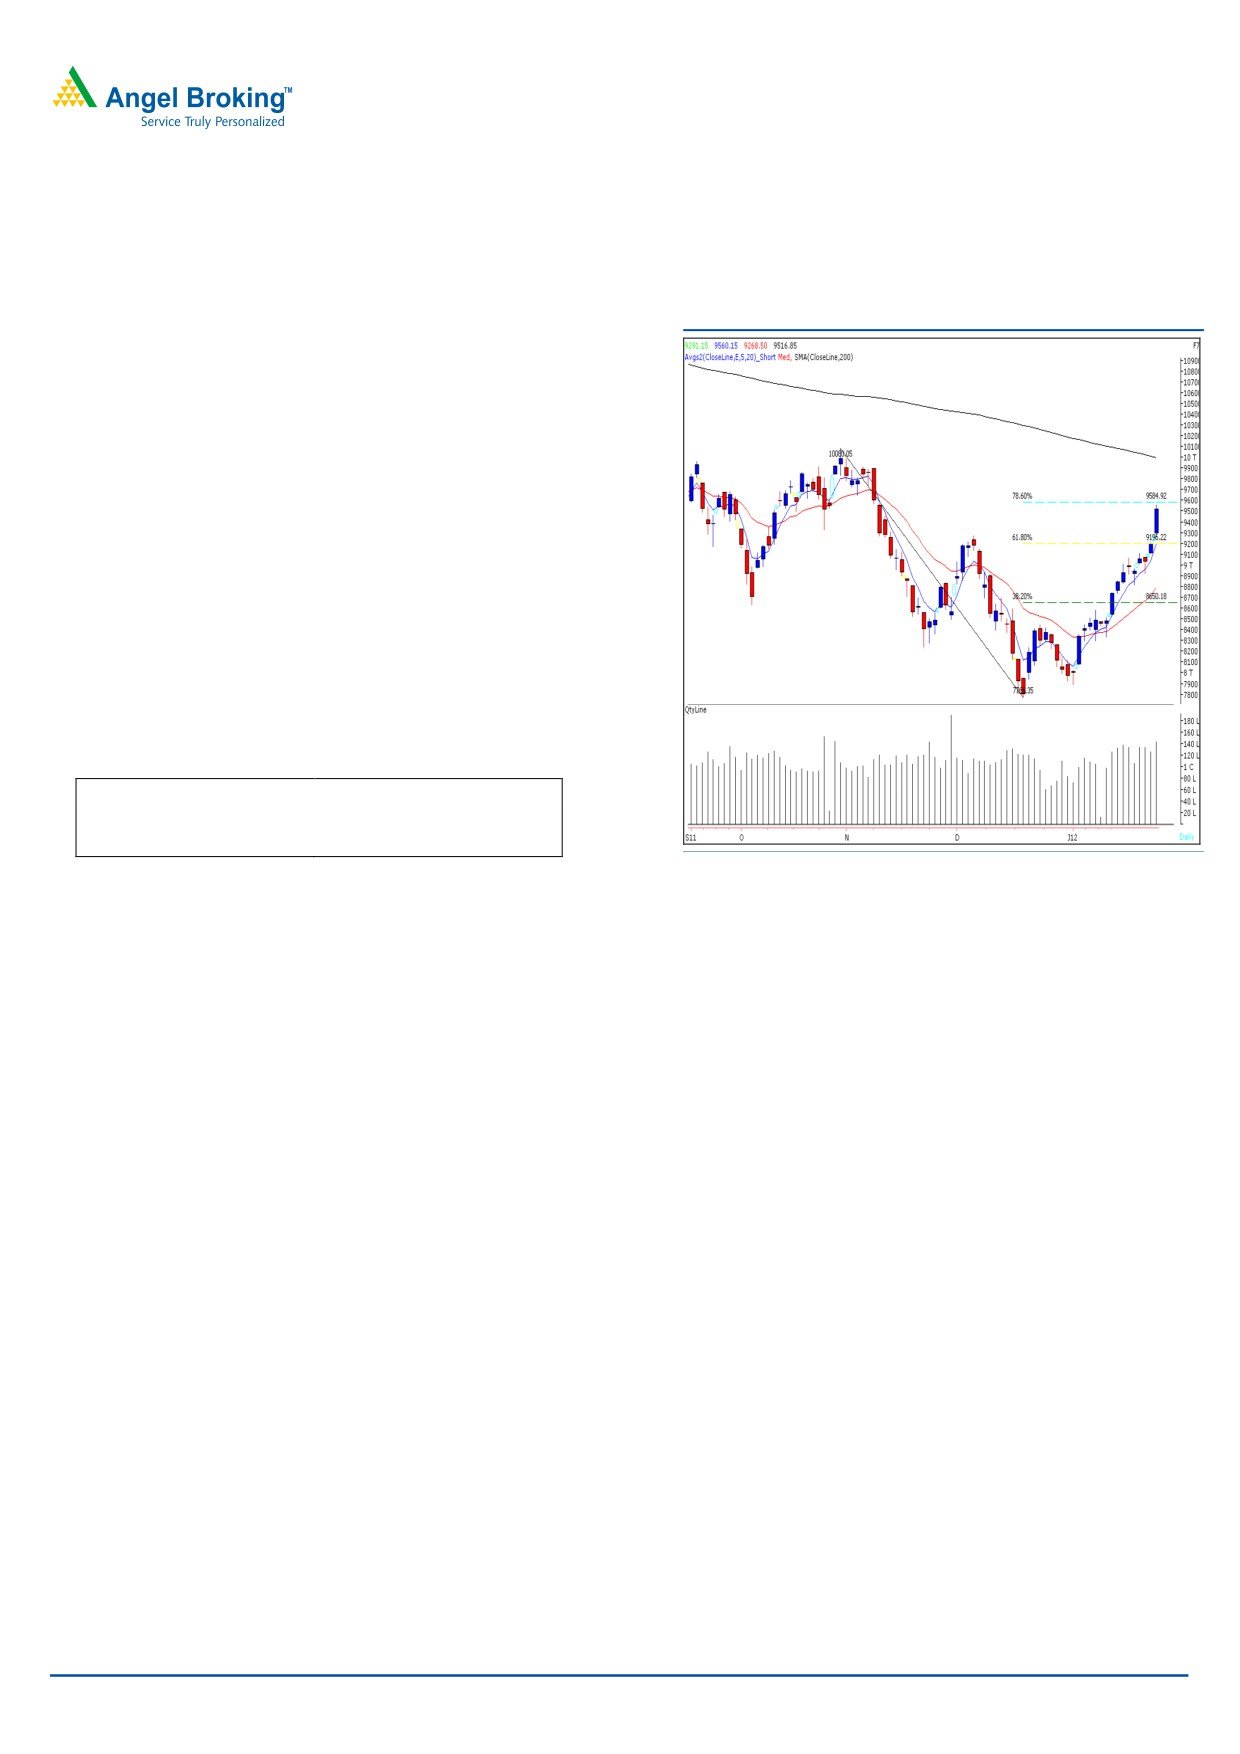
Bank Nifty Outlook - (9517)
Exhibit 2: Bank Nifty Daily Chart
On Friday’s session, once again Bank Nifty opened with an
upside gap, and gained momentum as the day progressed
to close near day’s high. The index tested 78.6% Fibonacci
retracement of the fall from 31st October 2011 - 20th
December 2011. We are now observing a positive crossover
in “ADX (9)” indicator on the weekly chart. The effect of this
indicator will be witnessed if the index manages to sustain
above Friday’s high of 9560. In such a case Bank Nifty is
likely to test 9650 - 9900 levels. On the downside 9390 -
9265 levels are likely to act as support in coming trading
session.
Actionable points:
View
Neutral
Resistance Levels
9650 - 9900
Support Levels
9390 - 9265
Source: Falcon
For Private Circulation Only |
2
Technical Research | January 23, 2012
Positive Bias:
Expected
Stock Name
CMP
5 Day EMA
20 Day EMA
Remarks
Target
BHEL
273.7
271.2
262.6
285
View will change below 266
Negative Bias:
Expected
Stock Name
CMP
5 Day EMA
20 Day EMA
Remarks
Target
Grasim
2489.2
2493
2460.9
2390
View will change above 2530
For Private Circulation Only |
3
Technical Research | January 23, 2012
Daily Pivot Levels for Nifty 50 Stocks
SCRIPS
S2
S1
PIVOT
R1
R2
SENSEX
16,536
16,638
16,713
16,814
16,890
NIFTY
4,979
5,014
5,039
5,074
5,099
BANKNIFTY
9,157
9,337
9,449
9,629
9,740
ACC
1,131
1,140
1,150
1,160
1,170
AMBUJACEM
154
156
159
162
165
AXISBANK
930
970
995
1,034
1,059
BAJAJ-AUTO
1,418
1,490
1,532
1,604
1,646
BHARTIARTL
333
338
342
347
352
BHEL
262
268
272
278
283
BPCL
527
544
554
571
582
CAIRN
339
343
346
350
354
CIPLA
328
333
337
342
346
DLF
209
211
214
217
220
DRREDDY
1,595
1,620
1,657
1,682
1,719
GAIL
361
367
371
377
382
HCLTECH
404
411
417
423
429
HDFC
680
686
690
697
701
HDFCBANK
475
483
488
496
501
HEROMOTOCO
1,814
1,880
1,938
2,004
2,062
HINDALCO
138
141
144
147
150
HINDUNILVR
387
389
391
393
396
ICICIBANK
798
820
836
858
874
IDFC
110
115
122
128
135
INFY
2,558
2,574
2,592
2,607
2,625
ITC
193
197
204
208
216
JINDALSTEL
509
522
531
544
553
JPASSOCIAT
64
66
67
68
70
KOTAKBANK
460
477
488
505
515
LT
1,238
1,256
1,275
1,293
1,311
M&M
628
642
661
675
694
MARUTI
1,058
1,081
1,108
1,131
1,158
NTPC
169
172
174
177
179
ONGC
266
271
274
279
283
PNB
900
924
940
964
980
POWERGRID
99
100
101
102
103
RANBAXY
454
461
468
475
481
RCOM
86
88
91
93
95
RELCAPITAL
307
315
325
333
343
RELIANCE
760
776
788
804
816
RELINFRA
452
466
481
495
510
RPOWER
89
90
91
93
94
SAIL
88
90
91
93
95
SBIN
1,875
1,904
1,924
1,953
1,973
SESAGOA
184
187
190
193
196
SIEMENS
734
744
753
763
771
STER
110
112
115
117
120
SUNPHARMA
514
521
528
536
543
SUZLON
22
23
24
25
26
TATAMOTORS
213
216
219
222
224
TATAPOWER
102
104
105
107
108
TATASTEEL
423
430
437
444
451
TCS
1,063
1,071
1,081
1,089
1,099
WIPRO
401
408
416
422
431
Technical Research Team
For Private Circulation Only |
4
Technical Report
RESEARCH TEAM
Shardul Kulkarni
Head - Technicals
Sameet Chavan
Technical Analyst
Sacchitanand Uttekar
Technical Analyst
Mehul Kothari
Technical Analyst
Ankur Lakhotia
Technical Analyst
Research Team: 022-3952 6600
DISCLAIMER: This document is not for public distribution and has been furnished to you solely for your information and must not
be reproduced or redistributed to any other person. Persons into whose possession this document may come are required to observe
these restrictions.
Opinion expressed is our current opinion as of the date appearing on this material only. While we endeavor to update on a
reasonable basis the information discussed in this material, there may be regulatory, compliance, or other reasons that prevent us
from doing so. Prospective investors and others are cautioned that any forward-looking statements are not predictions and may be
subject to change without notice. Our proprietary trading and investment businesses may make investment decisions that are
inconsistent with the recommendations expressed herein.
The information in this document has been printed on the basis of publicly available information, internal data and other reliable
sources believed to be true and are for general guidance only. While every effort is made to ensure the accuracy and completeness of
information contained, the company takes no guarantee and assumes no liability for any errors or omissions of the information. No
one can use the information as the basis for any claim, demand or cause of action.
Recipients of this material should rely on their own investigations and take their own professional advice. Each recipient of this
document should make such investigations as it deems necessary to arrive at an independent evaluation of an investment in the
securities of companies referred to in this document (including the merits and risks involved), and should consult their own advisors to
determine the merits and risks of such an investment. Price and value of the investments referred to in this material may go up or
down. Past performance is not a guide for future performance. Certain transactions - futures, options and other derivatives as well as
non-investment grade securities - involve substantial risks and are not suitable for all investors. Reports based on technical analysis
centers on studying charts of a stock's price movement and trading volume, as opposed to focusing on a company's fundamentals
and as such, may not match with a report on a company's fundamentals.
We do not undertake to advise you as to any change of our views expressed in this document. While we would endeavor to update
the information herein on a reasonable basis, Angel Broking, its subsidiaries and associated companies, their directors and
employees are under no obligation to update or keep the information current. Also there may be regulatory, compliance, or other
reasons that may prevent Angel Broking and affiliates from doing so. Prospective investors and others are cautioned that any
forward-looking statements are not predictions and may be subject to change without notice.
Angel Broking Limited and affiliates, including the analyst who has issued this report, may, on the date of this report, and from time
to time, have long or short positions in, and buy or sell the securities of the companies mentioned herein or engage in any other
transaction involving such securities and earn brokerage or compensation or act as advisor or have other potential conflict of interest
with respect to company/ies mentioned herein or inconsistent with any recommendation and related information and opinions.
Angel Broking Limited and affiliates may seek to provide or have engaged in providing corporate finance, investment banking or
other advisory services in a merger or specific transaction to the companies referred to in this report, as on the date of this report or
in the past.
Sebi Registration No : INB 010996539
For Private Circulation Only |