Technical Research | December 23, 2011
Daily Technical Report
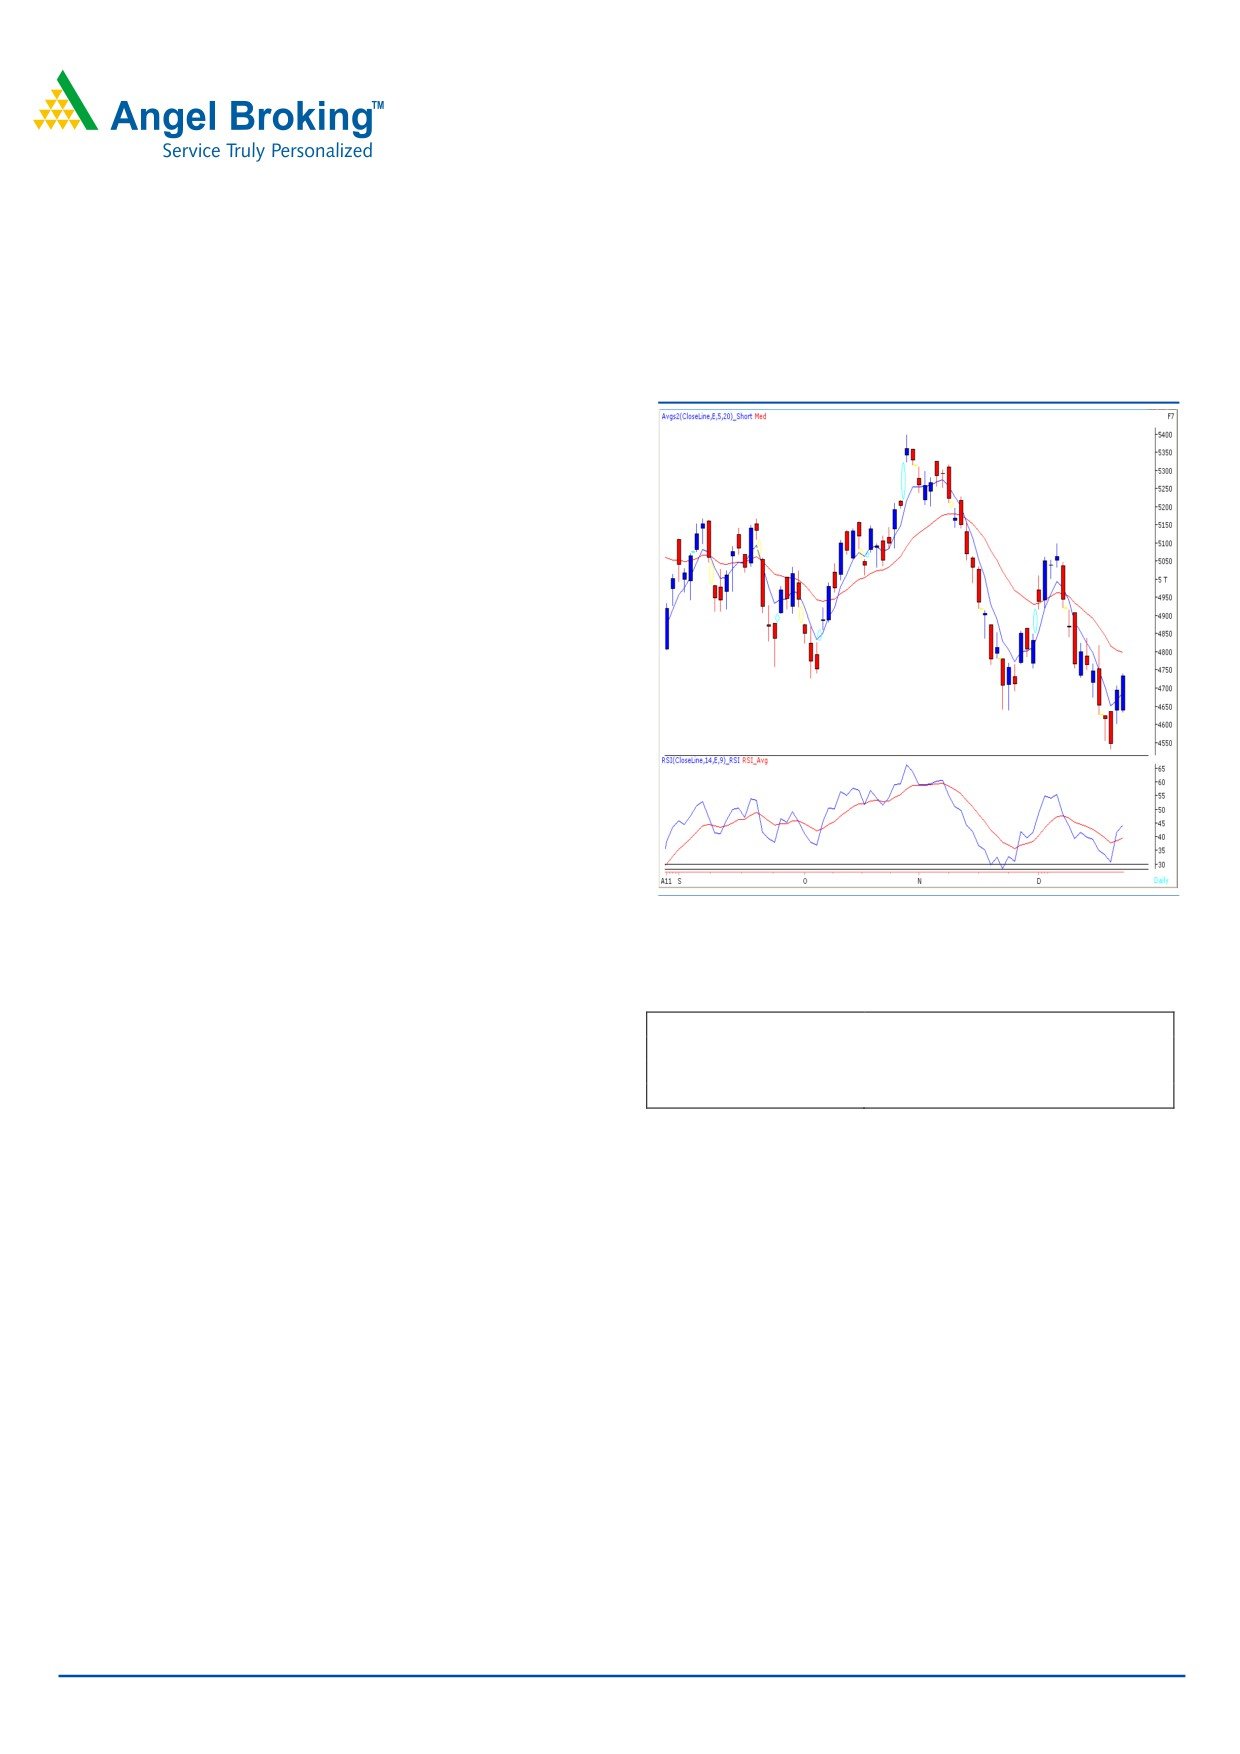
Sensex (15813) / NIFTY (4734)
Exhibit 1: Nifty Daily Chart
Yesterday, markets opened with a downside gap on the
back of weak global cues but strong positive momentum in
the second half pushed indices higher to close well above
4700 mark. On the sectoral front, Realty, Banking and
Power sectors contributed heavily in yesterday’s rally,
whereas IT and Teck counters ended on a losing side. The
advance to decline ratio was in favor of advancing
counters.
(A=1547 D=1149).
(Source
-
Formation
• On the Daily chart, we are witnessing a positive
crossover in “RSI” momentum oscillator.
• The 20 EMA on the daily chart is placed at 16020 /
4800.
Source: Falcon
Actionable points:
Trading strategy:
Yesterday, indices opened lower and drifted towards the
View
Positive
mentioned support level of 15450 / 4638 during the first
Buy above
4741
Target levels
4800 - 4838
half. However, strong buying emerged near day's low which
Support levels
4678 - 4638
pushed indices higher to cross yesterday's high of 15727 /
4707 and then move towards the expected resistance level
of 15850 / 4754. The positive crossover in daily “RSI”
momentum oscillator is still intact. Hence, this upside
momentum is likely to continue and indices may rally
towards the 20 days EMA level of 16020 / 4800. On the
downside, 15626 - 15450 /4678 - 4638 levels are likely to
act as support in coming trading sessions.
For Private Circulation Only |
1
Technical Research | December 23, 2011
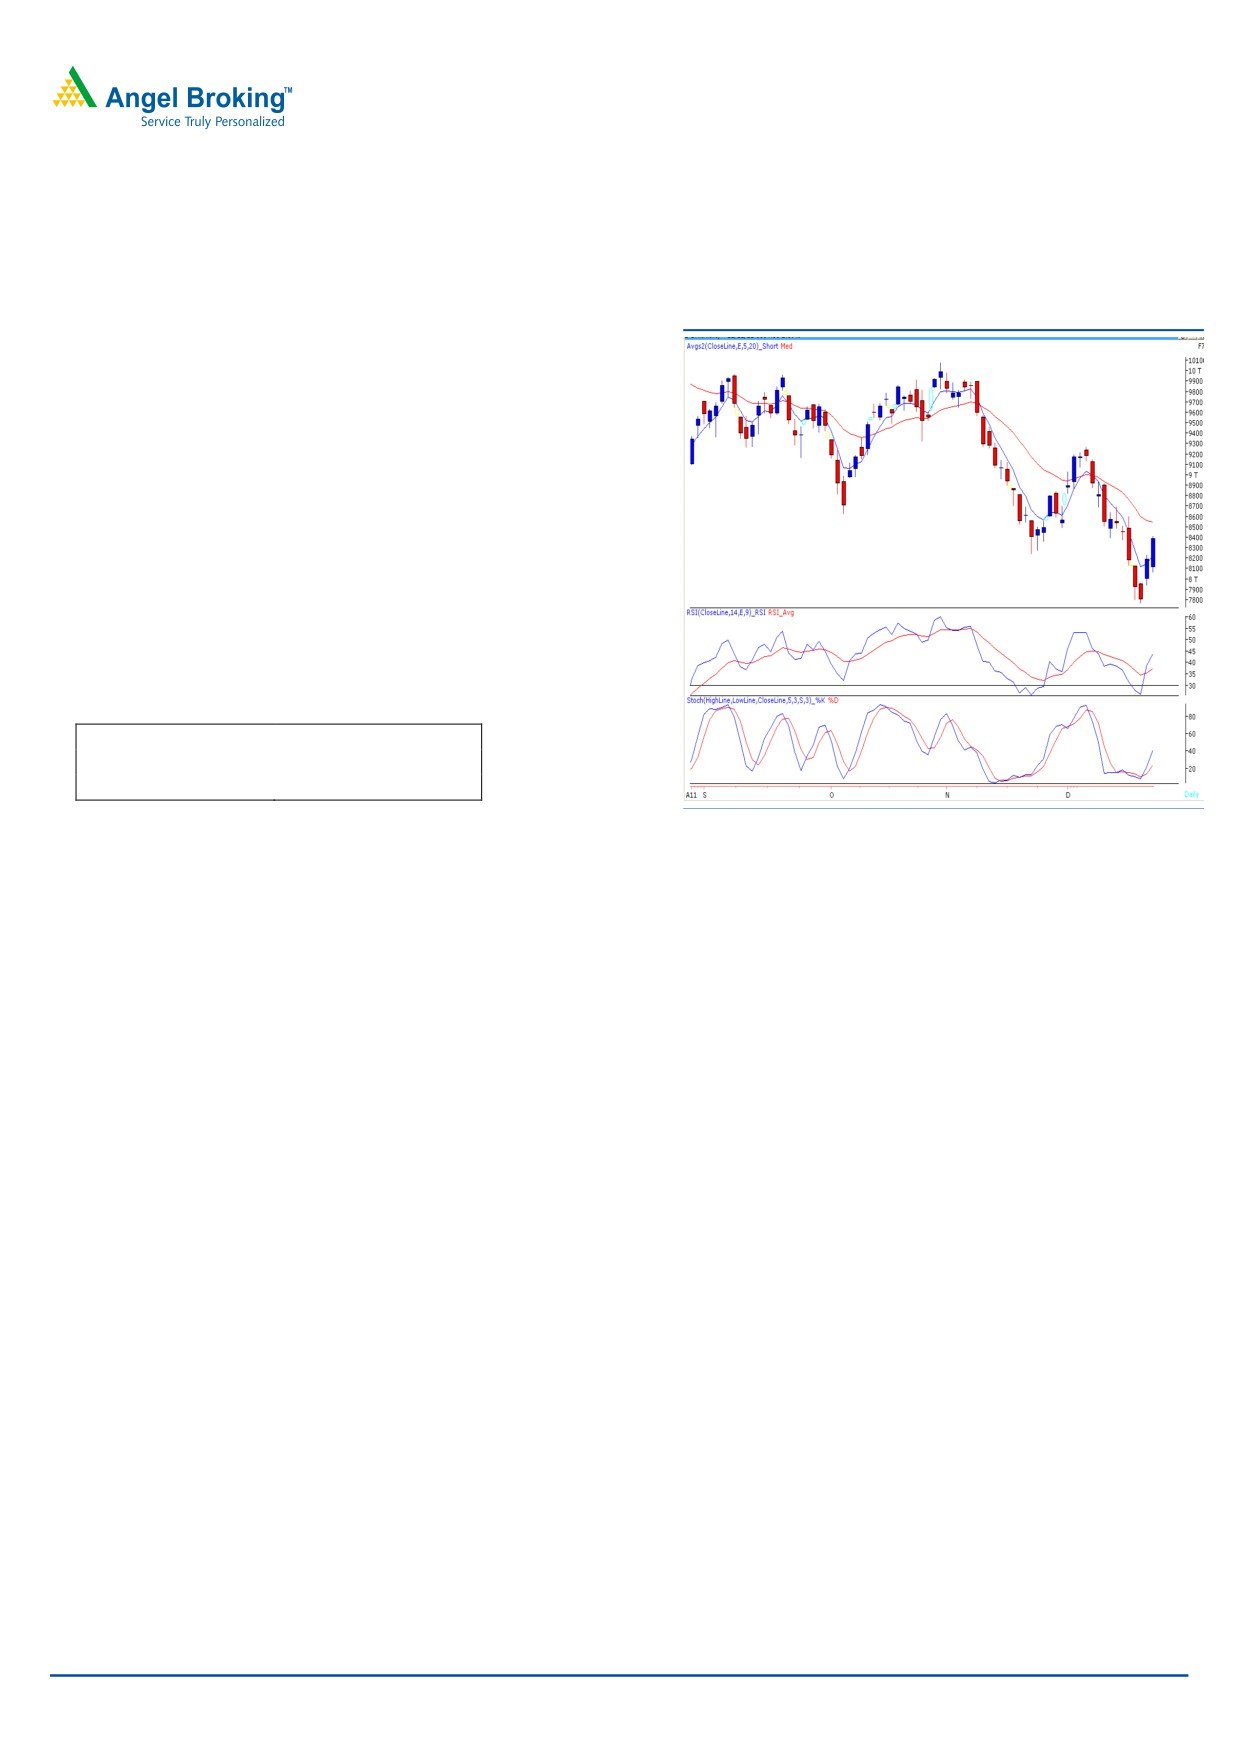
Bank Nifty Outlook - (8385)
Exhibit 2: Bank Nifty Daily Chart
Yesterday, bank nifty opened on a flat note and gained
strength as the day progressed to close near the high point
of the day. As mentioned in our previous report, the positive
crossover of “Stochastic and RSI” momentum oscillator on
the daily chart is still intact. Therefore, if Bank Nifty manages
to sustain above yesterday’s high of 8416 then it is likely to
test 8520 - 8580 levels. These levels are near to the 50%
Fibonacci retracement of the fall from 9273 - 7766 and “20
SMA”. Thus, we may witness some consolidation near to
8520 -8580 levels. On the downside, 8072 - 8000 level is
likely to act as support in coming trading session.
Actionable points:
View
Neutral
Resistance Level
8520 - 8580
Support Level
8072 - 8000
Source: Falcon
For Private Circulation Only |
2
Technical Research | December 23, 2011
Positive Bias:
Expected
Stock Name
CMP
5 Day EMA
20 Day EMA
Remarks
Target
Tata Steel
353.9
357
381.1
367
View will change below 341
DLF
197.65
193.9
203.6
207
View will change below 188
Negative Bias:
Expected
Stock Name
CMP
5 Day EMA
20 Day EMA
Remarks
Target
Mphasis
313.30
326.1
326.7
296
View will change above 330
Sun Pharma
496.15
502.7
508.4
486
View will change above 507
For Private Circulation Only |
3
Technical Research | December 23, 2011
Daily Pivot Levels for Nifty 50 Stocks
SCRIPS
S2
S1
PIVOT
R1
R2
SENSEX
15,345
15,579
15,707
15,941
16,069
NIFTY
4,595
4,664
4,702
4,772
4,810
BANKNIFTY
7,937
8,161
8,288
8,512
8,640
ACC
1,111
1,126
1,140
1,156
1,170
AMBUJACEM
152
154
156
158
160
AXISBANK
826
850
864
888
902
BAJAJ-AUTO
1,567
1,589
1,605
1,627
1,642
BHARTIARTL
315
325
334
344
352
BHEL
228
232
236
240
243
BPCL
502
512
519
529
536
CAIRN
312
314
317
319
322
CIPLA
326
330
333
337
341
DLF
181
189
194
203
208
DRREDDY
1,530
1,551
1,567
1,589
1,605
GAIL
380
387
392
399
404
HCLTECH
375
382
387
393
398
HDFC
638
650
658
670
677
HDFCBANK
423
433
439
449
455
HEROMOTOCO
1,788
1,819
1,845
1,876
1,902
HINDALCO
118
120
122
124
126
HINDUNILVR
393
401
407
414
420
ICICIBANK
660
694
718
752
775
IDFC
93
97
100
104
107
INFY
2,608
2,665
2,706
2,763
2,804
ITC
199
202
203
205
206
JINDALSTEL
462
476
485
499
509
JPASSOCIAT
50
53
54
56
58
KOTAKBANK
446
454
461
469
476
LT
961
983
1,000
1,022
1,039
M&M
663
678
687
702
711
MARUTI
924
945
962
983
1,000
NTPC
157
160
162
165
168
ONGC
253
259
262
268
271
PNB
770
796
811
837
852
POWERGRID
96
98
100
102
103
RANBAXY
387
403
414
430
442
RCOM
63
66
68
70
72
RELCAPITAL
224
236
244
255
263
RELIANCE
722
738
749
766
777
RELINFRA
336
348
356
368
376
RPOWER
70
72
73
75
76
SAIL
76
78
79
81
82
SBIN
1,555
1,613
1,646
1,704
1,737
SESAGOA
153
156
159
162
165
SIEMENS
629
639
651
662
674
STER
88
90
91
93
95
SUNPHARMA
491
494
497
499
502
SUZLON
17
18
18
19
20
TATAMOTORS
170
177
181
188
191
TATAPOWER
84
86
88
91
92
TATASTEEL
336
345
351
360
366
TCS
1,120
1,136
1,150
1,166
1,180
WIPRO
388
393
398
403
408
Technical Research Team
For Private Circulation Only |
4
Technical Report
RESEARCH TEAM
Shardul Kulkarni
Head - Technicals
Sameet Chavan
Technical Analyst
Sacchitanand Uttekar
Technical Analyst
Mehul Kothari
Technical Analyst
Ankur Lakhotia
Technical Analyst
Research Team: 022-3952 6600
DISCLAIMER: This document is not for public distribution and has been furnished to you solely for your information and must not
be reproduced or redistributed to any other person. Persons into whose possession this document may come are required to observe
these restrictions.
Opinion expressed is our current opinion as of the date appearing on this material only. While we endeavor to update on a
reasonable basis the information discussed in this material, there may be regulatory, compliance, or other reasons that prevent us
from doing so. Prospective investors and others are cautioned that any forward-looking statements are not predictions and may be
subject to change without notice. Our proprietary trading and investment businesses may make investment decisions that are
inconsistent with the recommendations expressed herein.
The information in this document has been printed on the basis of publicly available information, internal data and other reliable
sources believed to be true and are for general guidance only. While every effort is made to ensure the accuracy and completeness of
information contained, the company takes no guarantee and assumes no liability for any errors or omissions of the information. No
one can use the information as the basis for any claim, demand or cause of action.
Recipients of this material should rely on their own investigations and take their own professional advice. Each recipient of this
document should make such investigations as it deems necessary to arrive at an independent evaluation of an investment in the
securities of companies referred to in this document (including the merits and risks involved), and should consult their own advisors to
determine the merits and risks of such an investment. Price and value of the investments referred to in this material may go up or
down. Past performance is not a guide for future performance. Certain transactions - futures, options and other derivatives as well as
non-investment grade securities - involve substantial risks and are not suitable for all investors. Reports based on technical analysis
centers on studying charts of a stock's price movement and trading volume, as opposed to focusing on a company's fundamentals
and as such, may not match with a report on a company's fundamentals.
We do not undertake to advise you as to any change of our views expressed in this document. While we would endeavor to update
the information herein on a reasonable basis, Angel Broking, its subsidiaries and associated companies, their directors and
employees are under no obligation to update or keep the information current. Also there may be regulatory, compliance, or other
reasons that may prevent Angel Broking and affiliates from doing so. Prospective investors and others are cautioned that any
forward-looking statements are not predictions and may be subject to change without notice.
Angel Broking Limited and affiliates, including the analyst who has issued this report, may, on the date of this report, and from time
to time, have long or short positions in, and buy or sell the securities of the companies mentioned herein or engage in any other
transaction involving such securities and earn brokerage or compensation or act as advisor or have other potential conflict of interest
with respect to company/ies mentioned herein or inconsistent with any recommendation and related information and opinions.
Angel Broking Limited and affiliates may seek to provide or have engaged in providing corporate finance, investment banking or
other advisory services in a merger or specific transaction to the companies referred to in this report, as on the date of this report or
in the past.
Sebi Registration No : INB 010996539
For Private Circulation Only |