Daily Technical Report
August 22, 2012
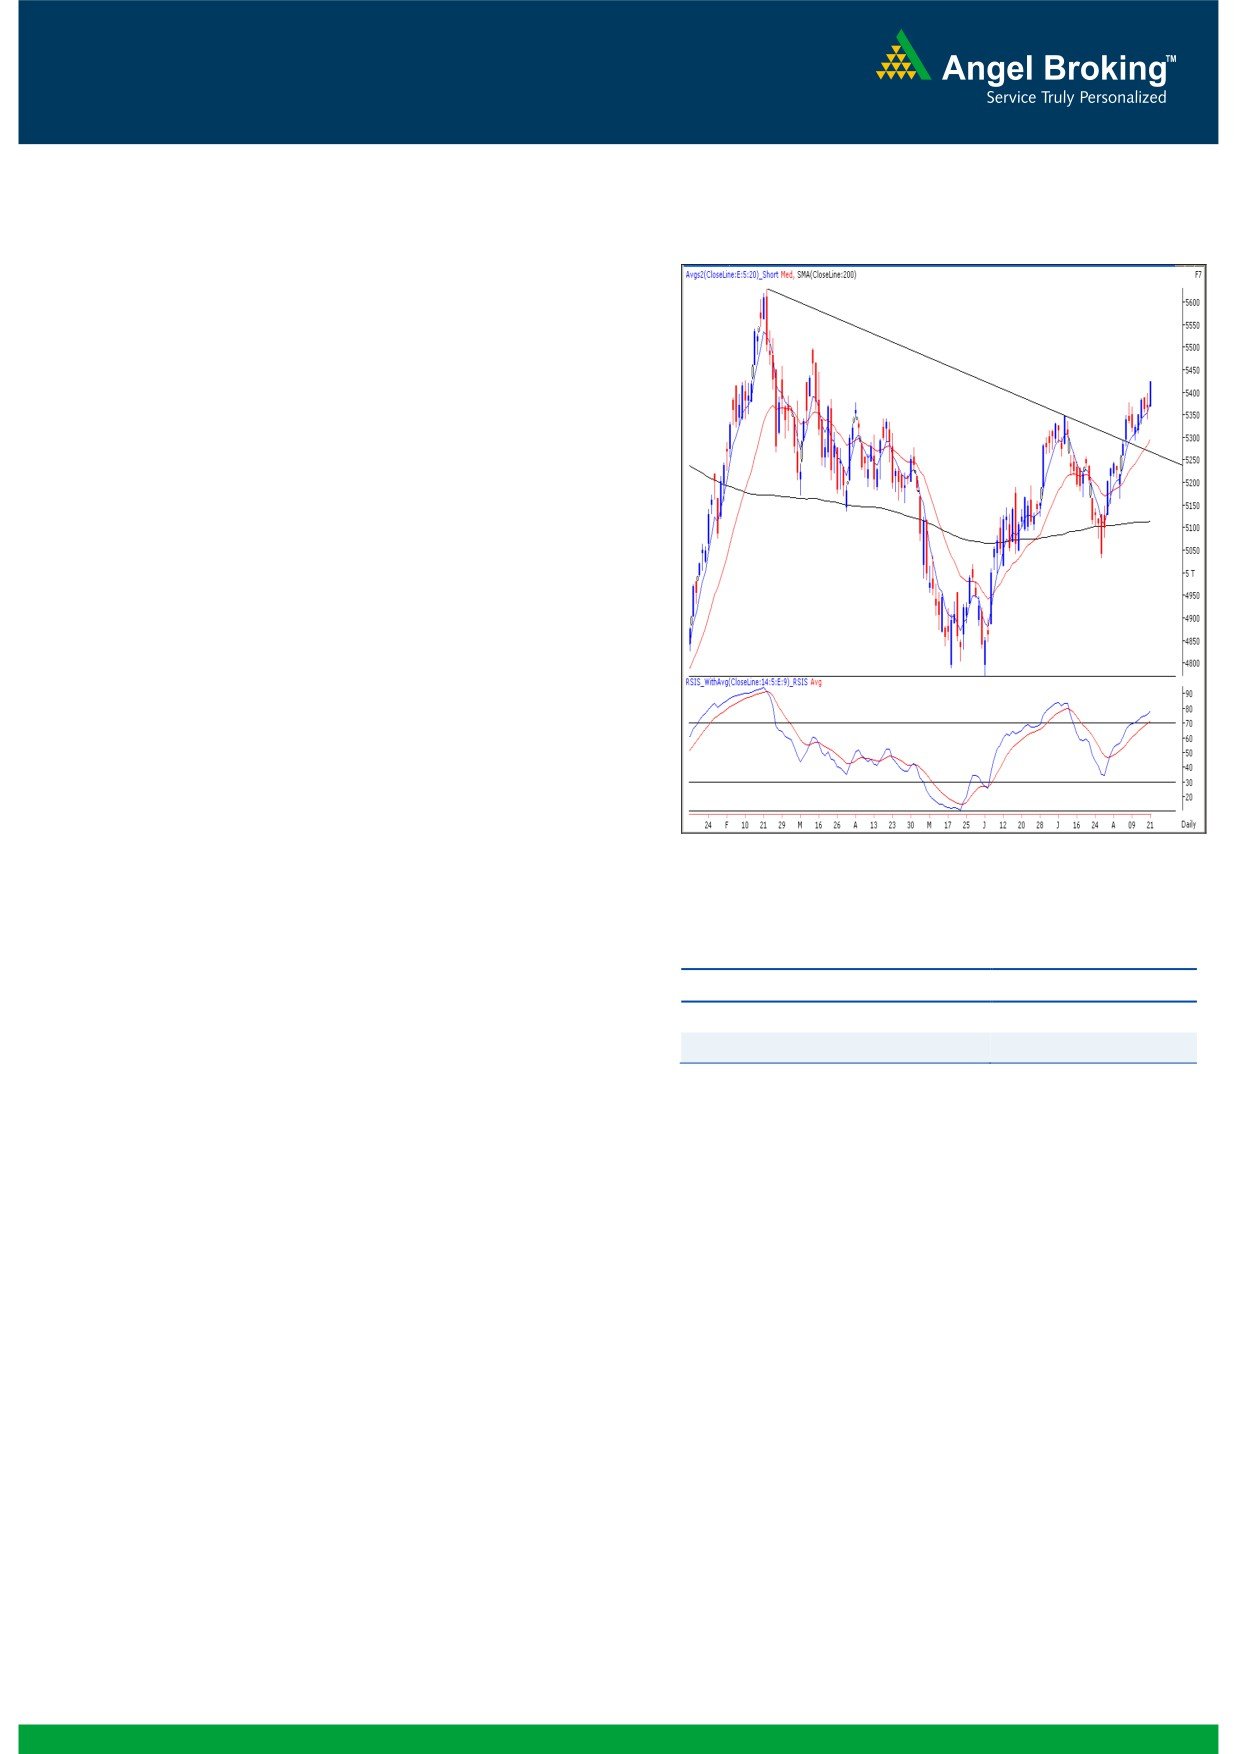
Exhibit 1: Nifty Daily Chart
Sensex (17885) / NIFTY (5421)
The weak began on a flat note in line with globe clues
but strong buying in the final hour of trade resulted in
a close well above 5400 mark for the first time after
March 14, 2012. On sectoral front, IT, Power, TECK
and Realty counters contributed heavily during
yesterday’s session; whereas only Health Care sector
ended with nominal loss. The advance to decline ratio
was in favor of advancing counters (A=1498
Formation
On the weekly chart, the indices have precisely
closed at the “Downward Sloping Trend Line”
resistance near 17802 / 5391 formed by joining
the highs of 21109 / 6339 (November 5, 2010)
- 18524 / 5630 (February 24, 2012).
The ’20-day EMA’ and the ’200-day SMA’ are
placed at 17400 / 5296 and 16900 / 5113
levels, respectively.
Source: Falcon
A weekly closing above 17727 / 5386 level
would confirm a ‘Higher Top - Higher Bottom’
Actionable points:
formation on the weekly chart after August 28,
2009.
View
Bullish Above 5425
Expected Targets
5450 - 5500
Support Levels
5342
Trading strategy:
Finally, we have witnessed the much awaited
breakout above the psychological level of 5400 and a
closing above 17727 / 5386. As expected, significant
gush of liquidity was seen beyond the 5400 mark.
Hence, indices surged during the last hour of the
session and registered a high of 17899 / 5425.Going
forward, we advise traders to remain long on the
market and trade with a positive bias. Indices are now
likely to rally further and may test mentioned levels of
17950 - 18050 / 5450 - 5500 once they sustain
above yesterday's high of 17899 / 5425. On the
downside, Friday's low of
17622 /
5342 would
provide a decent support in coming trading session.
1
Daily Technical Report
August 22, 2012
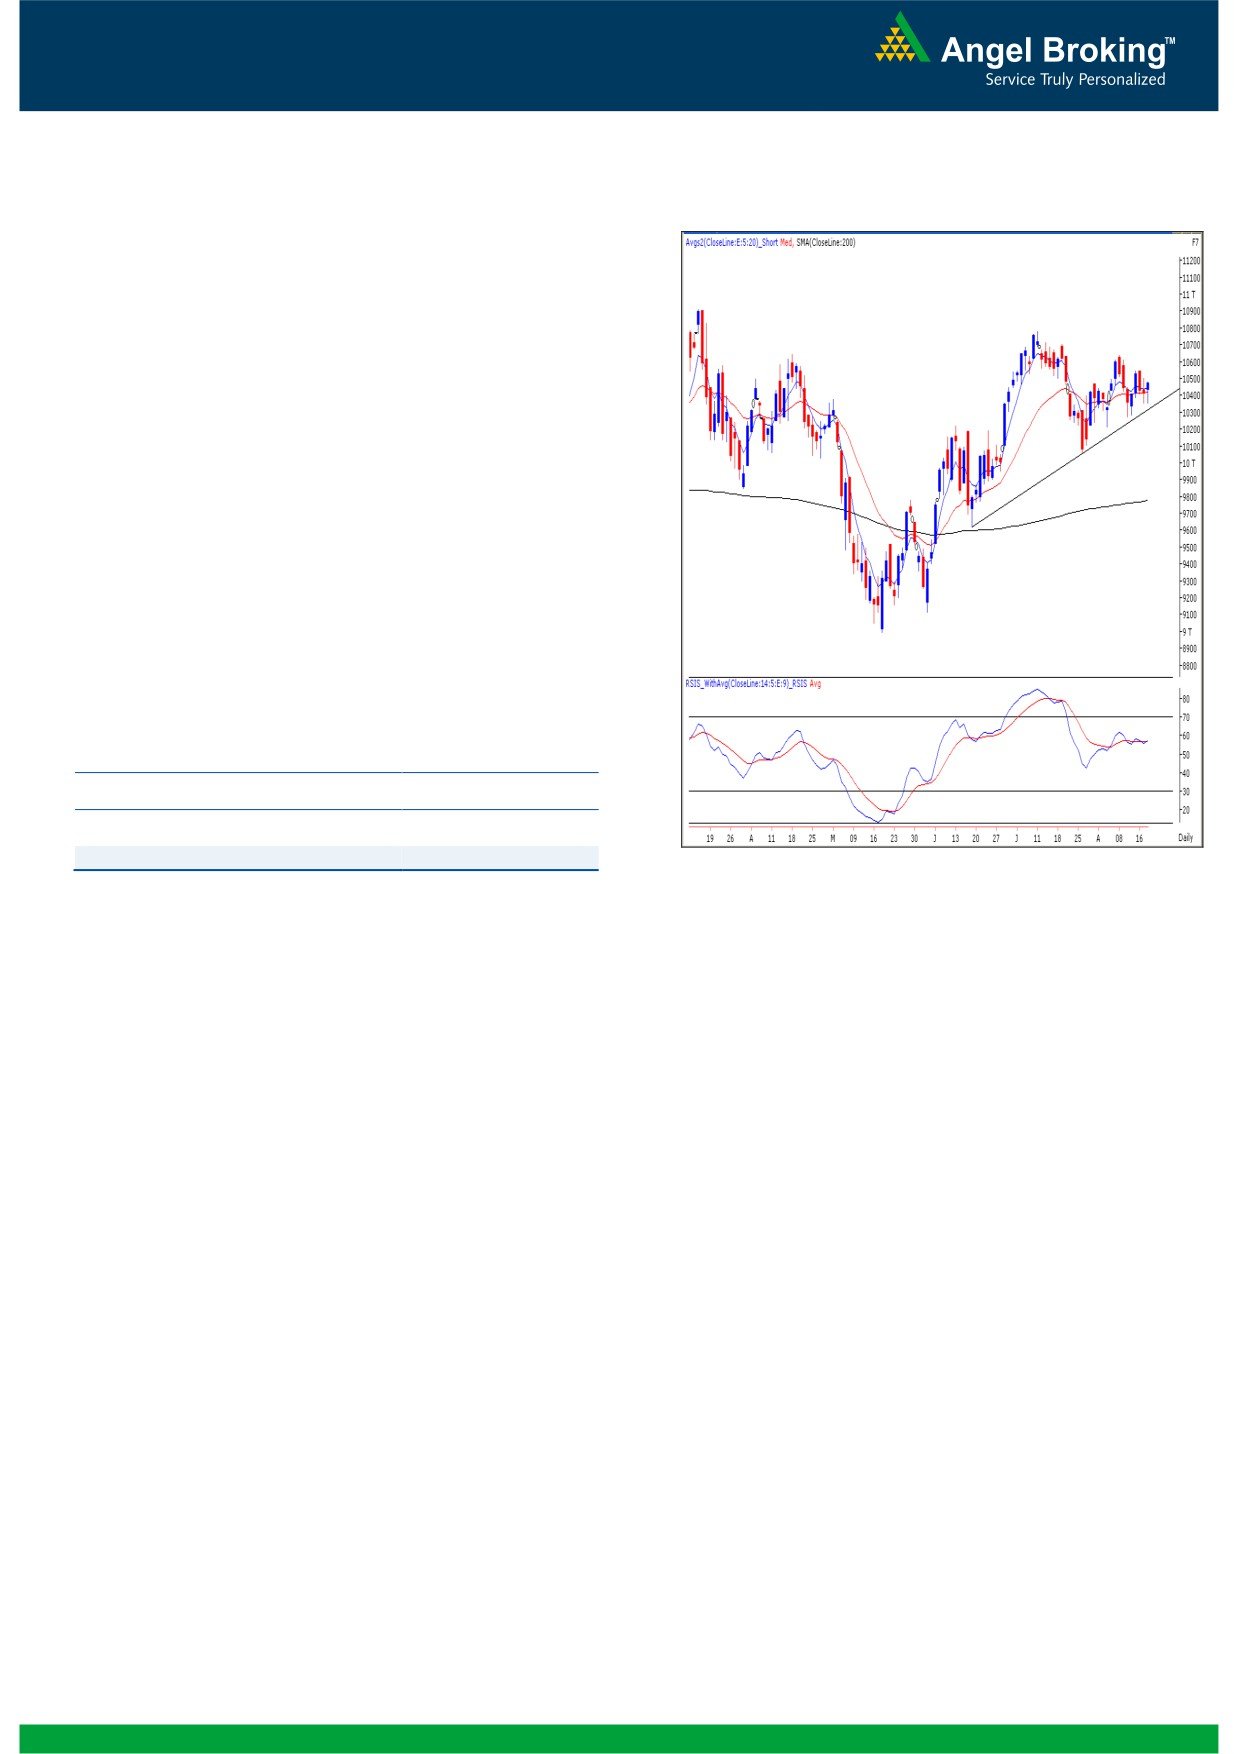
Exhibit 2: Bank Nifty Daily Chart
Bank Nifty Outlook - (10470)
Yesterday, Bank Nifty opened on a flat note and
traded in a narrow range throughout the session.
However, during the last hour of trade we witnessed
buying interest in the index which led to a close near
day’s high. We are now witnessing a “Tweezer
Bottom” candlestick near the upward sloping trend
line formed by joining the lows of June 19, 2012 -
July 26, 2012. The above mentioned candlestick will
have its bullish implication as long as the index stays
above the 10354 level. In this scenario, if the index
sustains above yesterday’s high of 10485 then it is
likely to rally towards 10614 - 10641 levels. On the
downside, the 10354 mark will act as an important
support level for the index in coming trading session.
Actionable points:
View
Bullish Above 10485
Expected Targets
10614 - 10641
Support Levels
10354
Source: Falcon
2
Daily Technical Report
August 22, 2012
Research Team Tel: 022 - 39357800
DISCLAIMER
This document is solely for the personal information of the recipient, and must not be singularly used as the basis of any investment
decision. Nothing in this document should be construed as investment or financial advice. Each recipient of this document should make
such investigations as they deem necessary to arrive at an independent evaluation of an investment in the securities of the companies
referred to in this document (including the merits and risks involved), and should consult their own advisors to determine the merits and
risks of such an investment.
Angel Broking Limited, its affiliates, directors, its proprietary trading and investment businesses may, from time to time, make
investment decisions that are inconsistent with or contradictory to the recommendations expressed herein. The views contained in this
document are those of the analyst, and the company may or may not subscribe to all the views expressed within.
Reports based on technical and derivative analysis center on studying charts of a stock's price movement, outstanding positions and
trading volume, as opposed to focusing on a company's fundamentals and, as such, may not match with a report on a company's
fundamentals.
The information in this document has been printed on the basis of publicly available information, internal data and other reliable
sources believed to be true, but we do not represent that it is accurate or complete and it should not be relied on as such, as this
document is for general guidance only. Angel Broking Limited or any of its affiliates/ group companies shall not be in any way
responsible for any loss or damage that may arise to any person from any inadvertent error in the information contained in this report.
Angel Broking Limited has not independently verified all the information contained within this document. Accordingly, we cannot testify,
nor make any representation or warranty, express or implied, to the accuracy, contents or data contained within this document. While
Angel Broking Limited endeavours to update on a reasonable basis the information discussed in this material, there may be regulatory,
compliance, or other reasons that prevent us from doing so.
This document is being supplied to you solely for your information, and its contents, information or data may not be reproduced,
redistributed or passed on, directly or indirectly.
Angel Broking Limited and its affiliates may seek to provide or have engaged in providing corporate finance, investment banking or
other advisory services in a merger or specific transaction to the companies referred to in this report, as on the date of this report or in
the past.
Neither Angel Broking Limited, nor its directors, employees or affiliates shall be liable for any loss or damage that may arise from or in
connection with the use of this information.
Note: Please refer to the important `Stock Holding Disclosure' report on the Angel website (Research Section). Also, please refer to the
latest update on respective stocks for the disclosure status in respect of those stocks. Angel Broking Limited and its affiliates may have
investment positions in the stocks recommended in this report.
Research Team
Shardul Kulkarni
-
Head - Technicals
Sameet Chavan
-
Technical Analyst
Sacchitanand Uttekar
-
Technical Analyst
Mehul Kothari
-
Technical Analyst
Ankur Lakhotia
-
Technical Analyst
Angel Broking Pvt. Ltd.
Registered Office: G-1, Ackruti Trade Centre, Rd. No. 7, MIDC, Andheri (E), Mumbai - 400 093.
Corporate Office: 6th Floor, Ackruti Star, MIDC, Andheri (E), Mumbai - 400 093. Tel: (022) 3952 6600
Sebi Registration No: INB 010996539
4