Daily Technical Report
June 22, 2012
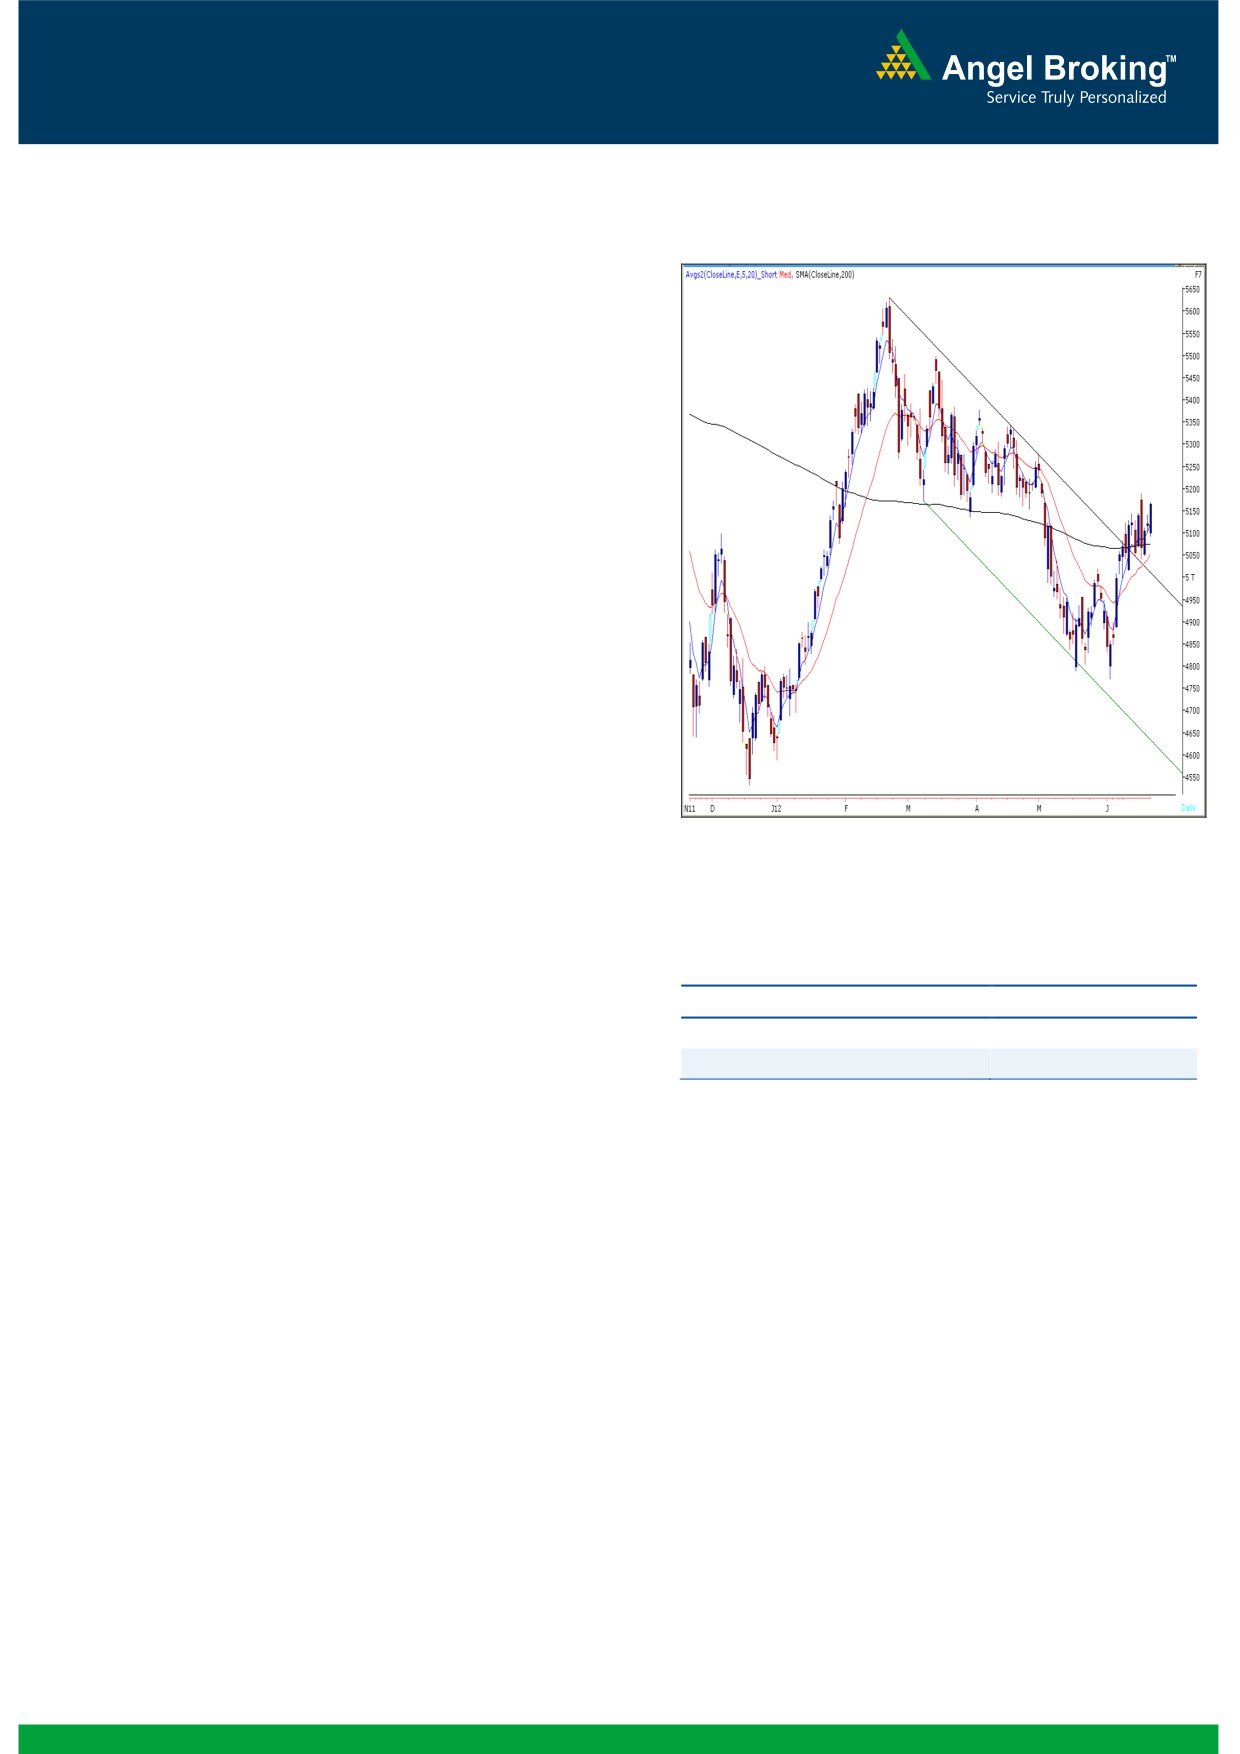
Exhibit 1: Nifty Daily Chart
Sensex (17033) / NIFTY (5165)
Yesterday, for the third consecutive session indices
opened on a flat note and traded in a narrow range
in the first half. However, strong buying during the
second half pushed indices significantly higher to
close at the highest point of the day. On sectoral
front, Realty, Capital Goods and Banking counters
rallied sharply during yesterday’s sessions; whereas
Oil & Gas and IT sectors ended on a losing side. The
advance to decline ratio was strongly in favor of
advancing counters (A=1658 D=1079) (Source -
Formation
The 200-day SMA (Simple Moving Average) and
20-day EMA (Exponential Moving Average) have
now shifted to 16800 / 5070 and 16550 /
5019, respectively.
The ‘20-Week EMA’ is placed at 16830 / 5100
level.
Source: Falcon
On the daily chart, indices are trading near the
upper range of ‘Downward Sloping Channel’
Actionable points:
drawn by joining two highs of February 22,
2012 - April 19, 2012 and low of March 7,
2012.
View
Bullish above 5190
Expected target
5270
The positive crossover in weekly ‘RSI’ momentum
Support Levels
5093 - 5146
oscillator is still intact. Also, the weekly ‘3 & 8
EMA’ is signaling a positive crossover.
Trading strategy:
Yesterday after a quite opening, substantial buying by
market participants led the indices to close on a
strong footing. Going forward, we continue to
maintain that the
17110
/
5190 level is an
intermediate resistance level for the market. Once
indices manage to sustain above this level then we
may witness a continuation of the prior uptrend. In
this scenario, indices are likely to move upwards to
test 17400 / 5270 level which is the target of the
'Channel' pattern mentioned above. Conversely, the
support is seen at 16968 - 16799 / 5146 - 5093
levels. Albeit we may witness a gap down opening in
today's session, we are of the opinion that positional
traders with a 2 to 3 week time frame should use this
fall to accumulate long positions.
1
Daily Technical Report
June 22, 2012
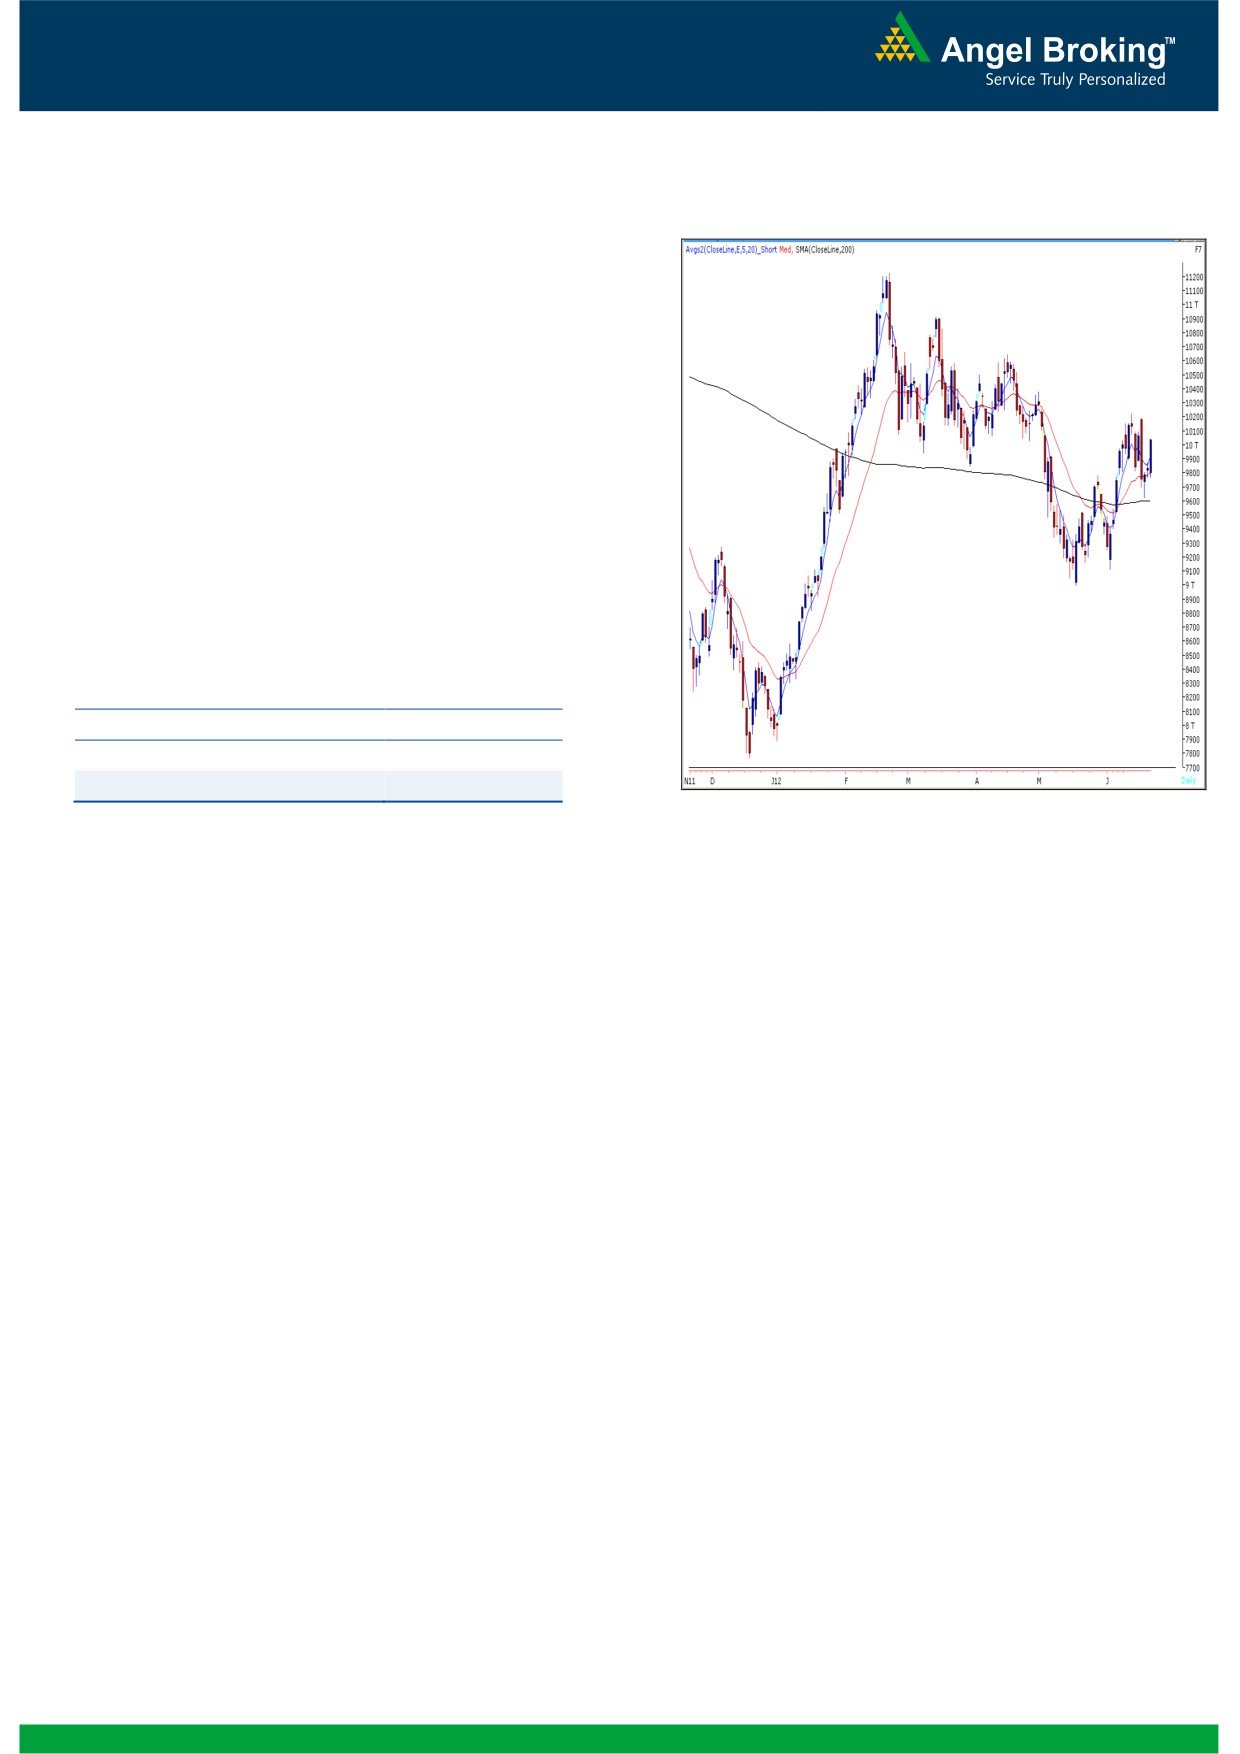
Exhibit 2: Bank Nifty Daily Chart
Bank Nifty Outlook - (10034)
Yesterday, Bank Nifty opened on a flat note and
traded in a narrow range during first half of the
session. However, in line with the broader market,
momentum picked up during the second half which
led the index to close near the highest point of the
day. Considering the bigger picture, we reiterate our
view that index is likely to trade in a broad range of
10225
-
9595. Positional traders holding long
positions should hold with a trailing stop loss of 9764
(spot level) on closing basis. Within the mentioned
range intermediate resistance levels are seen at
10100 - 10180 and support levels are near to 9764
- 9661 mark.
Actionable points:
View
Neutral
Resistance Levels
10100 - 10180
Support Levels
9764 - 9661
Source: Falcon
2
Daily Technical Report
June 22, 2012
Research Team Tel: 022 - 39357800
DISCLAIMER
This document is solely for the personal information of the recipient, and must not be singularly used as the basis of any investment
decision. Nothing in this document should be construed as investment or financial advice. Each recipient of this document should make
such investigations as they deem necessary to arrive at an independent evaluation of an investment in the securities of the companies
referred to in this document (including the merits and risks involved), and should consult their own advisors to determine the merits and
risks of such an investment.
Angel Broking Limited, its affiliates, directors, its proprietary trading and investment businesses may, from time to time, make
investment decisions that are inconsistent with or contradictory to the recommendations expressed herein. The views contained in this
document are those of the analyst, and the company may or may not subscribe to all the views expressed within.
Reports based on technical and derivative analysis center on studying charts of a stock's price movement, outstanding positions and
trading volume, as opposed to focusing on a company's fundamentals and, as such, may not match with a report on a company's
fundamentals.
The information in this document has been printed on the basis of publicly available information, internal data and other reliable
sources believed to be true, but we do not represent that it is accurate or complete and it should not be relied on as such, as this
document is for general guidance only. Angel Broking Limited or any of its affiliates/ group companies shall not be in any way
responsible for any loss or damage that may arise to any person from any inadvertent error in the information contained in this report.
Angel Broking Limited has not independently verified all the information contained within this document. Accordingly, we cannot testify,
nor make any representation or warranty, express or implied, to the accuracy, contents or data contained within this document. While
Angel Broking Limited endeavours to update on a reasonable basis the information discussed in this material, there may be regulatory,
compliance, or other reasons that prevent us from doing so.
This document is being supplied to you solely for your information, and its contents, information or data may not be reproduced,
redistributed or passed on, directly or indirectly.
Angel Broking Limited and its affiliates may seek to provide or have engaged in providing corporate finance, investment banking or
other advisory services in a merger or specific transaction to the companies referred to in this report, as on the date of this report or in
the past.
Neither Angel Broking Limited, nor its directors, employees or affiliates shall be liable for any loss or damage that may arise from or in
connection with the use of this information.
Note: Please refer to the important `Stock Holding Disclosure' report on the Angel website (Research Section). Also, please refer to the
latest update on respective stocks for the disclosure status in respect of those stocks. Angel Broking Limited and its affiliates may have
investment positions in the stocks recommended in this report.
Research Team
Shardul Kulkarni
-
Head - Technicals
Sameet Chavan
-
Technical Analyst
Sacchitanand Uttekar
-
Technical Analyst
Mehul Kothari
-
Technical Analyst
Ankur Lakhotia
-
Technical Analyst
Angel Broking Pvt. Ltd.
Registered Office: G-1, Ackruti Trade Centre, Rd. No. 7, MIDC, Andheri (E), Mumbai - 400 093.
Corporate Office: 6th Floor, Ackruti Star, MIDC, Andheri (E), Mumbai - 400 093. Tel: (022) 3952 6600
Sebi Registration No: INB 010996539
4