Daily Technical Report
May 22, 2012
Sensex (16183) / NIFTY (4906)
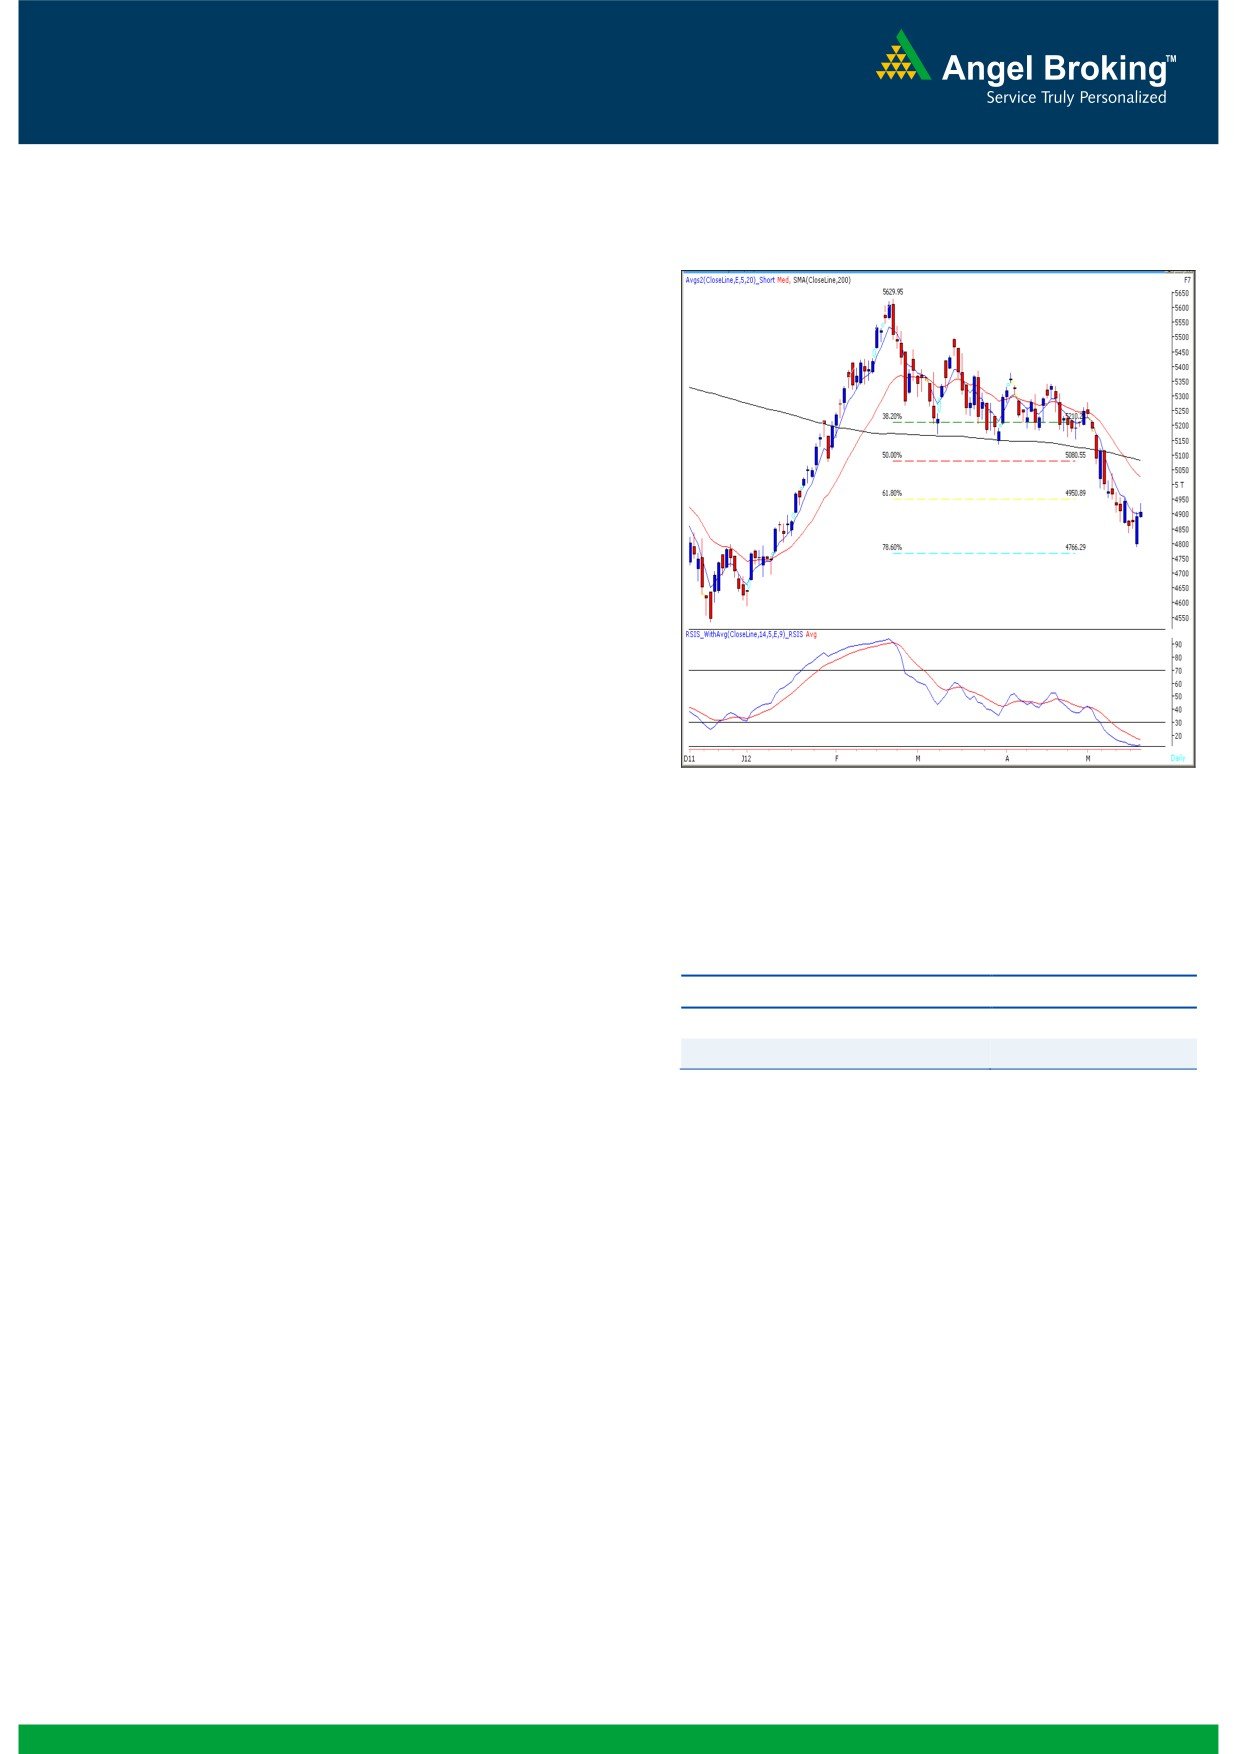
Exhibit 1: Nifty Daily Chart
Yesterday, our benchmark indices opened on a flat
note in-line with global cues. Consequently, indices
gained positive momentum during the first half but
pared their early gains to close marginally above
4900 mark. On sectoral front, Consumer Goods,
Realty and Power counters were among the major
gainers whereas Teck, FMCG and IT counters ended
on the losing side. The advance to decline ratio was
strongly in favor of advancing counters (A=1643
Formation
The 200-day SMA (Simple Moving Average) and
20-day EMA (Exponential Moving Average) have
now shifted to 16860 / 5085 and 16630 /
5037, respectively.
The ‘20-Week EMA’ is placed at 17000 / 5150
Source: Falcon
level.
Indices have now tested the 15860 / 4766 level,
which is the 78.6% Fibonacci Retracement level
of the rise from
15135
/
4531 (Low on
December 23, 2011) to 18524 / 5630 (High on
Actionable points:
February 22, 2012).
View
Neutral
The daily ‘RSI - Smoothened’ oscillator is placed
Resistance Levels
4938 - 4957
well inside the oversold territory.
Support Levels
4881 - 4863
The candlestick pattern on the weekly chart
represents a bullish “Hammer”.
Conversely, Friday’s low of 15809 / 4789 is likely to
act as a decent support in coming trading sessions. A
Trading strategy:
violation of this level would clearly increase the
chances of a further fall and as a result indices may
The week began on a quiet note after a strong
slide towards 15678 / 4695 level.
intraday rally on Friday's session. As expected, indices
moved higher during the initial hour of the session but
lost gains on the account of rupee depreciation.
Looking at the daily momentum oscillators, we
reiterate our view that indices are likely to rally further
if they sustain above last week's high of 16391 /
4957. In this scenario, indices may test 16700 -
16840 / 5050 - 5090 levels.
1
Daily Technical Report
May 22, 2012
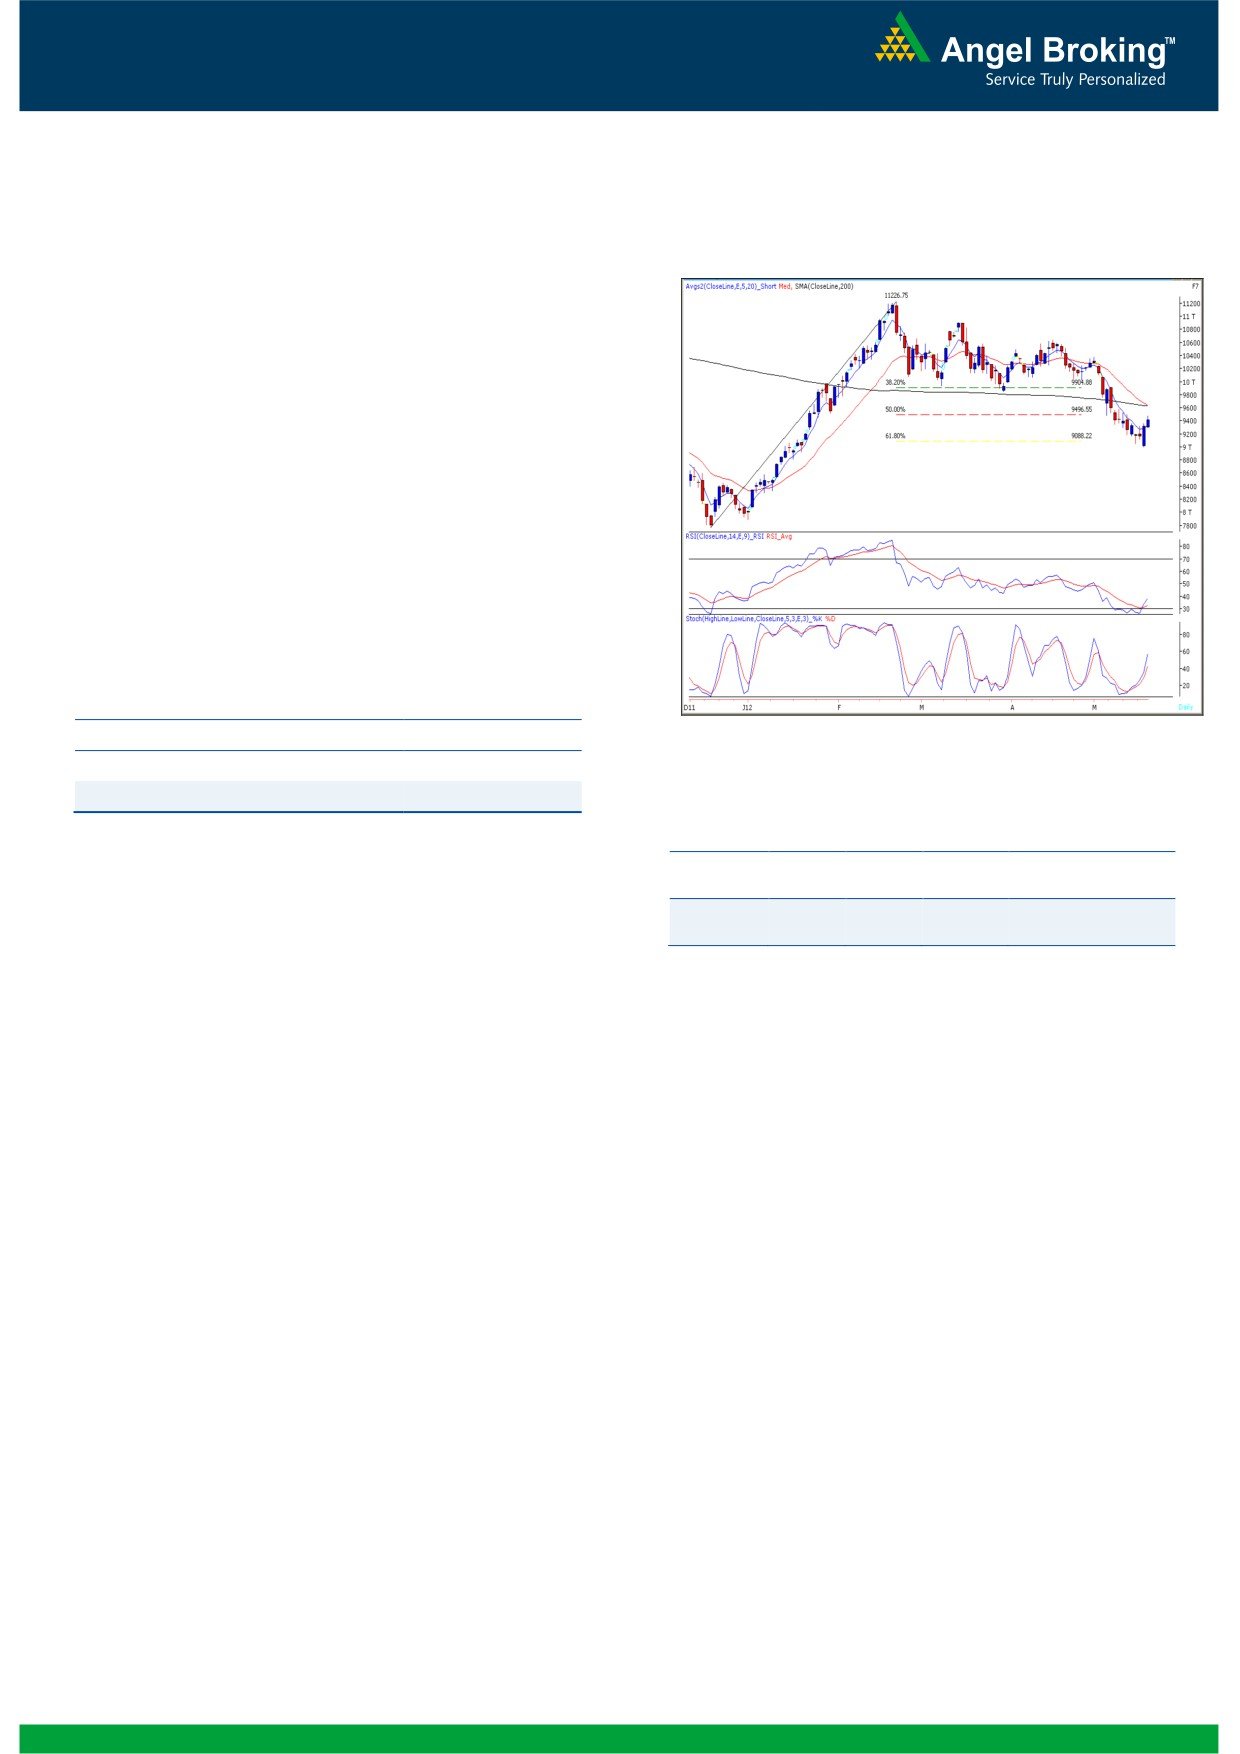
Bank Nifty Outlook - (9412)
Yesterday, Bank Nifty opened on an optimistic note in
Exhibit 2: Bank Nifty Daily Chart
line with our benchmark indices and traded in a
narrow range throughout the session. The positive
crossover in “Stochastic” and “RSI” momentum
oscillator on the daily chart mentioned in our previous
report is still intact. However on the hourly chart we
are witnessing narrow range body formations which
suggest probability of consolidation or a minor
pullback after the initial gap up opening expected
today. In addition the momentum oscillators on the
hourly chart are placed in overbought conditions.
Thus, going forward 9480 - 9533 are likely to act as
resistance and on the downside 9299 - 9227 are
likely to act as support in coming trading session.
Actionable points:
View
Neutral
Source: Falcon
Resistance Levels
9480 - 9533
Support Levels
9323 - 9227
Positive Bias:
Stock
Positive Expected
CMP
Remarks
Name
Above
Target
View will be
RELINFRA
454
461
485
negated below 449
2
Daily Technical Report
May 22, 2012
Research Team Tel: 022 - 39357800
DISCLAIMER
This document is solely for the personal information of the recipient, and must not be singularly used as the basis of any investment
decision. Nothing in this document should be construed as investment or financial advice. Each recipient of this document should make
such investigations as they deem necessary to arrive at an independent evaluation of an investment in the securities of the companies
referred to in this document (including the merits and risks involved), and should consult their own advisors to determine the merits and
risks of such an investment.
Angel Broking Limited, its affiliates, directors, its proprietary trading and investment businesses may, from time to time, make
investment decisions that are inconsistent with or contradictory to the recommendations expressed herein. The views contained in this
document are those of the analyst, and the company may or may not subscribe to all the views expressed within.
Reports based on technical and derivative analysis center on studying charts of a stock's price movement, outstanding positions and
trading volume, as opposed to focusing on a company's fundamentals and, as such, may not match with a report on a company's
fundamentals.
The information in this document has been printed on the basis of publicly available information, internal data and other reliable
sources believed to be true, but we do not represent that it is accurate or complete and it should not be relied on as such, as this
document is for general guidance only. Angel Broking Limited or any of its affiliates/ group companies shall not be in any way
responsible for any loss or damage that may arise to any person from any inadvertent error in the information contained in this report.
Angel Broking Limited has not independently verified all the information contained within this document. Accordingly, we cannot testify,
nor make any representation or warranty, express or implied, to the accuracy, contents or data contained within this document. While
Angel Broking Limited endeavours to update on a reasonable basis the information discussed in this material, there may be regulatory,
compliance, or other reasons that prevent us from doing so.
This document is being supplied to you solely for your information, and its contents, information or data may not be reproduced,
redistributed or passed on, directly or indirectly.
Angel Broking Limited and its affiliates may seek to provide or have engaged in providing corporate finance, investment banking or
other advisory services in a merger or specific transaction to the companies referred to in this report, as on the date of this report or in
the past.
Neither Angel Broking Limited, nor its directors, employees or affiliates shall be liable for any loss or damage that may arise from or in
connection with the use of this information.
Note: Please refer to the important `Stock Holding Disclosure' report on the Angel website (Research Section). Also, please refer to the
latest update on respective stocks for the disclosure status in respect of those stocks. Angel Broking Limited and its affiliates may have
investment positions in the stocks recommended in this report.
Research Team
Shardul Kulkarni
-
Head - Technicals
Sameet Chavan
-
Technical Analyst
Sacchitanand Uttekar
-
Technical Analyst
Mehul Kothari
-
Technical Analyst
Ankur Lakhotia
-
Technical Analyst
Angel Broking Pvt. Ltd.
Registered Office: G-1, Ackruti Trade Centre, Rd. No. 7, MIDC, Andheri (E), Mumbai - 400 093.
Corporate Office: 6th Floor, Ackruti Star, MIDC, Andheri (E), Mumbai - 400 093. Tel: (022) 3952 6600
Sebi Registration No: INB 010996539
4