Technical Research | March 22, 2012
Daily Technical Report
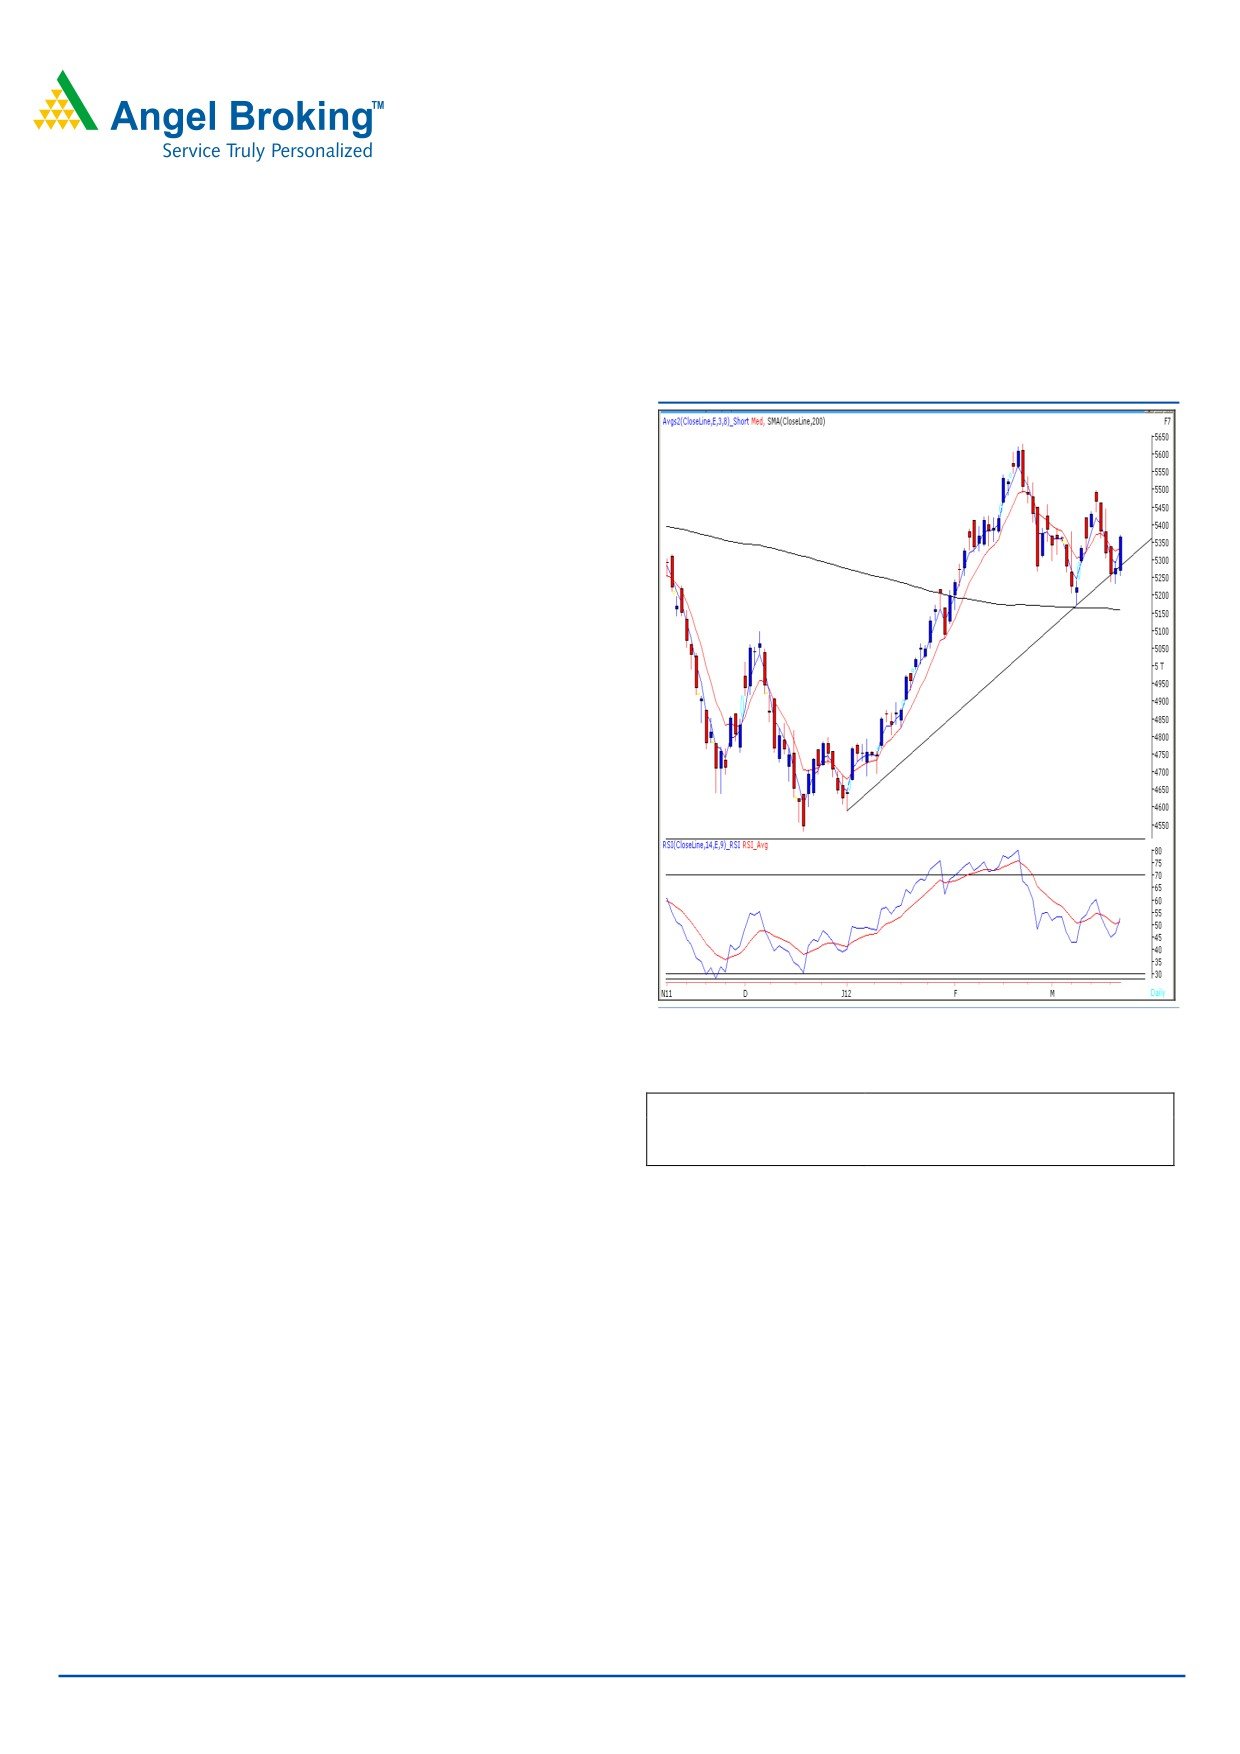
Sensex (17602) / NIFTY (5365)
Exhibit 1: Nifty Daily Chart
Yesterday, yet again we witnessed a flat opening in-line with
global cues. However, strong buying emerged near
mentioned support levels and indices finally closed at the
highest point of the day. On the sectoral front, Capital
Goods, Realty, Banking and Power sectors contributed
heavily in yesterday’s rally. There was no sector on the
losing side. The advance to decline ratio was strongly in
favor of advancing counters. (A=1757 D=1135) (Source -
Formation:
• The 200-day SMA (Simple Moving Average) and 20-
day EMA (Exponential Moving Average) have now shifted to
17164 / 5163 and 17575 / 5344, respectively.
• On the daily chart, we are witnessing a positive
crossover in “RSI” oscillator.
• Indices have closed around the “Upward Sloping Trend
Line” level of 17250 / 5255.
Source: Falcon
Actionable points:
Trading strategy:
View
Bullish above 5372
After a quiet opening, markets drifted marginally lower
Expected Target
5414 - 5446
during the initial trade. However, post mid-session, indices
Support Levels
5297 - 5233
gained momentum after crossing high of the “Bullish
Harami” pattern mentioned in our earlier report. This was
supported by positively poised oscillators and “5 & 20 EMA”
in the hourly chart. We are now observing a positive
crossover in daily “RSI” oscillator and expect the current
rally to continue further to higher levels over the next few
sessions. For the day, once the indices manage to cross
above yesterday’s high of 17623 / 5372, then they are
likely to test 17756 - 17871 / 5414 - 5446 levels. On the
downside, 17410 - 17211 / 5297 - 5233 levels may
provide decent support for the markets.
For Private Circulation Only |
1
Technical Research | March 22, 2012
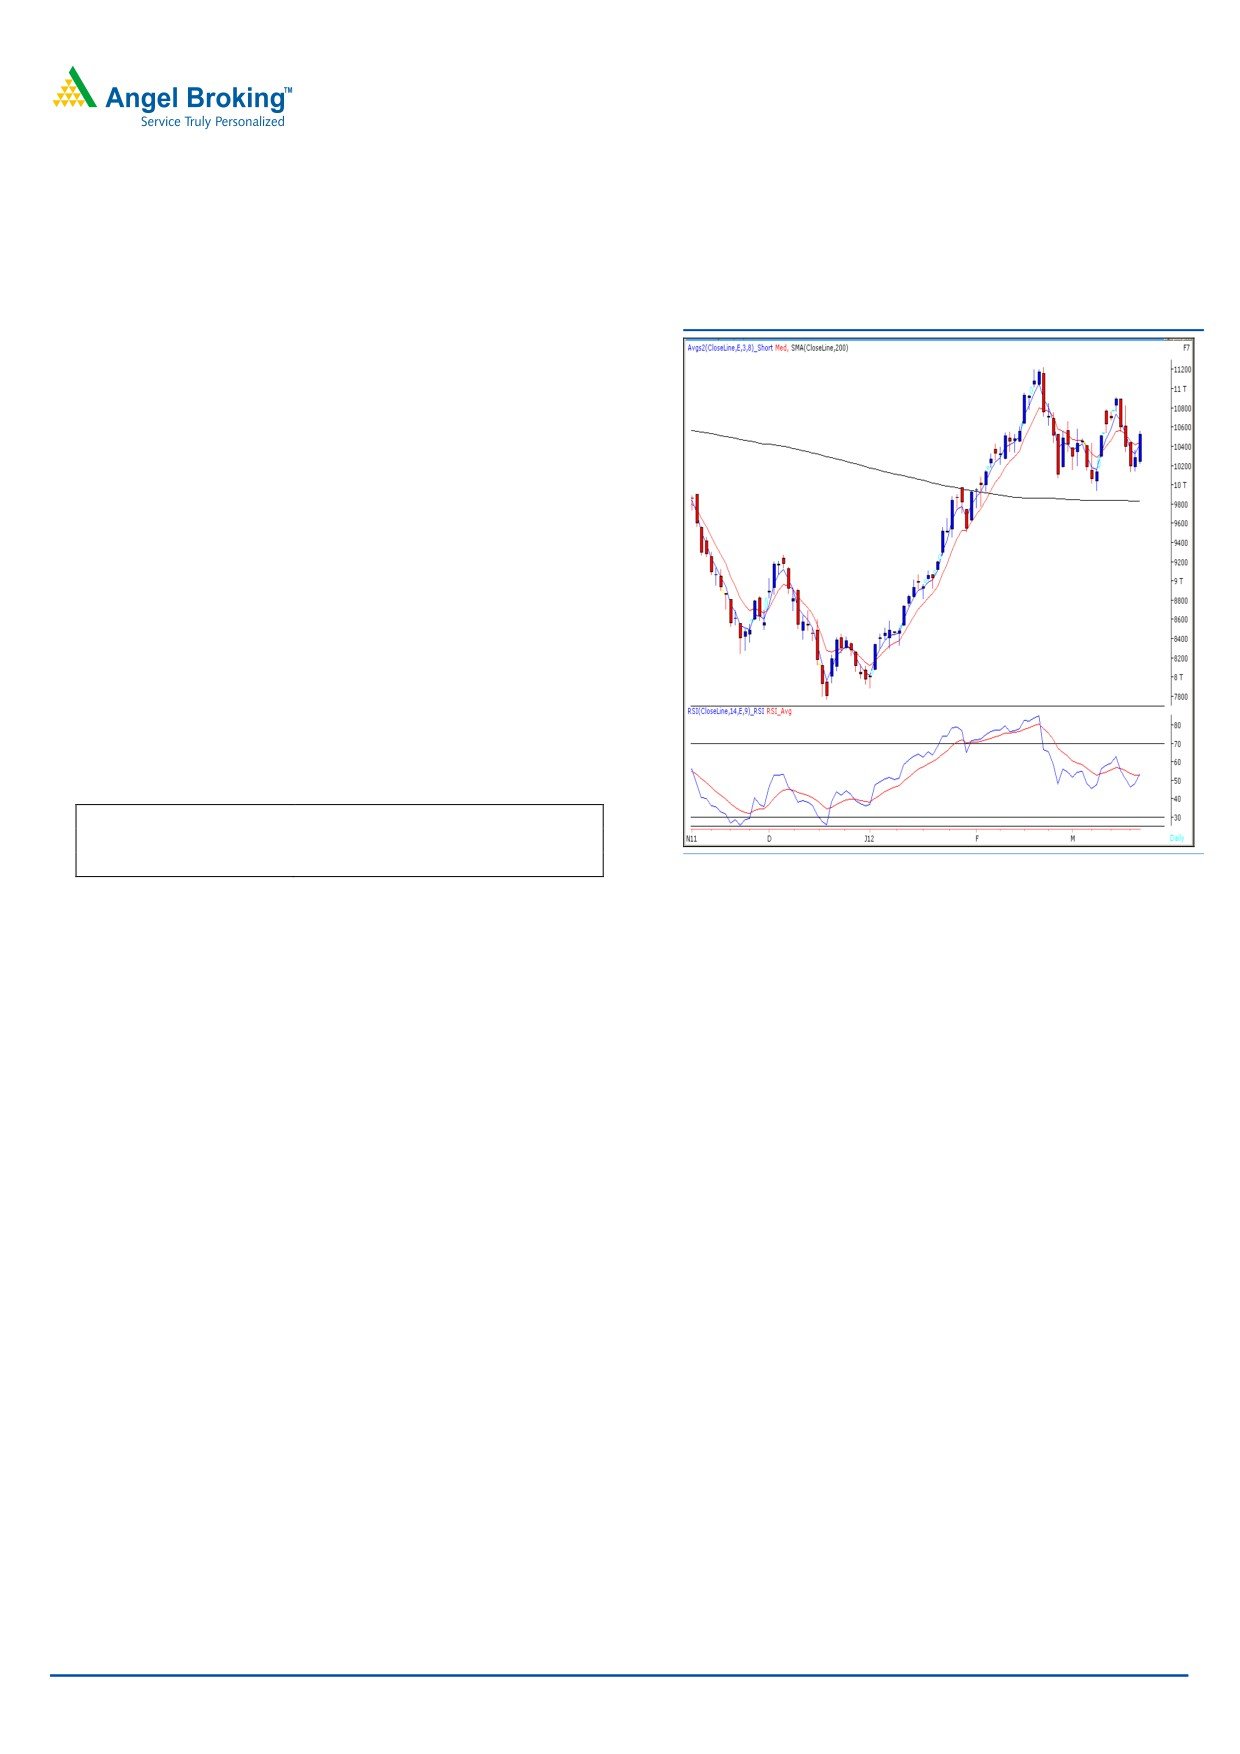
Bank Nifty Outlook - (10524)
Exhibit 2: Bank Nifty Daily Chart
Yesterday, Bank Nifty opened on a flat note and gained
momentum as the day progressed to test the mentioned
resistance level of 10556. The “Tweezer Bottom” pattern
formation mentioned in our previous report has been
confirmed as the index managed to close above the
10369 level. We are observing a positive crossover in
“RSI” momentum oscillator on the daily chart. Moreover,
the momentum oscillator “RSI” has moved above
50
which is a sign of strength in the index. Thus if the Bank
Nifty manages to sustain above yesterday’s high of
10562 then it is likely to rally further to test 10683 -
10750 levels. On the downside 10348 - 10298 levels
are likely to act as support in coming trading session.
Actionable points:
View
Positive Above 10562
Expected Target
10683 - 10750
Support Levels
10348 - 10298
Source: Falcon
For Private Circulation Only |
2
Technical Research | March 22, 2012
Positive Bias:
Positive
Expected
Stock Name
CMP
5 Day EMA
20 Day EMA
Remarks
Above
Target
View will change below
Escorts
73.7
73.1
75.6
73.8
78.5
69.8
View will change below
M&M
699.6
686.4
685.9
702
723
683.5
View will change below
ICICI Bank
934
921.5
914.3
940
975
913
For Private Circulation Only |
3
Technical Research | March 22, 2012
Daily Pivot Levels for Nifty 50 Stocks
SCRIPS
S2
S1
PIVOT
R1
R2
SENSEX
17,153
17,377
17,500
17,724
17,847
NIFTY
5,215
5,290
5,331
5,406
5,447
BANKNIFTY
10,090
10,307
10,435
10,652
10,779
ACC
1,339
1,365
1,381
1,407
1,423
AMBUJACEM
166
170
173
176
179
AXISBANK
1,158
1,194
1,218
1,253
1,278
BAJAJ-AUTO
1,644
1,689
1,714
1,759
1,785
BHARTIARTL
318
325
330
337
342
BHEL
256
263
267
274
278
BPCL
665
680
691
707
718
CAIRN
347
352
356
361
365
CIPLA
300
303
306
310
312
COALINDIA
325
328
330
334
336
DLF
189
196
201
208
212
DRREDDY
1,651
1,664
1,674
1,686
1,696
GAIL
355
362
368
375
381
HCLTECH
483
488
492
497
501
HDFC
652
660
664
672
677
HDFCBANK
497
506
512
521
527
HEROMOTOCO
1,892
1,909
1,927
1,944
1,962
HINDALCO
133
135
136
138
140
HINDUNILVR
392
397
401
407
410
ICICIBANK
881
908
924
950
966
IDFC
133
139
142
147
150
INFY
2,790
2,829
2,859
2,898
2,928
ITC
219
222
223
226
227
JINDALSTEL
562
575
583
597
604
JPASSOCIAT
75
79
81
84
86
KOTAKBANK
531
538
542
549
554
LT
1,247
1,297
1,327
1,377
1,407
M&M
677
688
695
706
713
MARUTI
1,316
1,340
1,356
1,380
1,396
NTPC
170
173
175
177
179
ONGC
267
269
272
274
276
PNB
938
956
967
986
996
POWERGRID
106
107
108
110
111
RANBAXY
393
408
416
430
439
RCOM
89
91
92
94
96
RELIANCE
747
758
766
776
784
RELINFRA
568
594
610
636
652
RPOWER
118
123
127
132
135
SAIL
91
94
97
100
102
SBIN
2,153
2,193
2,216
2,256
2,279
SESAGOA
191
197
202
208
212
SIEMENS
758
780
796
817
833
STER
110
113
115
118
120
SUNPHARMA
558
563
569
574
581
SUZLON
27
28
29
30
31
TATAMOTORS
259
268
273
281
286
TATAPOWER
102
103
104
105
106
TATASTEEL
439
456
465
482
491
TCS
1,121
1,148
1,164
1,192
1,207
WIPRO
418
423
428
433
439
Technical Research Team
For Private Circulation Only |
4
Technical Report
RESEARCH TEAM
Shardul Kulkarni
Head - Technicals
Sameet Chavan
Technical Analyst
Sacchitanand Uttekar
Technical Analyst
Mehul Kothari
Technical Analyst
Ankur Lakhotia
Technical Analyst
Research Team: 022-3952 6600
DISCLAIMER: This document is not for public distribution and has been furnished to you solely for your information and must not
be reproduced or redistributed to any other person. Persons into whose possession this document may come are required to observe
these restrictions.
Opinion expressed is our current opinion as of the date appearing on this material only. While we endeavor to update on a
reasonable basis the information discussed in this material, there may be regulatory, compliance, or other reasons that prevent us
from doing so. Prospective investors and others are cautioned that any forward-looking statements are not predictions and may be
subject to change without notice. Our proprietary trading and investment businesses may make investment decisions that are
inconsistent with the recommendations expressed herein.
The information in this document has been printed on the basis of publicly available information, internal data and other reliable
sources believed to be true and are for general guidance only. While every effort is made to ensure the accuracy and completeness of
information contained, the company takes no guarantee and assumes no liability for any errors or omissions of the information. No
one can use the information as the basis for any claim, demand or cause of action.
Recipients of this material should rely on their own investigations and take their own professional advice. Each recipient of this
document should make such investigations as it deems necessary to arrive at an independent evaluation of an investment in the
securities of companies referred to in this document (including the merits and risks involved), and should consult their own advisors to
determine the merits and risks of such an investment. Price and value of the investments referred to in this material may go up or
down. Past performance is not a guide for future performance. Certain transactions - futures, options and other derivatives as well as
non-investment grade securities - involve substantial risks and are not suitable for all investors. Reports based on technical analysis
centers on studying charts of a stock's price movement and trading volume, as opposed to focusing on a company's fundamentals
and as such, may not match with a report on a company's fundamentals.
We do not undertake to advise you as to any change of our views expressed in this document. While we would endeavor to update
the information herein on a reasonable basis, Angel Broking, its subsidiaries and associated companies, their directors and
employees are under no obligation to update or keep the information current. Also there may be regulatory, compliance, or other
reasons that may prevent Angel Broking and affiliates from doing so. Prospective investors and others are cautioned that any
forward-looking statements are not predictions and may be subject to change without notice.
Angel Broking Limited and affiliates, including the analyst who has issued this report, may, on the date of this report, and from time
to time, have long or short positions in, and buy or sell the securities of the companies mentioned herein or engage in any other
transaction involving such securities and earn brokerage or compensation or act as advisor or have other potential conflict of interest
with respect to company/ies mentioned herein or inconsistent with any recommendation and related information and opinions.
Angel Broking Limited and affiliates may seek to provide or have engaged in providing corporate finance, investment banking or
other advisory services in a merger or specific transaction to the companies referred to in this report, as on the date of this report or
in the past.
Sebi Registration No: INB 010996539
For Private Circulation Only |