Technical Research | February 22, 2012
Daily Technical Report
Sensex (18428) / NIFTY (5607)
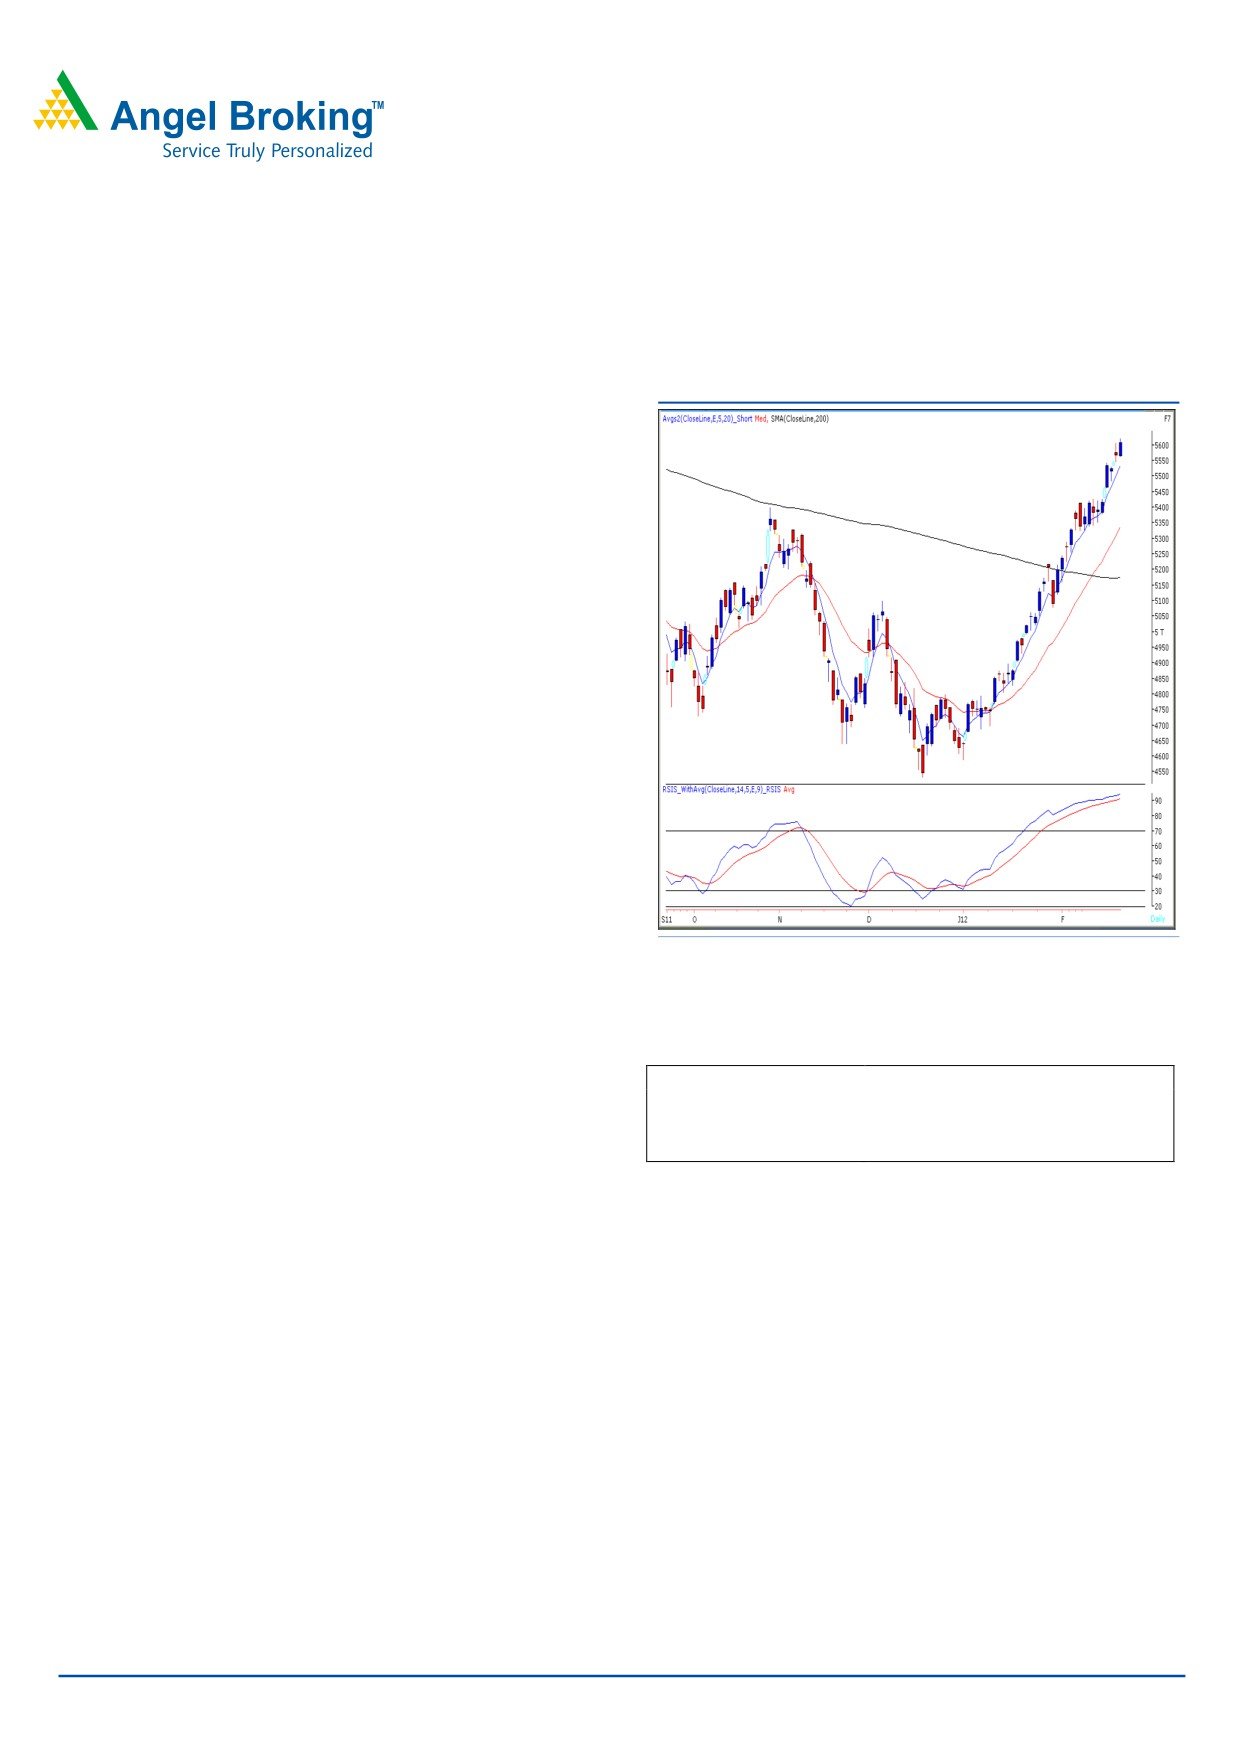
Exhibit 1: Nifty Daily Chart
Yesterday, markets opened on a flat note in-line with other
Asian indices but continued to move in the direction of
current trend to register a close well above the 5600 mark.
On the sectoral front, Realty, Consumer Durables and Oil &
Gas counters were among the major gainers, whereas IT
sector ended with a nominal loss. The advance to decline
ratio was marginally in favor of advancing counters.
Formation:
• On the Weekly chart, indices have closed well above
the “Horizontal Resistance Line” placed at 17908 /
5400 level.
• The 200-day SMA and 20-day EMA have now shifted to
17210 / 5172 and 17522 / 5306, respectively.
• The “RSI-Smoothened” oscillator on the daily chart is
Source: Falcon
still placed in extreme overbought territory.
Actionable points:
Trading strategy:
View
Positive
After a quiet opening, indices showed some positive
Buy above
5622
momentum and moved higher towards the immediate
Expected targets
5645 - 5702
Support levels
5561 - 5545 - 5483
resistance level of 18423 / 5607. Eventually the markets
registered a high of 18471 / 5622 for the day. Going
forward, if indices manage to sustain above yesterday’s
high of 18471 / 5622, then they are likely to test 18756 -
18945 / 5645 - 5702 levels. On the downside, 18293 -
18234 / 5561 - 5545 levels may provide decent support
for the markets. Only a breach of 18234 / 5545 level may
attract some selling pressure, which may drag indices to test
18043 - 17627 / 5483 - 5341 levels.
For Private Circulation Only |
1
Technical Research | February 22, 2012
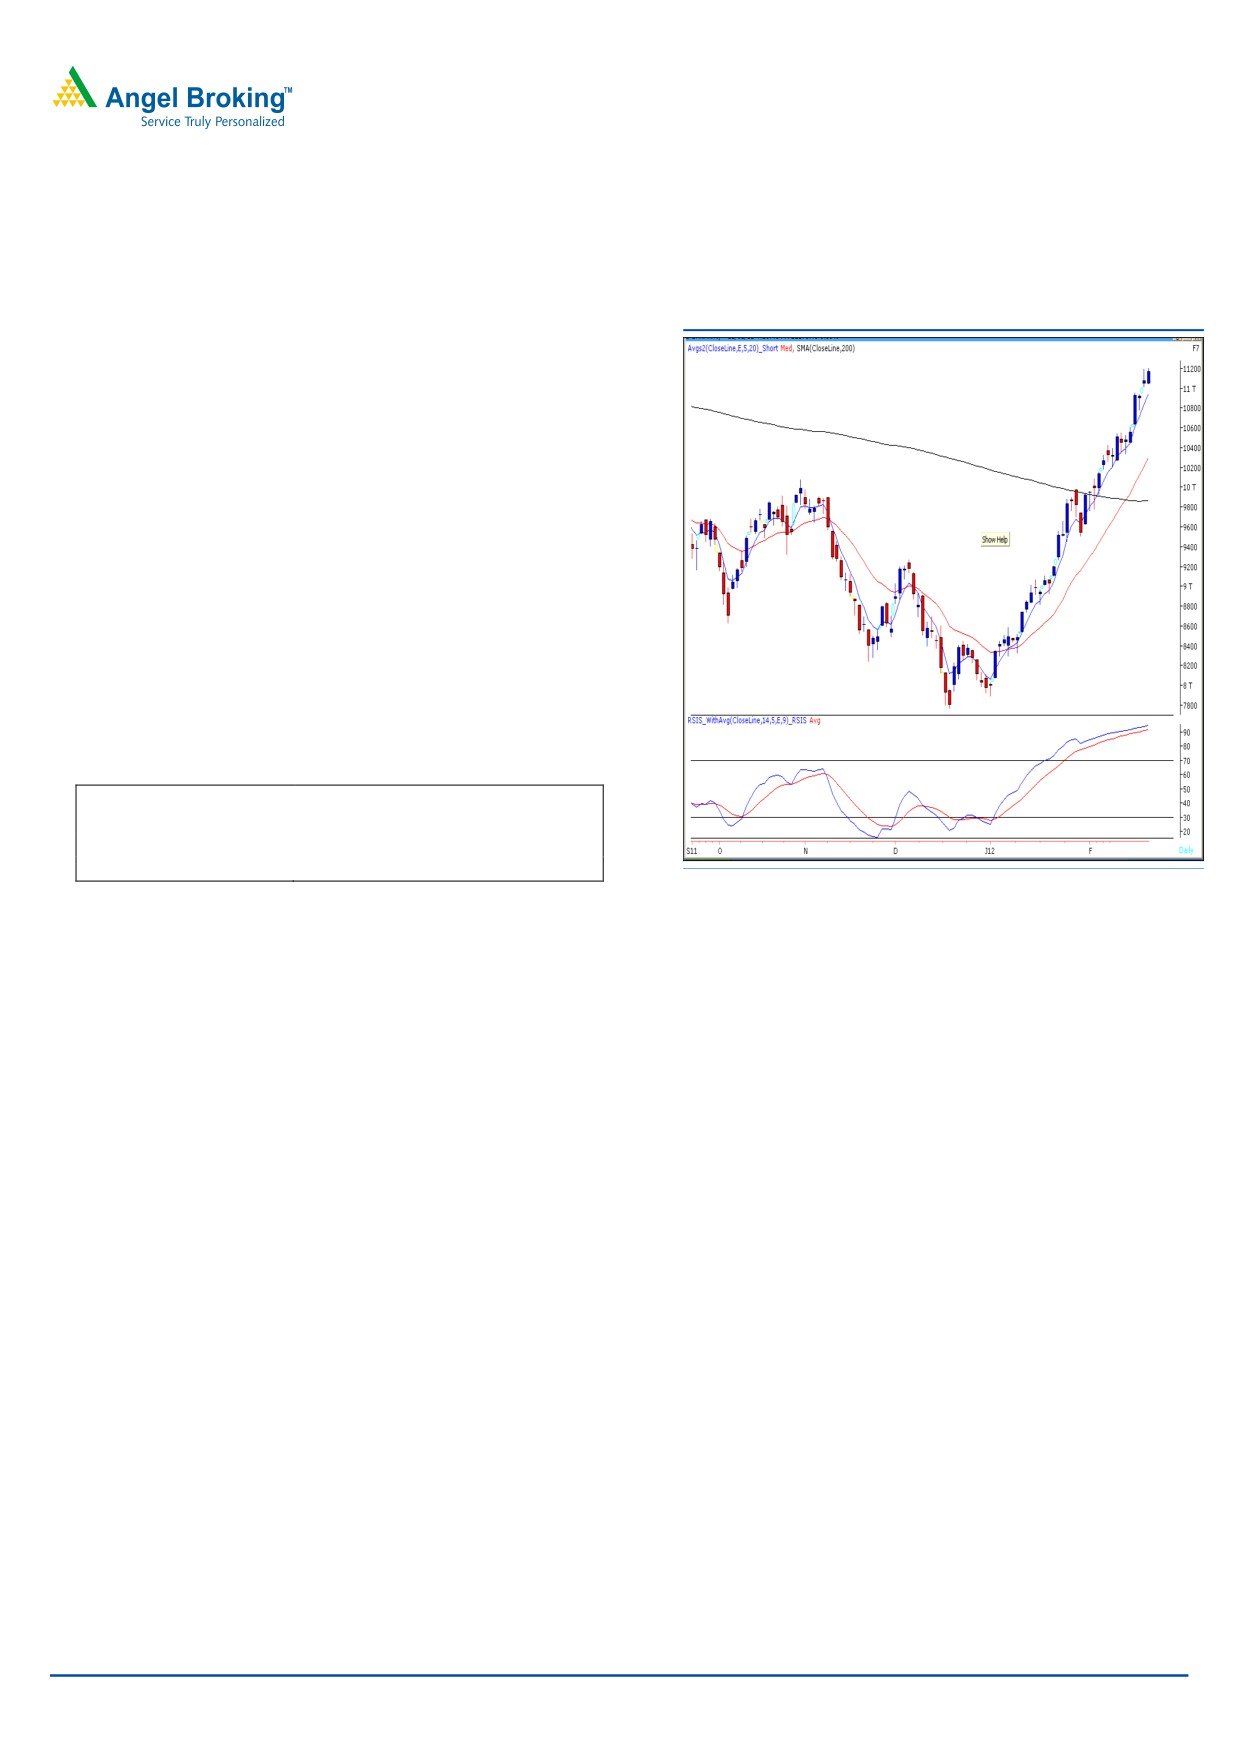
Bank Nifty Outlook - (11170)
Exhibit 2: Bank Nifty Daily Chart
Yesterday, Bank Nifty opened on a flat note and traded in
the mentioned range of 11013 - 11204. The candle stick
pattern “Spinning Top” formed during Friday’s session
still holds as the index failed to close above the high
(11204) of the mentioned pattern. On the hourly chart we
are witnessing a possibility of negative divergence on
“RSI” momentum oscillator. A consolidation or minor
correction is likely only if the Bank Nifty falls below
Friday’s low of 11013. In such a scenario the index is
likely to test 10940 - 10775 levels. On the upside if the
index sustains above yesterday’s high of 11207 then it is
likely to rally towards 11325 - 11450 levels.
Actionable points:
View
Positive
Buy above
11207
Expected Target
11325 - 11450
Support Levels
11013 - 10938 - 10775
Source: Falcon
For Private Circulation Only |
2
Technical Research | February 22, 2012
Positive Bias:
Expected
Stock Name
CMP
5 Day EMA
20 Day EMA
Remarks
Target
Bharti Airtel
358.9
353.1
355.3
367.5
View will change below 356.30
For Private Circulation Only |
3
Technical Research | February 22, 2012
Daily Pivot Levels for Nifty 50 Stocks
SCRIPS
S2
S1
PIVOT
R1
R2
SENSEX
18,221
18,325
18,398
18,502
18,575
NIFTY
5,537
5,572
5,597
5,632
5,657
BANKNIFTY
10,976
11,073
11,140
11,237
11,304
ACC
1,342
1,356
1,368
1,383
1,395
AMBUJACEM
168
170
173
175
178
AXISBANK
1,248
1,268
1,288
1,308
1,328
BAJAJ-AUTO
1,771
1,790
1,809
1,828
1,847
BHARTIARTL
341
350
355
364
370
BHEL
303
310
315
323
328
BPCL
594
604
614
624
634
CAIRN
382
387
392
396
401
CIPLA
318
320
323
325
328
DLF
316
321
325
330
334
DRREDDY
247
253
257
262
266
GAIL
1,617
1,633
1,647
1,663
1,676
HCLTECH
374
377
380
384
386
HDFC
483
488
492
497
500
HDFCBANK
705
710
716
720
726
HEROMOTOCO
516
524
529
537
542
HINDALCO
2,106
2,127
2,142
2,162
2,177
HINDUNILVR
150
153
155
158
160
ICICIBANK
376
379
384
387
391
IDFC
966
979
989
1,001
1,012
INFY
142
146
149
154
157
ITC
2,888
2,913
2,936
2,962
2,985
JINDALSTEL
204
206
207
209
210
JPASSOCIAT
629
637
646
654
663
KOTAKBANK
82
84
85
86
88
LT
561
569
577
584
593
M&M
1,414
1,430
1,455
1,471
1,495
MARUTI
726
744
757
775
788
NTPC
1,272
1,291
1,314
1,333
1,356
ONGC
182
184
187
189
192
PNB
278
285
290
297
301
POWERGRID
1,051
1,061
1,076
1,087
1,101
RANBAXY
109
110
111
112
113
RCOM
441
445
450
454
458
RELCAPITAL
102
105
106
109
111
RELIANCE
802
823
836
857
869
RELINFRA
602
621
632
651
662
RPOWER
122
125
128
131
134
SAIL
109
110
112
114
116
SBIN
2,387
2,420
2,447
2,480
2,507
SESAGOA
236
241
248
253
260
SIEMENS
814
821
830
836
846
STER
121
125
130
134
139
SUNPHARMA
534
538
544
549
554
SUZLON
29
30
30
31
32
TATAMOTORS
266
269
272
275
279
TATAPOWER
110
113
117
120
124
TATASTEEL
470
481
491
502
512
TCS
1,192
1,215
1,227
1,250
1,263
WIPRO
436
440
445
449
455
Technical Research Team
For Private Circulation Only |
4
Technical Report
RESEARCH TEAM
Shardul Kulkarni
Head - Technicals
Sameet Chavan
Technical Analyst
Sacchitanand Uttekar
Technical Analyst
Mehul Kothari
Technical Analyst
Ankur Lakhotia
Technical Analyst
Research Team: 022-3952 6600
DISCLAIMER: This document is not for public distribution and has been furnished to you solely for your information and must not
be reproduced or redistributed to any other person. Persons into whose possession this document may come are required to observe
these restrictions.
Opinion expressed is our current opinion as of the date appearing on this material only. While we endeavor to update on a
reasonable basis the information discussed in this material, there may be regulatory, compliance, or other reasons that prevent us
from doing so. Prospective investors and others are cautioned that any forward-looking statements are not predictions and may be
subject to change without notice. Our proprietary trading and investment businesses may make investment decisions that are
inconsistent with the recommendations expressed herein.
The information in this document has been printed on the basis of publicly available information, internal data and other reliable
sources believed to be true and are for general guidance only. While every effort is made to ensure the accuracy and completeness of
information contained, the company takes no guarantee and assumes no liability for any errors or omissions of the information. No
one can use the information as the basis for any claim, demand or cause of action.
Recipients of this material should rely on their own investigations and take their own professional advice. Each recipient of this
document should make such investigations as it deems necessary to arrive at an independent evaluation of an investment in the
securities of companies referred to in this document (including the merits and risks involved), and should consult their own advisors to
determine the merits and risks of such an investment. Price and value of the investments referred to in this material may go up or
down. Past performance is not a guide for future performance. Certain transactions - futures, options and other derivatives as well as
non-investment grade securities - involve substantial risks and are not suitable for all investors. Reports based on technical analysis
centers on studying charts of a stock's price movement and trading volume, as opposed to focusing on a company's fundamentals
and as such, may not match with a report on a company's fundamentals.
We do not undertake to advise you as to any change of our views expressed in this document. While we would endeavor to update
the information herein on a reasonable basis, Angel Broking, its subsidiaries and associated companies, their directors and
employees are under no obligation to update or keep the information current. Also there may be regulatory, compliance, or other
reasons that may prevent Angel Broking and affiliates from doing so. Prospective investors and others are cautioned that any
forward-looking statements are not predictions and may be subject to change without notice.
Angel Broking Limited and affiliates, including the analyst who has issued this report, may, on the date of this report, and from time
to time, have long or short positions in, and buy or sell the securities of the companies mentioned herein or engage in any other
transaction involving such securities and earn brokerage or compensation or act as advisor or have other potential conflict of interest
with respect to company/ies mentioned herein or inconsistent with any recommendation and related information and opinions.
Angel Broking Limited and affiliates may seek to provide or have engaged in providing corporate finance, investment banking or
other advisory services in a merger or specific transaction to the companies referred to in this report, as on the date of this report or
in the past.
Sebi Registration No : INB 010996539
For Private Circulation Only |