Technical Research | December 22, 2011
Daily Technical Report
Sensex (15685) / NIFTY (4693)
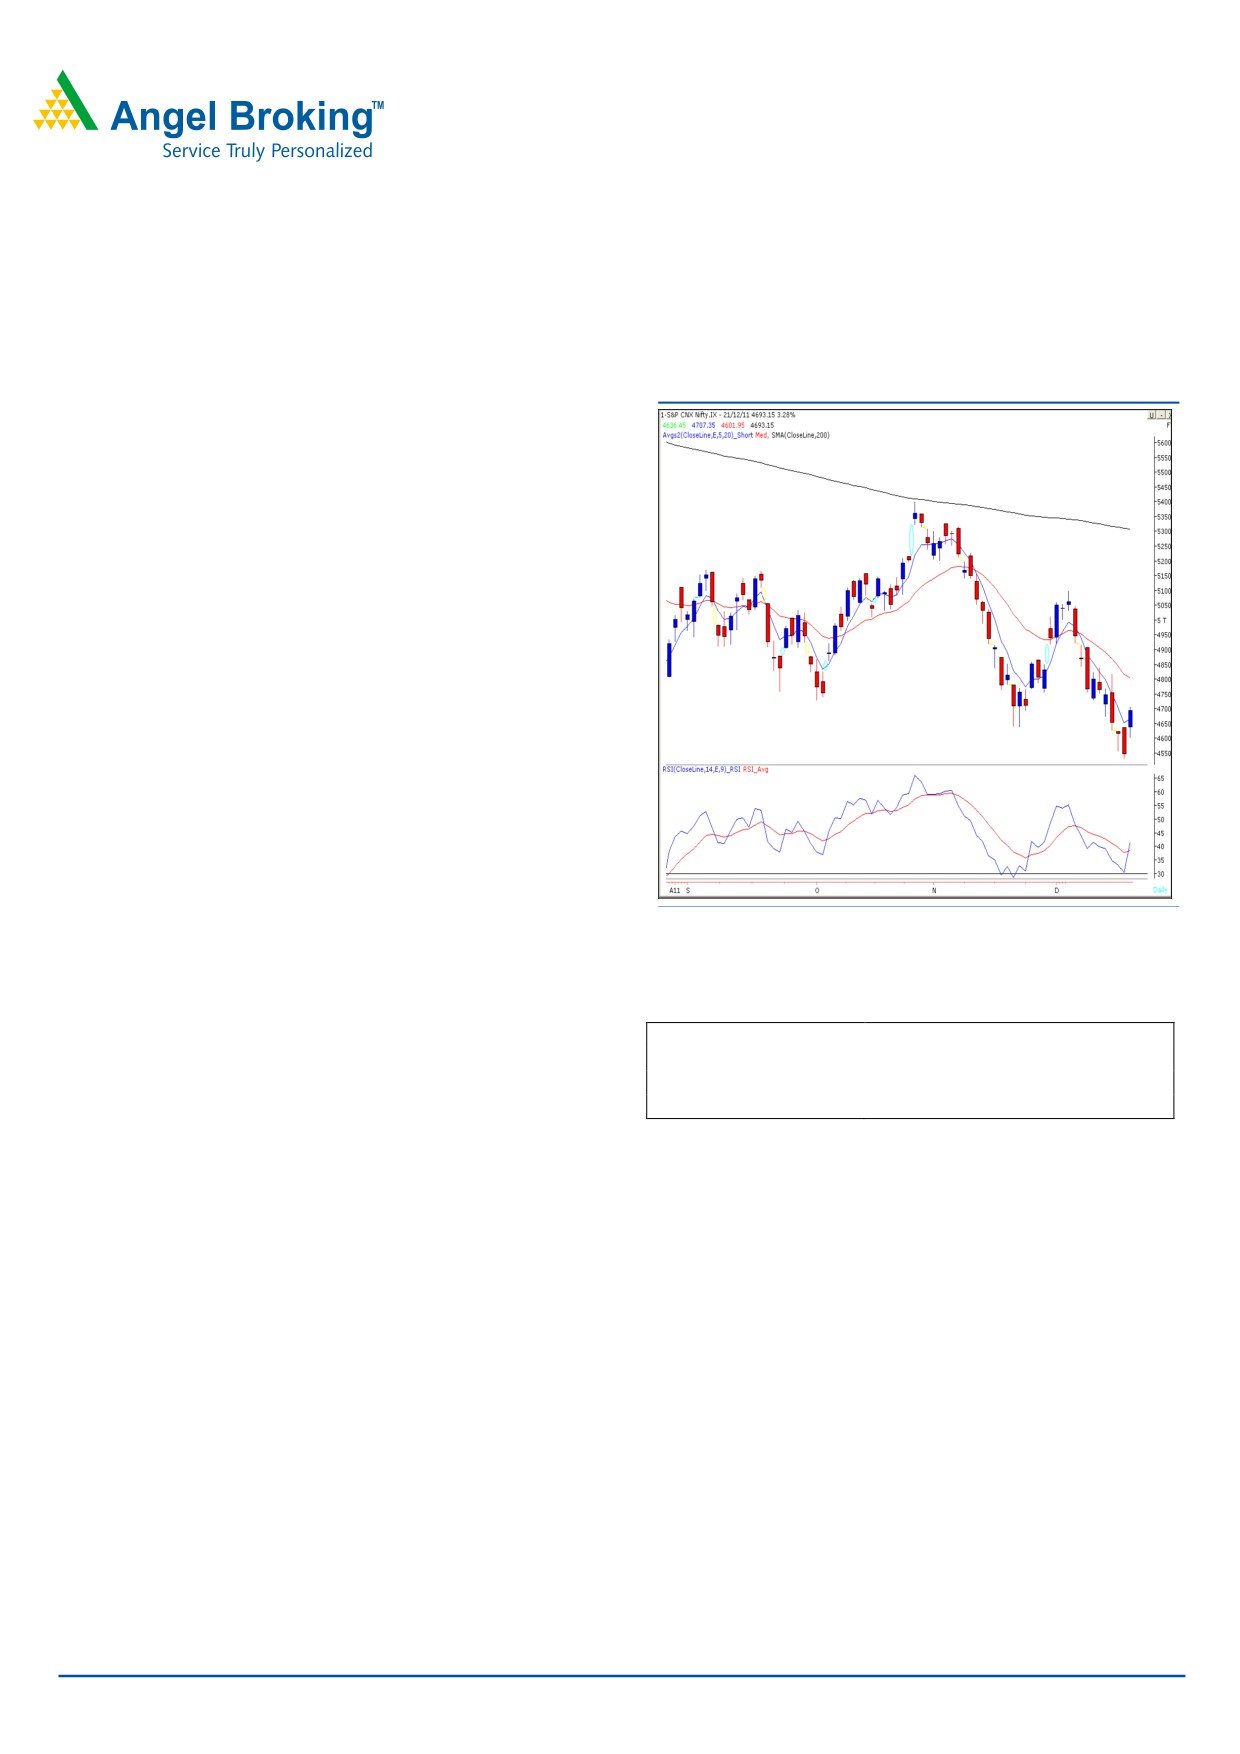
Exhibit 1: Nifty Daily Chart
Yesterday, we witnessed a strong gap up opening mainly
due to positive cues from global indices. The positive
momentum stayed throughout the day and Indices closed
almost at the highest point of the day. On the sectoral front,
Banking, Consumer Durables and Oil & Gas sectors
contributed heavily in yesterday’s rally. There was no sector
on the losing side. The advance to decline ratio was
strongly in favor of declining counters. (A=1658 D=1097).
Formation
• On the Daily chart, we are witnessing a positive
crossover in “RSI” momentum oscillator.
• The 20 EMA on the daily chart is placed at 16020 /
4800.
Source: Falcon
Actionable points:
Trading strategy:
Indices opened on an optimistic note and crossed key
View
Positive
resistance level of 15450 / 4638 during the latter part of
Buy above
4707
the session to rally towards 15750 / 4730. We are now
Expected target
4754 - 4800
observing a positive crossover in daily “RSI” momentum
Support levels
4638 - 4531
oscillator. The positive impact of this crossover may be seen
if indices manage to sustain above yesterday’s high of
15727 / 4707. In this scenario, markets are likely to rally
towards 15850 / 4754 level and may even test the 20 EMA
at 16020 / 4800. On the downside, 15450 - 15135 /
4638 - 4531 levels are likely to act as support in coming
trading sessions.
For Private Circulation Only |
1
Technical Research | December 22, 2011
Bank Nifty Outlook - (8189)
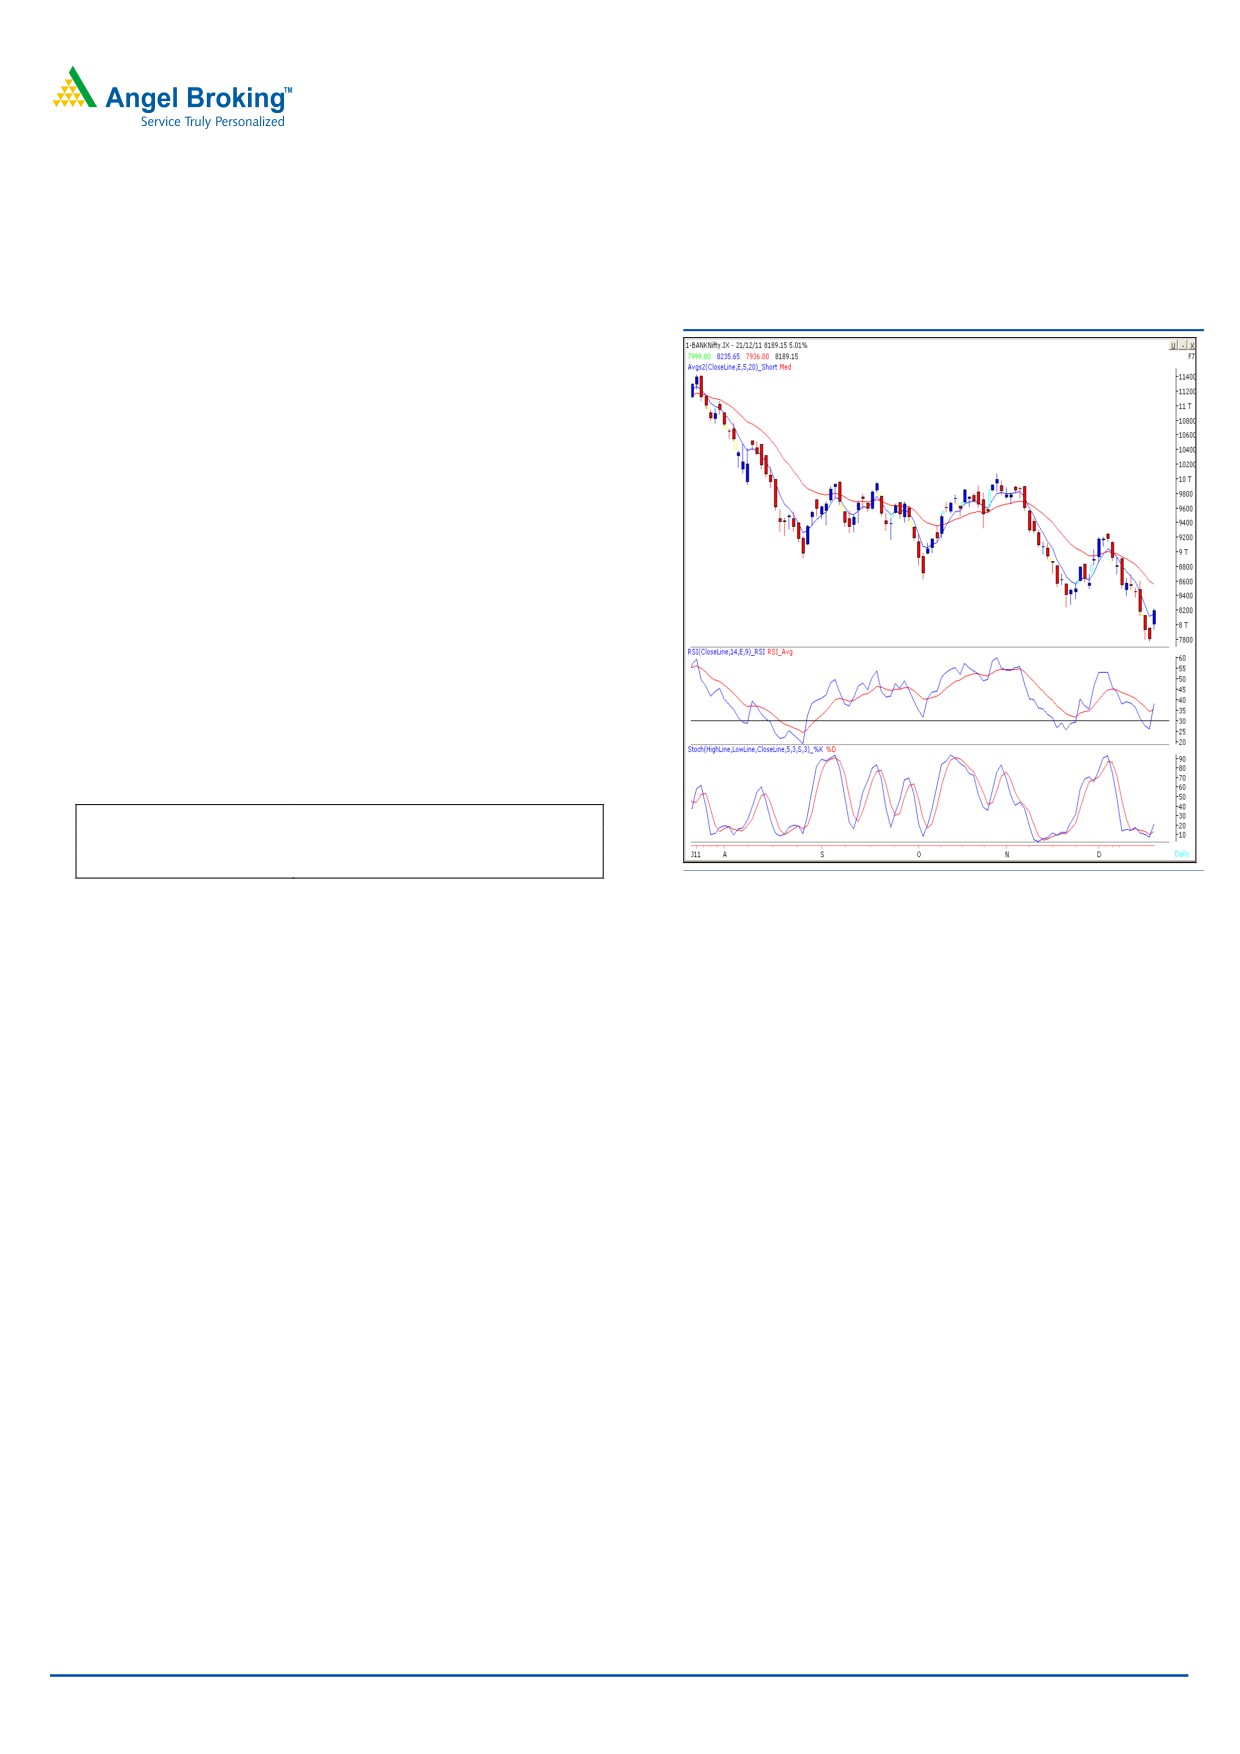
Exhibit 2: Bank Nifty Daily Chart
Bank nifty opened with an upside gap and traded in a
narrow range during first hour of the session. However,
during the last hour of trade, strong positive momentum was
witnessed and the Index closed well above the mentioned
resistance level of 8085. We had mentioned in our previous
report that “RSI - Smoothened” oscillator on the hourly chart
is in an oversold condition and a bounce back is likely. We
are now witnessing a positive crossover in “Stochastic and
RSI” momentum oscillator on the daily chart. Thus, if Bank
Nifty manages to sustain above yesterday’s high of 8236
then it is likely to test 8281 - 8342 levels. On the downside
the 8000 mark is expected to act as support in coming
trading session.
Actionable points:
View
Neutral
Resistance levels
8136 - 8281 - 8342
Support level
8000
Source: Falcon
For Private Circulation Only |
2
Technical Research | December 22, 2011
Positive Bias:
Expected
Stock Name
CMP
5 Day EMA
20 Day EMA
Remarks
Target
Tata Power
86.90
86.45
91.2
91.2
View will change below 81.30
Bharti Artl
341.5
337.5
357.3
352
View will change below 330.5
Negative Bias:
Expected
Stock Name
CMP
5 Day EMA
20 Day EMA
Remarks
Target
MRF
6859
6959.8
6979.5
6625
View will change above 7076
Dr. Reddy
1565
1576.7
1576.2
1536
View will change above 1583
For Private Circulation Only |
3
Technical Research | December 22, 2011
Daily Pivot Levels for Nifty 50 Stocks
SCRIPS
S2
S1
PIVOT
R1
R2
SENSEX
15,246
15,466
15,597
15,816
15,947
NIFTY
4,562
4,628
4,667
4,733
4,773
BANKNIFTY
7,821
8,005
8,120
8,305
8,420
ACC
1,095
1,118
1,133
1,156
1,171
AMBUJACEM
149
152
155
158
161
AXISBANK
822
838
849
865
875
BAJAJ-AUTO
1,542
1,578
1,604
1,640
1,666
BHARTIARTL
321
331
338
349
356
BHEL
225
229
234
239
244
BPCL
487
501
513
527
539
CAIRN
312
316
319
323
326
CIPLA
321
327
332
338
342
DLF
180
184
189
193
197
DRREDDY
1,534
1,549
1,568
1,583
1,602
GAIL
371
380
386
395
401
HCLTECH
378
383
391
397
405
HDFC
623
639
649
666
676
HDFCBANK
409
422
431
444
452
HEROMOTOCO
1,726
1,786
1,825
1,884
1,923
HINDALCO
118
121
123
125
127
HINDUNILVR
394
398
401
405
408
ICICIBANK
657
680
694
717
732
IDFC
92
95
100
103
108
INFY
2,651
2,697
2,726
2,772
2,801
ITC
198
200
202
204
205
JINDALSTEL
473
479
486
492
499
JPASSOCIAT
49
51
53
56
58
KOTAKBANK
415
440
459
484
502
LT
951
976
993
1,017
1,035
M&M
641
666
681
706
722
MARUTI
909
936
952
979
995
NTPC
152
157
159
164
166
ONGC
250
256
259
265
268
PNB
768
779
789
801
811
POWERGRID
96
97
98
99
100
RANBAXY
371
389
399
417
428
RCOM
60
64
66
70
72
RELCAPITAL
228
234
239
245
249
RELIANCE
710
729
741
760
773
RELINFRA
332
343
350
361
369
RPOWER
67
70
71
74
76
SAIL
78
79
80
82
82
SBIN
1,578
1,601
1,618
1,641
1,658
SESAGOA
147
155
159
167
171
SIEMENS
625
640
649
664
673
STER
88
89
91
92
94
SUNPHARMA
485
492
500
507
514
SUZLON
17
17
18
18
19
TATAMOTORS
171
174
178
181
185
TATAPOWER
79
83
85
89
92
TATASTEEL
336
343
348
355
360
TCS
1,106
1,132
1,149
1,176
1,193
WIPRO
386
396
404
415
423
Technical Research Team
For Private Circulation Only |
4
Technical Report
RESEARCH TEAM
Shardul Kulkarni
Head - Technicals
Sameet Chavan
Technical Analyst
Sacchitanand Uttekar
Technical Analyst
Mehul Kothari
Technical Analyst
Ankur Lakhotia
Technical Analyst
Research Team: 022-3952 6600
DISCLAIMER: This document is not for public distribution and has been furnished to you solely for your information and must not
be reproduced or redistributed to any other person. Persons into whose possession this document may come are required to observe
these restrictions.
Opinion expressed is our current opinion as of the date appearing on this material only. While we endeavor to update on a
reasonable basis the information discussed in this material, there may be regulatory, compliance, or other reasons that prevent us
from doing so. Prospective investors and others are cautioned that any forward-looking statements are not predictions and may be
subject to change without notice. Our proprietary trading and investment businesses may make investment decisions that are
inconsistent with the recommendations expressed herein.
The information in this document has been printed on the basis of publicly available information, internal data and other reliable
sources believed to be true and are for general guidance only. While every effort is made to ensure the accuracy and completeness of
information contained, the company takes no guarantee and assumes no liability for any errors or omissions of the information. No
one can use the information as the basis for any claim, demand or cause of action.
Recipients of this material should rely on their own investigations and take their own professional advice. Each recipient of this
document should make such investigations as it deems necessary to arrive at an independent evaluation of an investment in the
securities of companies referred to in this document (including the merits and risks involved), and should consult their own advisors to
determine the merits and risks of such an investment. Price and value of the investments referred to in this material may go up or
down. Past performance is not a guide for future performance. Certain transactions - futures, options and other derivatives as well as
non-investment grade securities - involve substantial risks and are not suitable for all investors. Reports based on technical analysis
centers on studying charts of a stock's price movement and trading volume, as opposed to focusing on a company's fundamentals
and as such, may not match with a report on a company's fundamentals.
We do not undertake to advise you as to any change of our views expressed in this document. While we would endeavor to update
the information herein on a reasonable basis, Angel Broking, its subsidiaries and associated companies, their directors and
employees are under no obligation to update or keep the information current. Also there may be regulatory, compliance, or other
reasons that may prevent Angel Broking and affiliates from doing so. Prospective investors and others are cautioned that any
forward-looking statements are not predictions and may be subject to change without notice.
Angel Broking Limited and affiliates, including the analyst who has issued this report, may, on the date of this report, and from time
to time, have long or short positions in, and buy or sell the securities of the companies mentioned herein or engage in any other
transaction involving such securities and earn brokerage or compensation or act as advisor or have other potential conflict of interest
with respect to company/ies mentioned herein or inconsistent with any recommendation and related information and opinions.
Angel Broking Limited and affiliates may seek to provide or have engaged in providing corporate finance, investment banking or
other advisory services in a merger or specific transaction to the companies referred to in this report, as on the date of this report or
in the past.
Sebi Registration No : INB 010996539
For Private Circulation Only |