Technical Research | December 21, 2011
Daily Technical Report
Sensex (15175) / NIFTY (4544)
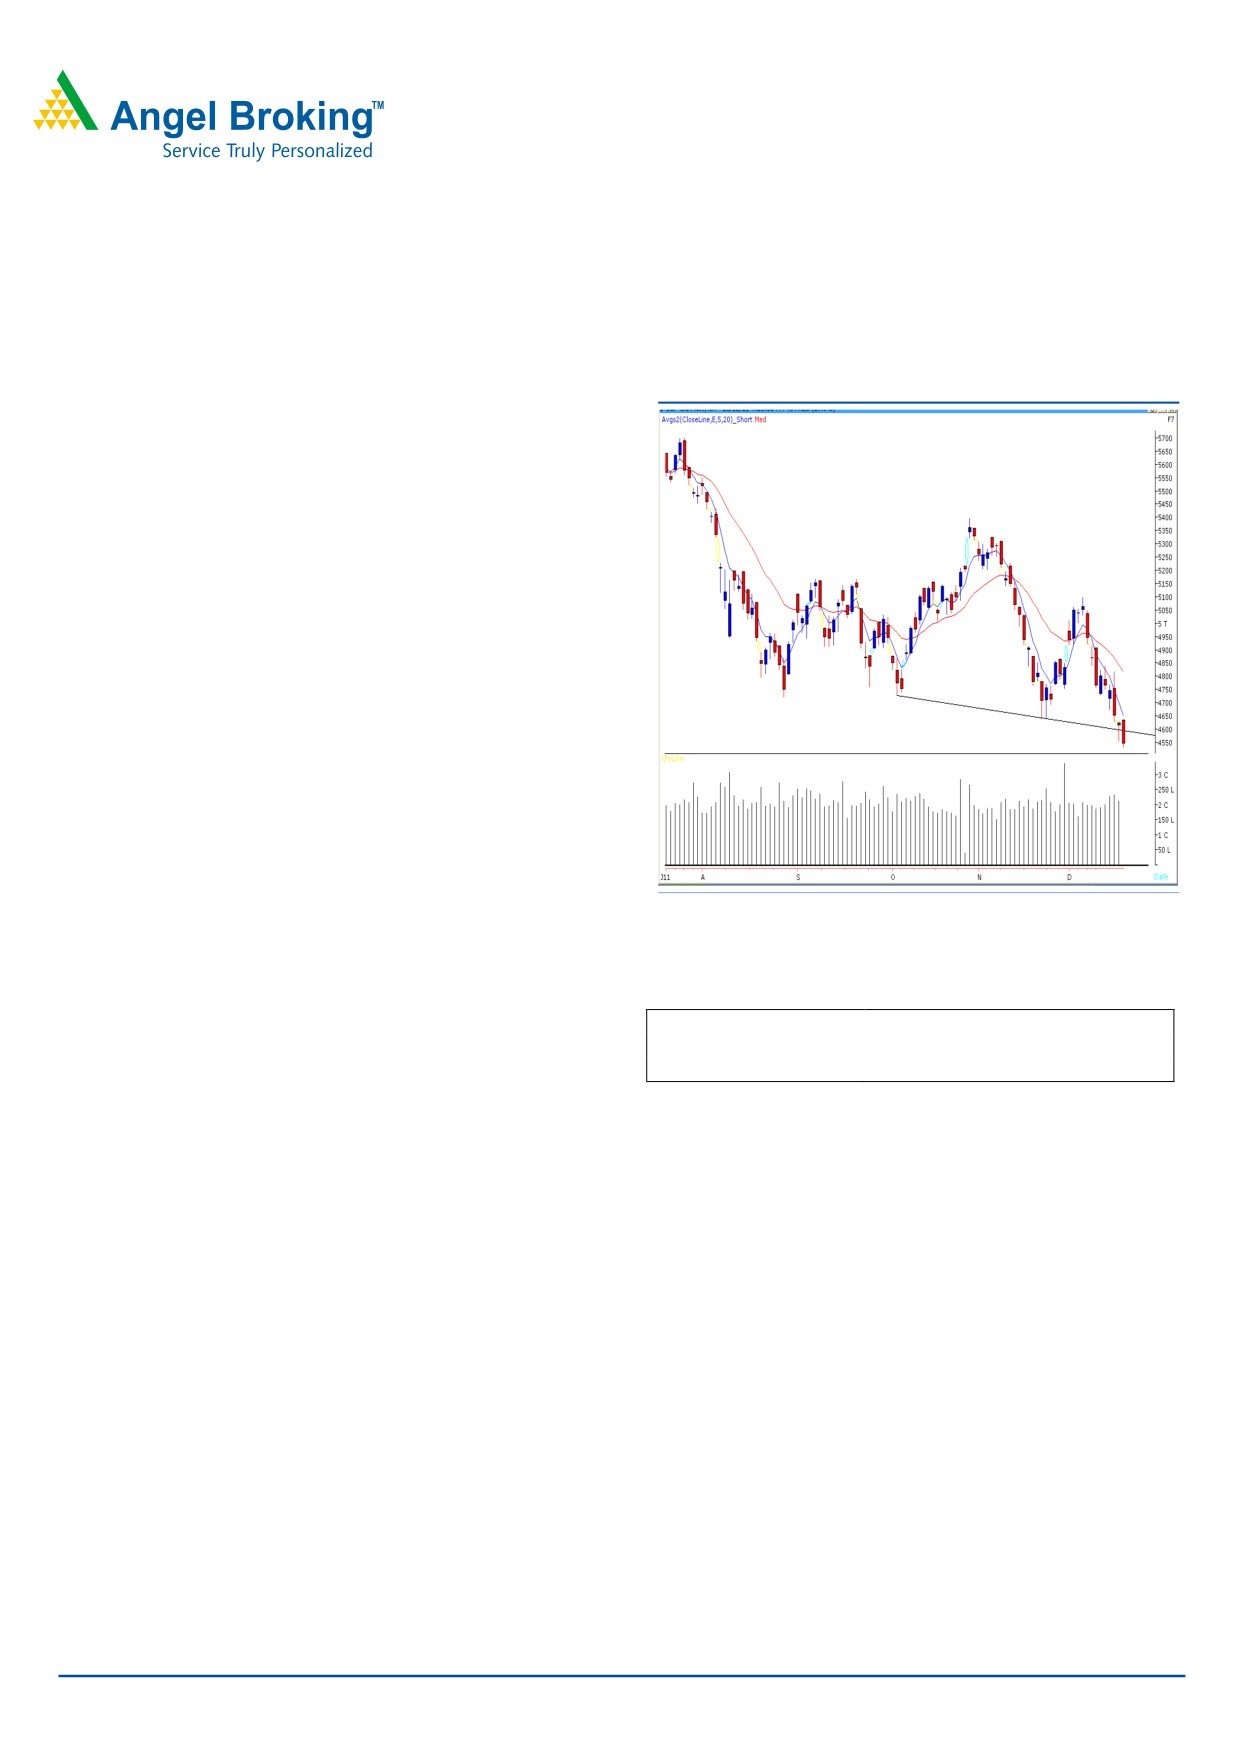
Exhibit 1: Nifty Daily Chart
Yesterday markets opened on a flat note and traded with
immense volatility throughout the session. A sharp
correction during the last hour forced indices to break
previous low of 15190 / 4555 and close marginally below
this level. On the sectoral front, Capital Goods, Metal and
Realty were among the major losers, whereas FMCG sector
ended on a gaining side. The advance to decline ratio was
strongly in favor of declining counters. (A=862 D=1877).
Formation
• On the Daily chart, we are witnessing a “Downward
Sloping Trend Line” joining two lows of 15760 - 15479 /
4728 - 4639.
Source: Falcon
Trading strategy:
Actionable points:
Indices opened on a quiet note and tried crossing the
resistance at 15440 / 4623 but failed to sustain at higher
View
Neutral
levels as strong selling pressure intensified during the latter
Resistance levels
4638 - 4672
part of the session. As a result indices breached the low of a
Support levels
4531 - 4430
“bullish Hammer” and negated the bullish implication of
the pattern. However, considering the positive global cues it
is likely that our markets may open on a positive note. On
the upside, 15450 / 4638 level is expected to act as the first
resistance level. A move beyond this may push indices
higher to test 15590 - 15750 / 4672 - 4730 levels. On the
downside, a fall below 15135 / 4531 may lead indices to
drift towards 14870 / 4430 levels.
For Private Circulation Only |
1
Technical Research | December 21, 2011
Bank Nifty Outlook - (7799)
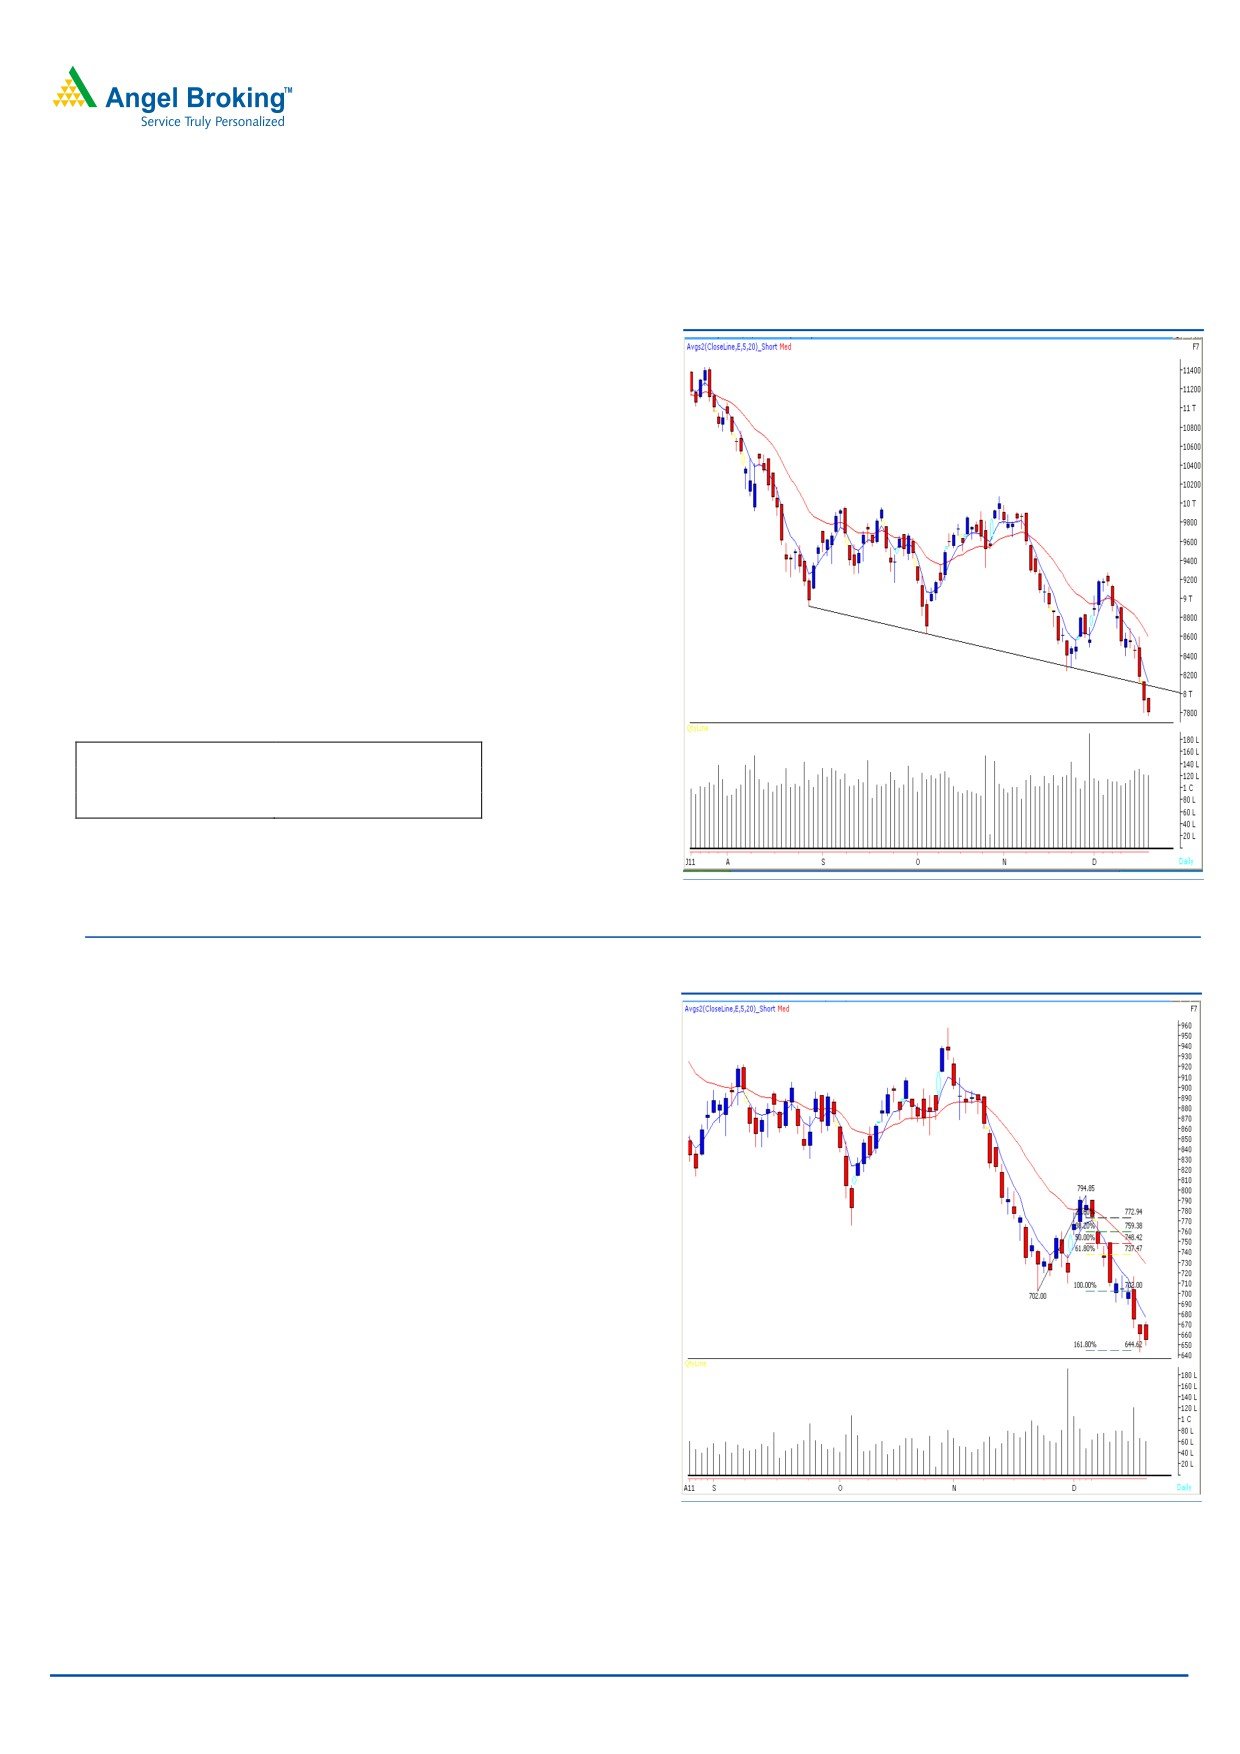
Exhibit 2: Bank Nifty Daily Chart
Bank nifty opened on a flat note and traded with extreme
volatility throughout the session to close marginally below
yesterday’s low of 7801. As mentioned in our previous
reports the rising “ADX
(14)” currently at
27.71, is
suggesting that the downtrend is getting stronger. On the
contrary the “”RSI - Smoothened” oscillator on the hourly
chart is placed in an extreme oversold condition. Thus a
possibility of a pullback cannot be ruled out. On the upside
7961 - 8085 levels are likely to act as resistance levels for
the day. On the downside 7728 - 7600 levels are likely to
act as support in coming trading session.
Actionable points:
View
Neutral
Resistance Level
8107 - 8172
Support Level
7801 - 7600
Source: Falcon
Stock Recommendations:
Exhibit 3: ICICI Bank(December Futures)
Stock - ICICI Bank (December Futures)
Action - Buy
Last close
` 654.40
Buy Above
` 670
Stop Loss
` 649.80
Target
` 710
Justification - On the Daily chart, the stock has taken a
support near 161.8% retracement of the rise from ` 702 to
` 794.85 and has formed a “Hammer” candle pattern
during Monday’s session. The “RSI - Smoothend” oscillator
on the hourly chart is positively poised. We advise buying
the stock ONLY above ` 670 for a target of ` 710 in
coming 5 - 6 trading sessions.
Source: Falcon
For Private Circulation Only |
2
Technical Research | December 21, 2011
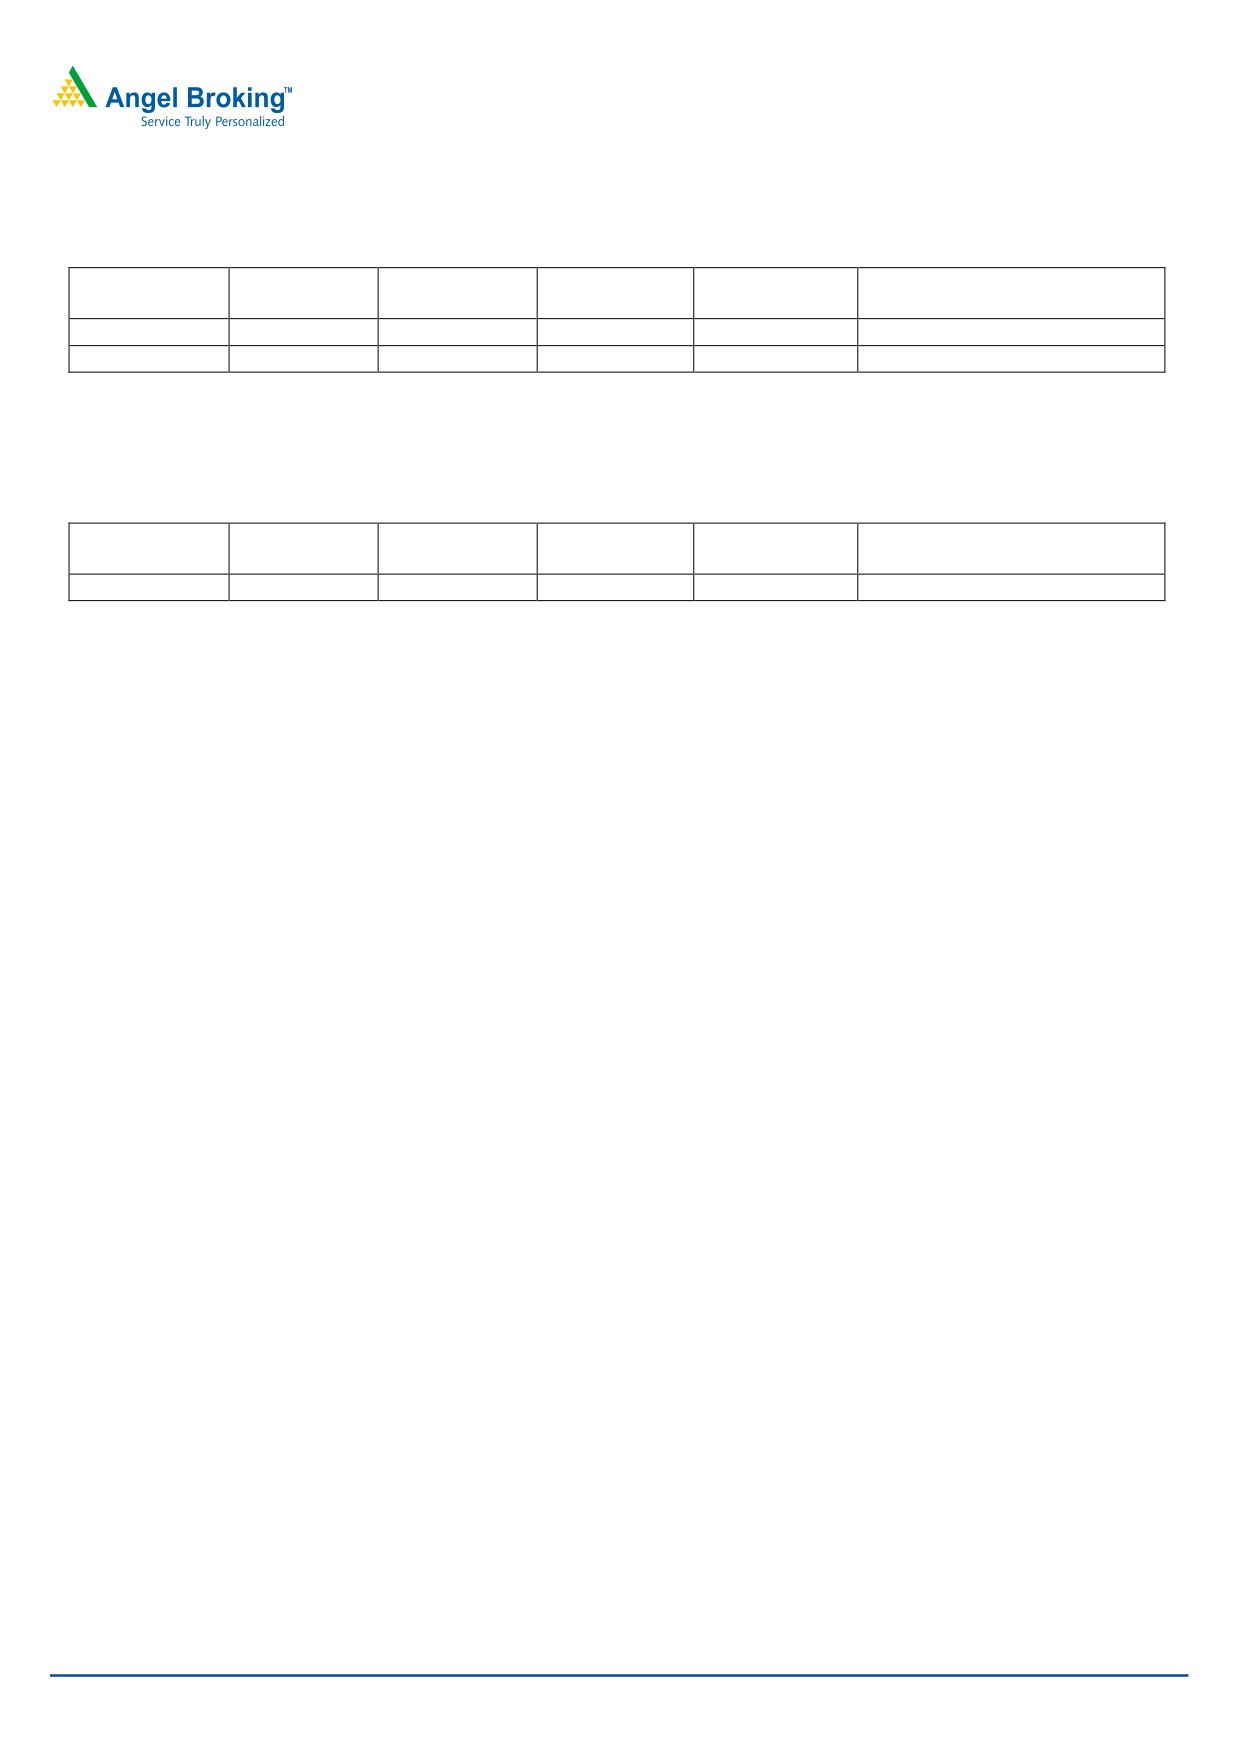
Positive Bias:
Expected
Stock Name
CMP
5 Day EMA
20 Day EMA
Remarks
Target
Ranbaxy
394.55
392.4
419.9
419
View will change below 382
Dabur
97.2
96.7
96.7
100.2
View will change below 95.1
Negative Bias:
Expected
Stock Name
CMP
5 Day EMA
20 Day EMA
Remarks
Target
Bajaj-Auto
1600.65
1634.4
1660.6
1566
View will change above 1626
For Private Circulation Only |
3
Technical Research | December 21, 2011
Daily Pivot Levels for Nifty 50 Stocks
SCRIPS
S2
S1
PIVOT
R1
R2
SENSEX
14,941
15,058
15,253
15,370
15,565
NIFTY
4,465
4,504
4,571
4,611
4,677
BANKNIFTY
7,647
7,723
7,842
7,918
8,038
ACC
1,056
1,079
1,107
1,130
1,158
AMBUJACEM
144
146
151
154
158
AXISBANK
780
800
829
849
878
BAJAJ-AUTO
1,552
1,576
1,619
1,643
1,686
BHARTIARTL
307
315
327
336
348
BHEL
216
222
230
236
244
BPCL
468
484
513
529
557
CAIRN
302
306
311
315
319
CIPLA
322
325
330
334
338
DLF
178
182
187
191
197
DRREDDY
1,541
1,554
1,576
1,590
1,611
GAIL
370
374
379
383
387
HCLTECH
370
380
398
409
426
HDFC
613
618
623
629
634
HDFCBANK
396
405
413
423
431
HEROMOTOCO
1,704
1,757
1,841
1,894
1,978
HINDALCO
113
116
121
124
129
HINDUNILVR
390
393
398
402
406
ICICIBANK
635
644
658
667
680
IDFC
97
99
102
104
106
INFY
2,626
2,647
2,673
2,694
2,720
ITC
197
198
199
201
202
JINDALSTEL
454
467
486
499
517
JPASSOCIAT
49
51
55
57
60
KOTAKBANK
420
432
453
465
485
LT
931
955
994
1,017
1,056
M&M
621
635
647
661
673
MARUTI
899
908
917
926
935
NTPC
149
152
157
160
165
ONGC
246
249
252
256
258
PNB
748
763
786
801
824
POWERGRID
95
96
98
99
101
RANBAXY
375
385
392
402
408
RCOM
58
60
63
65
68
RELCAPITAL
221
227
236
242
250
RELIANCE
689
701
721
734
754
RELINFRA
335
341
349
355
363
RPOWER
67
69
71
73
75
SAIL
74
76
77
79
80
SBIN
1,522
1,550
1,600
1,628
1,677
SESAGOA
140
145
153
158
166
SIEMENS
613
622
635
644
658
STER
85
86
89
91
93
SUNPHARMA
488
494
504
510
520
SUZLON
17
17
18
18
19
TATAMOTORS
170
172
177
179
183
TATAPOWER
75
78
83
86
91
TATASTEEL
324
333
350
359
376
TCS
1,115
1,124
1,138
1,147
1,160
WIPRO
383
390
398
405
413
Technical Research Team
For Private Circulation Only |
4
Technical Report
RESEARCH TEAM
Shardul Kulkarni
Head - Technicals
Sameet Chavan
Technical Analyst
Sacchitanand Uttekar
Technical Analyst
Mehul Kothari
Technical Analyst
Ankur Lakhotia
Technical Analyst
Research Team: 022-3952 6600
DISCLAIMER: This document is not for public distribution and has been furnished to you solely for your information and must not
be reproduced or redistributed to any other person. Persons into whose possession this document may come are required to observe
these restrictions.
Opinion expressed is our current opinion as of the date appearing on this material only. While we endeavor to update on a
reasonable basis the information discussed in this material, there may be regulatory, compliance, or other reasons that prevent us
from doing so. Prospective investors and others are cautioned that any forward-looking statements are not predictions and may be
subject to change without notice. Our proprietary trading and investment businesses may make investment decisions that are
inconsistent with the recommendations expressed herein.
The information in this document has been printed on the basis of publicly available information, internal data and other reliable
sources believed to be true and are for general guidance only. While every effort is made to ensure the accuracy and completeness of
information contained, the company takes no guarantee and assumes no liability for any errors or omissions of the information. No
one can use the information as the basis for any claim, demand or cause of action.
Recipients of this material should rely on their own investigations and take their own professional advice. Each recipient of this
document should make such investigations as it deems necessary to arrive at an independent evaluation of an investment in the
securities of companies referred to in this document (including the merits and risks involved), and should consult their own advisors to
determine the merits and risks of such an investment. Price and value of the investments referred to in this material may go up or
down. Past performance is not a guide for future performance. Certain transactions - futures, options and other derivatives as well as
non-investment grade securities - involve substantial risks and are not suitable for all investors. Reports based on technical analysis
centers on studying charts of a stock's price movement and trading volume, as opposed to focusing on a company's fundamentals
and as such, may not match with a report on a company's fundamentals.
We do not undertake to advise you as to any change of our views expressed in this document. While we would endeavor to update
the information herein on a reasonable basis, Angel Broking, its subsidiaries and associated companies, their directors and
employees are under no obligation to update or keep the information current. Also there may be regulatory, compliance, or other
reasons that may prevent Angel Broking and affiliates from doing so. Prospective investors and others are cautioned that any
forward-looking statements are not predictions and may be subject to change without notice.
Angel Broking Limited and affiliates, including the analyst who has issued this report, may, on the date of this report, and from time
to time, have long or short positions in, and buy or sell the securities of the companies mentioned herein or engage in any other
transaction involving such securities and earn brokerage or compensation or act as advisor or have other potential conflict of interest
with respect to company/ies mentioned herein or inconsistent with any recommendation and related information and opinions.
Angel Broking Limited and affiliates may seek to provide or have engaged in providing corporate finance, investment banking or
other advisory services in a merger or specific transaction to the companies referred to in this report, as on the date of this report or
in the past.
Sebi Registration No : INB 010996539
For Private Circulation Only |