Daily Technical Report
August 21, 2012
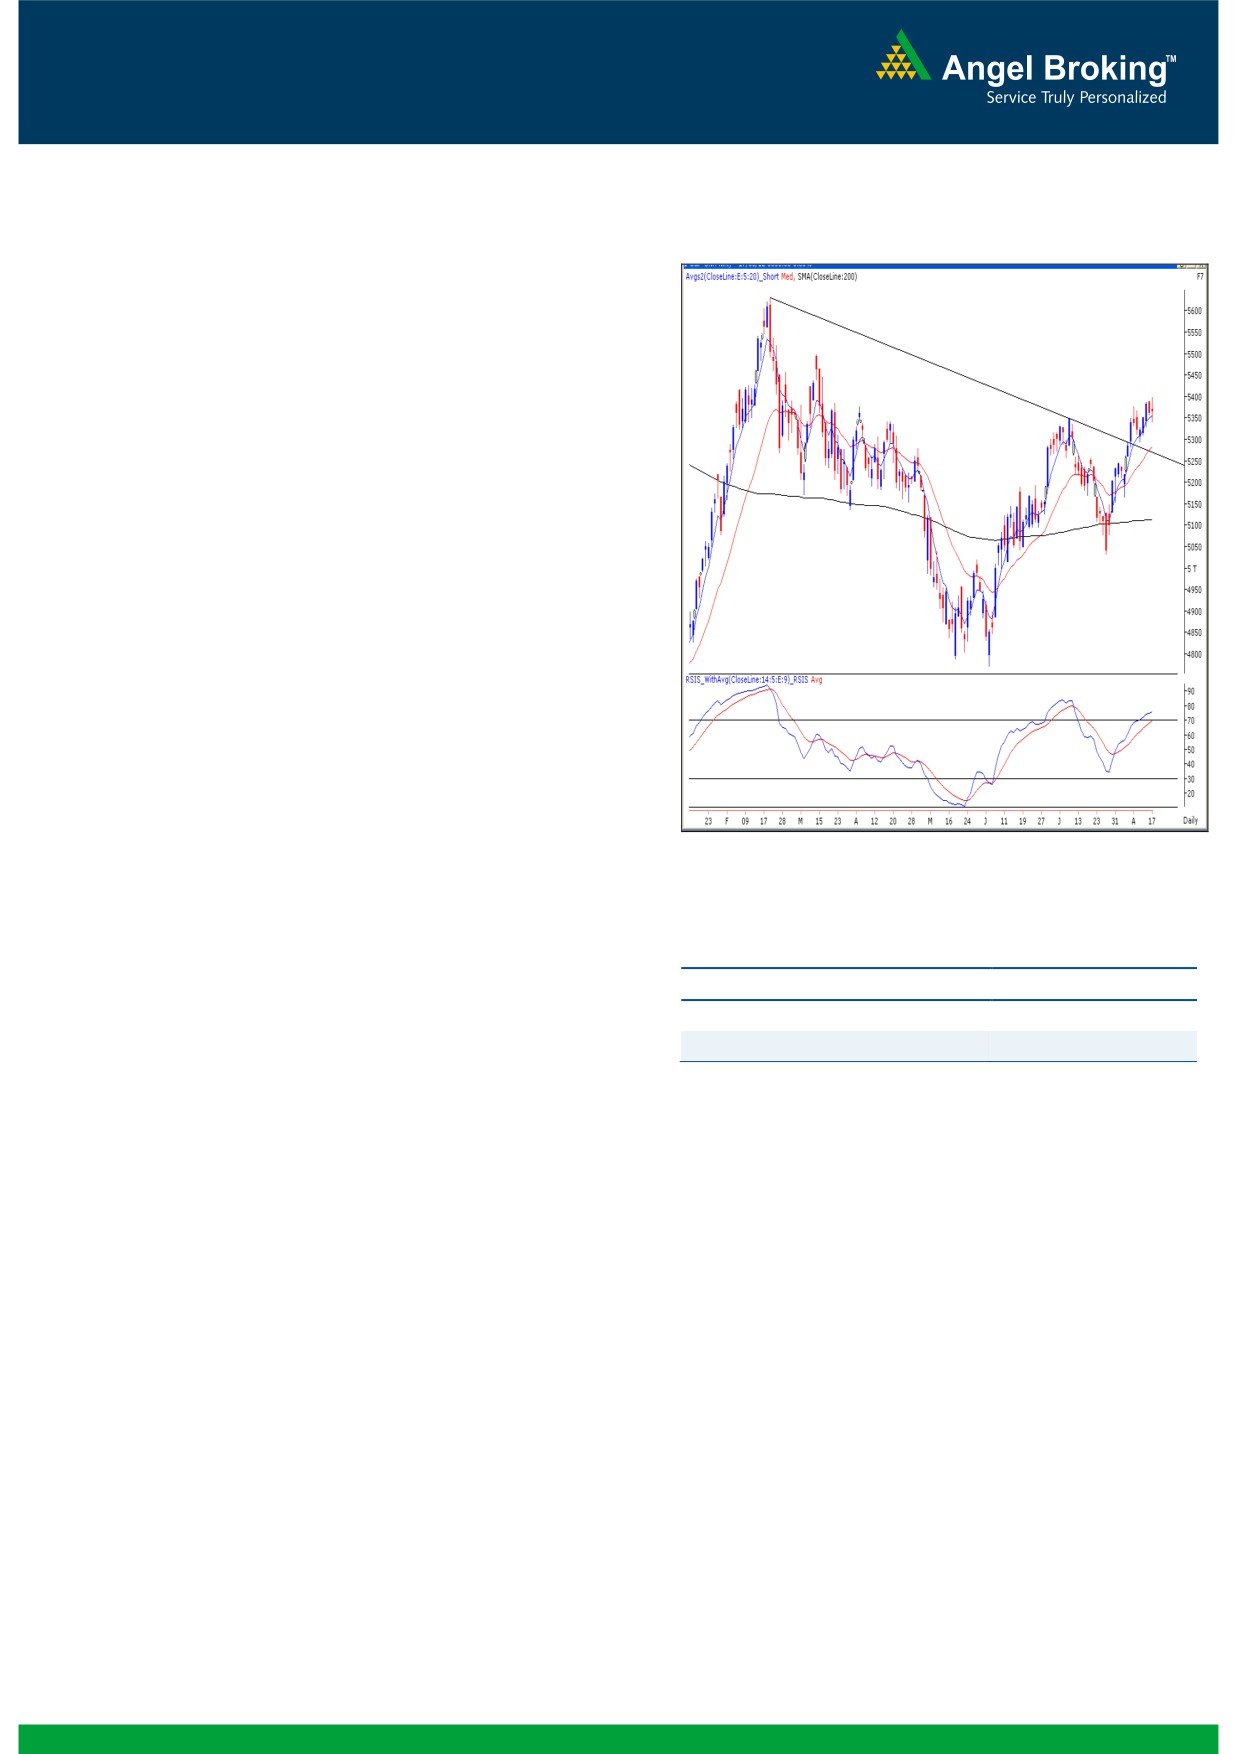
Exhibit 1: Nifty Daily Chart
Sensex (17691) / NIFTY (5366)
On Friday, our benchmark indices closed flat after
CAG reports which were tabled in the Rajya Sabha,
led to loss in early momentum. The Nifty made an
intraday high of 5399.95 but yet again failed to close
above 5400 mark. On sectoral front, FMCG, IT and
TECK counters were among the major gainers,
whereas Realty, Power and Metal counters ended on
the losing side. The advance to decline ratio was in
favor of declining counters (A=1344 D=1498)
Formation
On the weekly chart, the indices have precisely
closed at the “Downward Sloping Trend Line”
resistance near 17802 / 5391 formed by joining
the highs of 21109 / 6339 (November 5, 2010)
- 18524 / 5630 (February 24, 2012).
The ’20-day EMA’ and the ’200-day SMA’ are
placed at 17400 / 5280 and 16900 / 5110
Source: Falcon
levels, respectively.
A weekly closing above 17727 / 5386 level
Actionable points:
would confirm a ‘Higher Top - Higher Bottom’
formation on the weekly chart after August 28,
View
Neutral
2009.
Resistance Levels
5391 - 5425
The candlestick pattern on the daily chart
Support Levels
5329 - 5290
resembles a “Spinning Top” and indicates
uncertainty at current levels.
This may push indices significantly higher to test their
next resistance levels of 17900 - 18050 / 5450 -
Trading strategy:
5500 and the possibility of testing further higher
For the third consecutive week, our benchmark indices
levels cannot be ruled out. At this juncture, the daily
have closed in the positive territory. However, the
chart candlestick pattern depicts a ‘Spinning Top’
formation. This pattern signifies skepticism amongst
‘Higher Top Higher Bottom’ structure in weekly chart
market participants. Hence, unfortunately if markets
is yet to be confirmed as our markets struggle to
sustain below Friday’s low of 17622 / 5356 level,
decisively cross and close above the 17727 / 5386
then we may witness a sideways corrective price
level. Going forward, we continue to maintain our
action in coming trading sessions. In this case,
view that bulls should wait for a closing above 17727
indices may test 17471 / 5294 level. A breach of
/ 5386 level to aggressively create long positions. This
17471 / 5294 will indicate complete loss of current
would also confirm a breakout from the “Downward
positive momentum and our benchmark indices may
Sloping Trend Line” formed by joining the highs of
drift towards 17313 - 17208 / 5260 - 5220.
21109 / 6339 (November 5, 2010) - 18524 / 5630
(February 24, 2012). Strong buying by the bulls is
expected once markets close above 17727 / 5386.
1
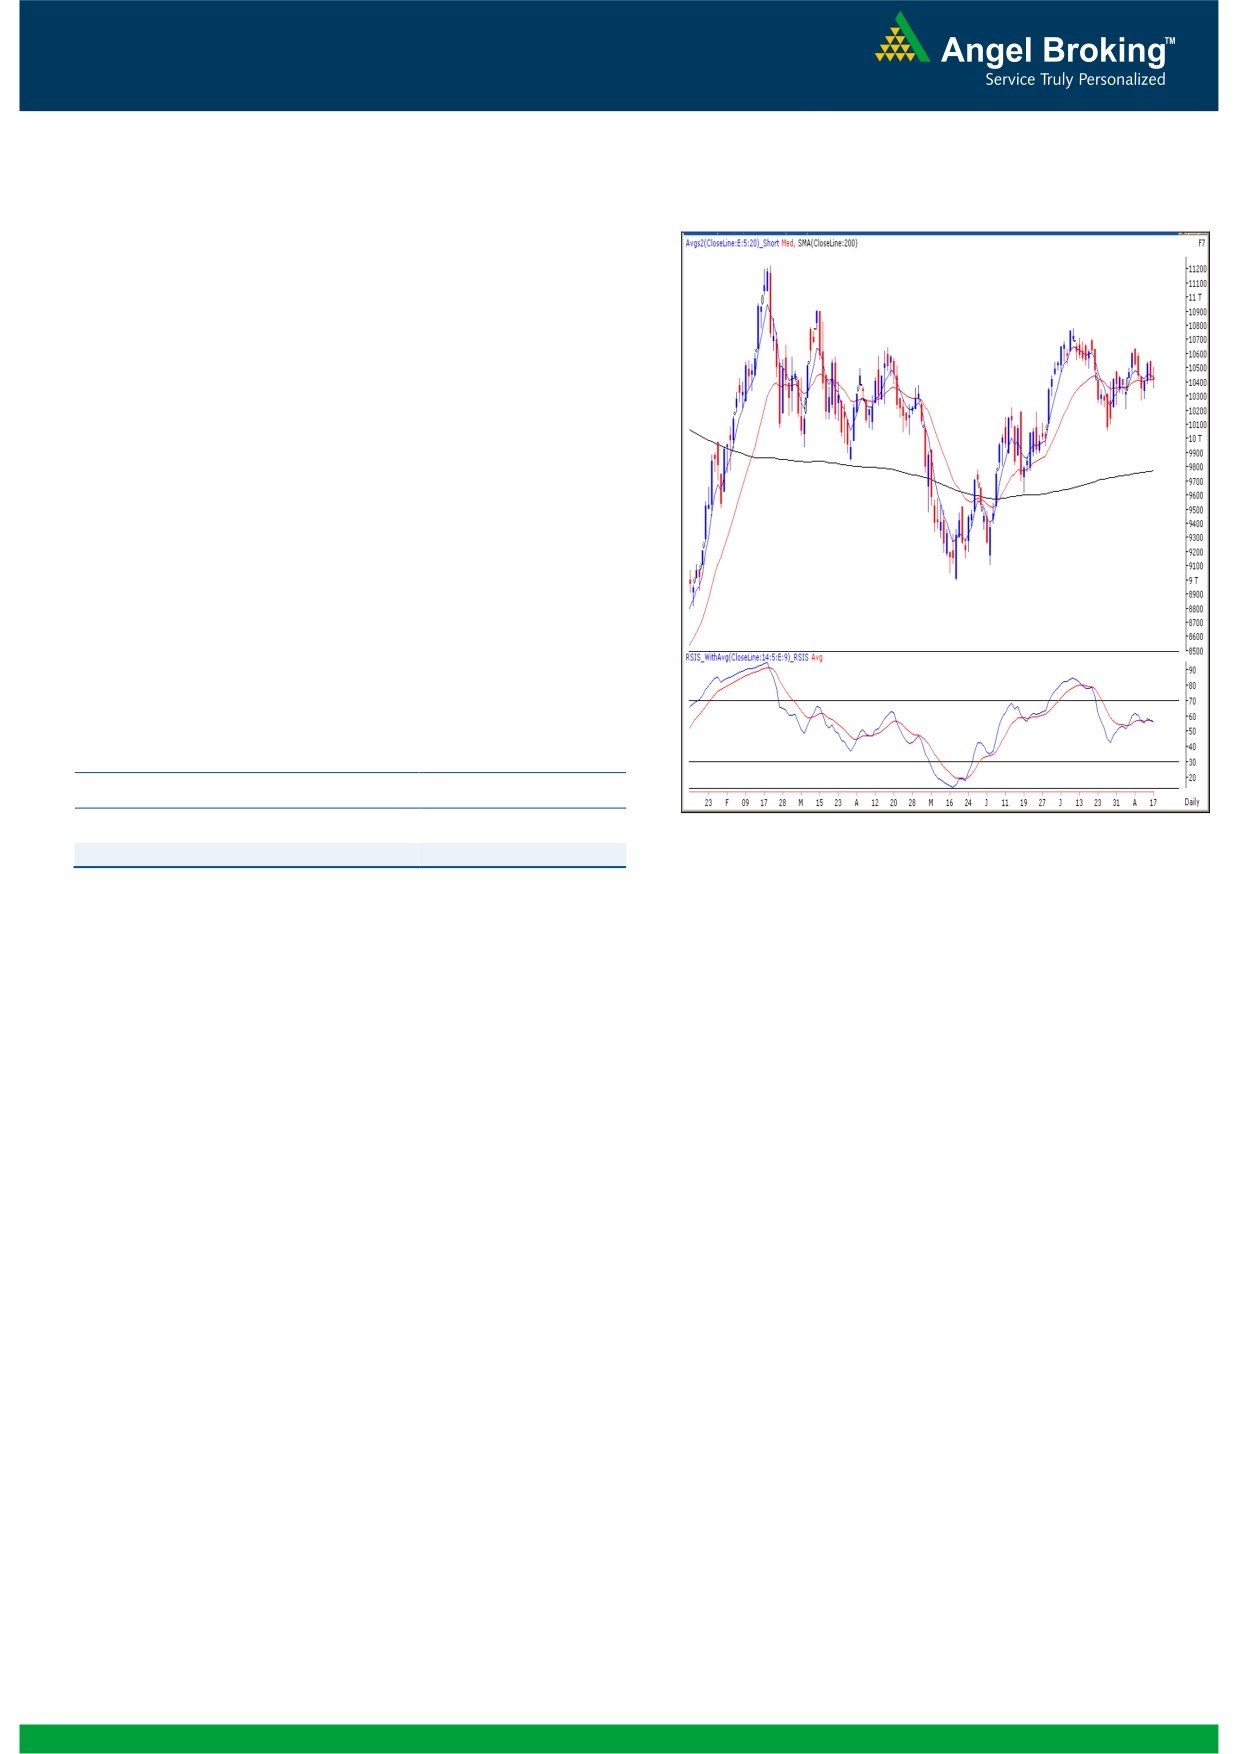
Daily Technical Report
August 21, 2012
Exhibit 2: Bank Nifty Daily Chart
Bank Nifty Outlook - (10418)
Once again on Friday, we saw range bound activity in
the Bank Nifty in line with the broader markets where
the index closed near the initial opening level. At this
juncture, we are not witnessing any major changes in
price pattern on the daily chart of the index. Hence,
we reiterate our view that going forward, the Bank
Nifty is expected to trade in mentioned range of
10240 - 10622. Within the range, if Bank Nifty
sustains below Friday’s low of
10355, then the
negative momentum is likely to increase further and in
this scenario, the support level of 10240 may be
tested. Conversely, 10506 - 10551 - 10641 levels
would act as intermediate resistance levels for Bank
Nifty.
Actionable points:
View
Neutral
Resistance Levels
10506- 10551 - 10641
Source: Falcon
Support Levels
10355 - 10240
2
Daily Technical Report
August 21, 2012
Daily Pivot Levels for Nifty 50 Stocks
SCRIPS
S2
S1
PIVOT
R1
R2
SENSEX
17,526
17,609
17,705
17,787
17,884
NIFTY
5,311
5,339
5,369
5,397
5,428
BANKNIFTY
10,275
10,346
10,426
10,498
10,577
ACC
1,310
1,318
1,328
1,336
1,347
AMBUJACEM
183
186
190
193
197
ASIANPAINT
3,623
3,651
3,691
3,718
3,758
AXISBANK
1,092
1,101
1,111
1,120
1,131
BAJAJ-AUTO
1,668
1,682
1,694
1,708
1,720
BANKBARODA
626
631
638
644
650
BHARTIARTL
257
259
262
265
268
BHEL
224
227
230
232
235
BPCL
333
337
342
346
351
CAIRN
327
331
335
339
343
CIPLA
349
352
355
358
362
COALINDIA
344
347
352
355
359
DLF
202
205
211
214
219
DRREDDY
1,627
1,648
1,664
1,685
1,701
GAIL
352
356
363
368
375
GRASIM
2,981
3,001
3,017
3,037
3,053
HCLTECH
553
555
557
560
562
HDFC
706
710
714
718
723
HDFCBANK
586
591
596
601
607
HEROMOTOCO
1,914
1,924
1,936
1,946
1,958
HINDALCO
110
112
115
116
119
HINDUNILVR
489
496
501
508
513
ICICIBANK
944
953
961
970
978
IDFC
138
139
142
143
145
INFY
2,302
2,327
2,341
2,365
2,379
ITC
256
259
261
264
267
JINDALSTEL
381
391
409
419
436
JPASSOCIAT
73
74
75
77
78
KOTAKBANK
580
585
589
594
599
LT
1,424
1,438
1,460
1,474
1,496
M&M
751
760
769
779
788
MARUTI
1,158
1,168
1,181
1,191
1,205
NTPC
165
166
169
170
173
ONGC
277
279
283
285
289
PNB
717
722
729
735
742
POWERGRID
114
116
118
120
123
RANBAXY
503
510
515
521
527
RELIANCE
802
809
817
824
832
RELINFRA
489
500
518
529
547
SAIL
81
82
84
85
86
SBIN
1,864
1,881
1,899
1,915
1,934
SESAGOA
182
185
188
190
194
SIEMENS
648
653
658
664
669
STER
106
108
110
111
113
SUNPHARMA
653
657
662
667
672
TATAMOTORS
233
237
240
243
247
TATAPOWER
90
94
98
102
106
TATASTEEL
386
391
396
400
406
TCS
1,255
1,267
1,276
1,287
1,296
WIPRO
344
349
352
357
360
3
Daily Technical Report
August 21, 2012
Research Team Tel: 022 - 39357800
DISCLAIMER
This document is solely for the personal information of the recipient, and must not be singularly used as the basis of any investment
decision. Nothing in this document should be construed as investment or financial advice. Each recipient of this document should make
such investigations as they deem necessary to arrive at an independent evaluation of an investment in the securities of the companies
referred to in this document (including the merits and risks involved), and should consult their own advisors to determine the merits and
risks of such an investment.
Angel Broking Limited, its affiliates, directors, its proprietary trading and investment businesses may, from time to time, make
investment decisions that are inconsistent with or contradictory to the recommendations expressed herein. The views contained in this
document are those of the analyst, and the company may or may not subscribe to all the views expressed within.
Reports based on technical and derivative analysis center on studying charts of a stock's price movement, outstanding positions and
trading volume, as opposed to focusing on a company's fundamentals and, as such, may not match with a report on a company's
fundamentals.
The information in this document has been printed on the basis of publicly available information, internal data and other reliable
sources believed to be true, but we do not represent that it is accurate or complete and it should not be relied on as such, as this
document is for general guidance only. Angel Broking Limited or any of its affiliates/ group companies shall not be in any way
responsible for any loss or damage that may arise to any person from any inadvertent error in the information contained in this report.
Angel Broking Limited has not independently verified all the information contained within this document. Accordingly, we cannot testify,
nor make any representation or warranty, express or implied, to the accuracy, contents or data contained within this document. While
Angel Broking Limited endeavours to update on a reasonable basis the information discussed in this material, there may be regulatory,
compliance, or other reasons that prevent us from doing so.
This document is being supplied to you solely for your information, and its contents, information or data may not be reproduced,
redistributed or passed on, directly or indirectly.
Angel Broking Limited and its affiliates may seek to provide or have engaged in providing corporate finance, investment banking or
other advisory services in a merger or specific transaction to the companies referred to in this report, as on the date of this report or in
the past.
Neither Angel Broking Limited, nor its directors, employees or affiliates shall be liable for any loss or damage that may arise from or in
connection with the use of this information.
Note: Please refer to the important `Stock Holding Disclosure' report on the Angel website (Research Section). Also, please refer to the
latest update on respective stocks for the disclosure status in respect of those stocks. Angel Broking Limited and its affiliates may have
investment positions in the stocks recommended in this report.
Research Team
Shardul Kulkarni
-
Head - Technicals
Sameet Chavan
-
Technical Analyst
Sacchitanand Uttekar
-
Technical Analyst
Mehul Kothari
-
Technical Analyst
Ankur Lakhotia
-
Technical Analyst
Angel Broking Pvt. Ltd.
Registered Office: G-1, Ackruti Trade Centre, Rd. No. 7, MIDC, Andheri (E), Mumbai - 400 093.
Corporate Office: 6th Floor, Ackruti Star, MIDC, Andheri (E), Mumbai - 400 093. Tel: (022) 3952 6600
Sebi Registration No: INB 010996539
4