Technical Research | March 21, 2012
Daily Technical Report
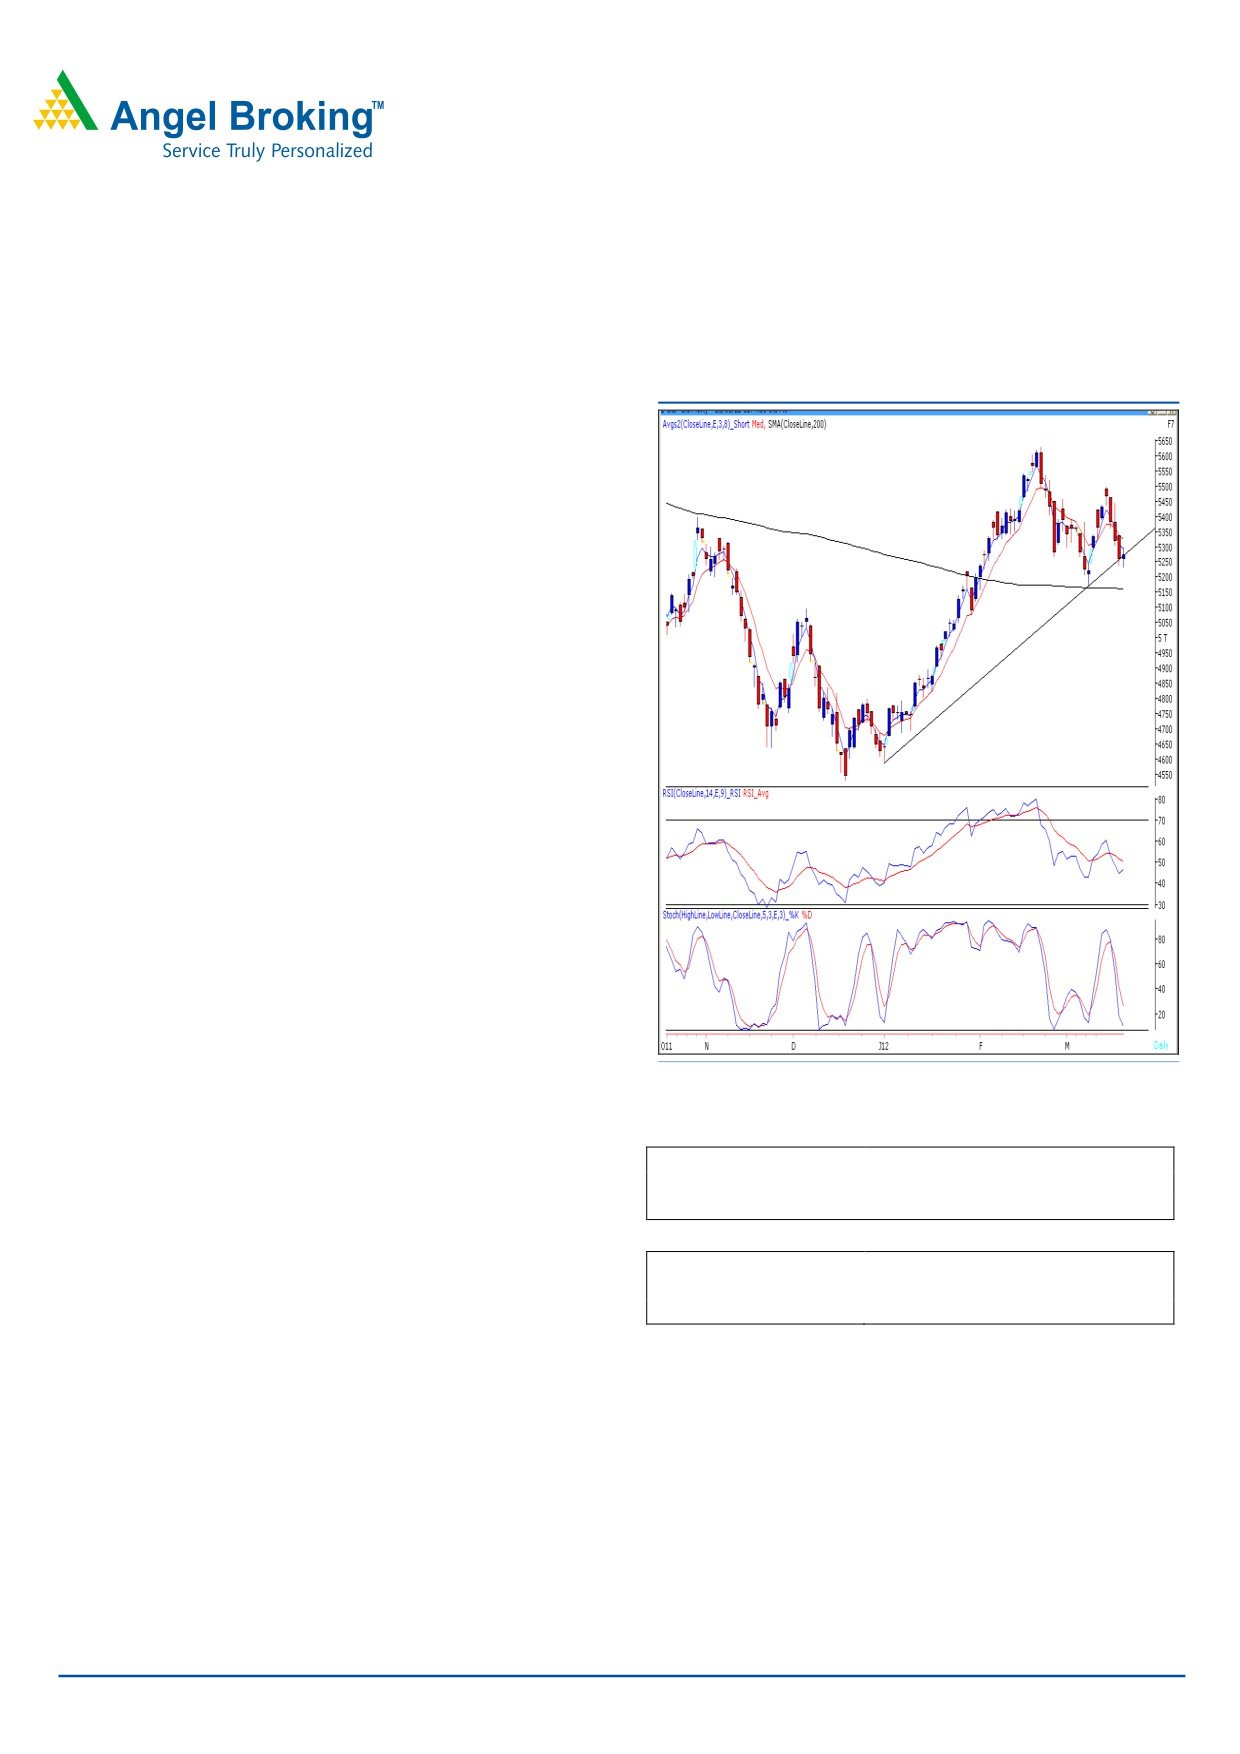
Sensex (17316) / NIFTY (5275)
Exhibit 1: Nifty Daily Chart
Yesterday, once again markets opened on a flat note and
traded in a narrow range throughout the day. Selling
pressure was seen around noon which dragged indices
lower to test Monday’s low. However, buying emerged near
this level and indices closed marginally in the positive
territory. On the sectoral front, Consumer Durables, Realty
and FMCG counters were among the major gainers,
whereas Auto sector remained under pressure during
yesterday’s session. The advance to decline ratio was in
favor of declining counters. (A=1340 D=1536) (Source -
Formation:
• The 200-day SMA (Simple Moving Average) and 20-
day EMA (Exponential Moving Average) have now shifted to
17164 / 5163 and 17575 / 5344, respectively.
• The daily chart exhibits the formation of a “Bullish
Harami” candlestick pattern.
• The Daily momentum oscillators and “3 & 8 EMA” are
negatively poised.
• Indices have closed around the “Upward Sloping Trend
Source: Falcon
Line” level of 17250 / 5255.
Actionable points:
Trading strategy:
View
Positive Above 5297
Markets traded in a narrow range of 17410 to 17211 /
Expected Targets
5341 - 5390
5297 to 5233 throughout the day. Eventually, we witnessed
Support Level
5233
a closing marginally above the “Upward Sloping Trend
Line” level of 17250 / 5255. Moreover, the formation of the
View
Negative Below 5233
Expected Targets
5188 - 5163
Bullish Harami candlestick pattern is seen on the charts
Resistance Level
5297
near this support level. (Pattern is largely prominent in the
Sensex than the Nifty). Going forward, a sustainable move
above 17410 / 5297 level may push indices higher to
17562 - 17623 / 5341 - 5390 levels. On the flip side, the
negative momentum is likely to resume only if indices
manage to sustain below yesterday’s low of 17211 / 5233.
In this scenario, the selling pressure may increase further
which can drag indices lower to test strong support zone of
17164 - 17150 / 5188 - 5163.
For Private Circulation Only |
1
Technical Research | March 21, 2012
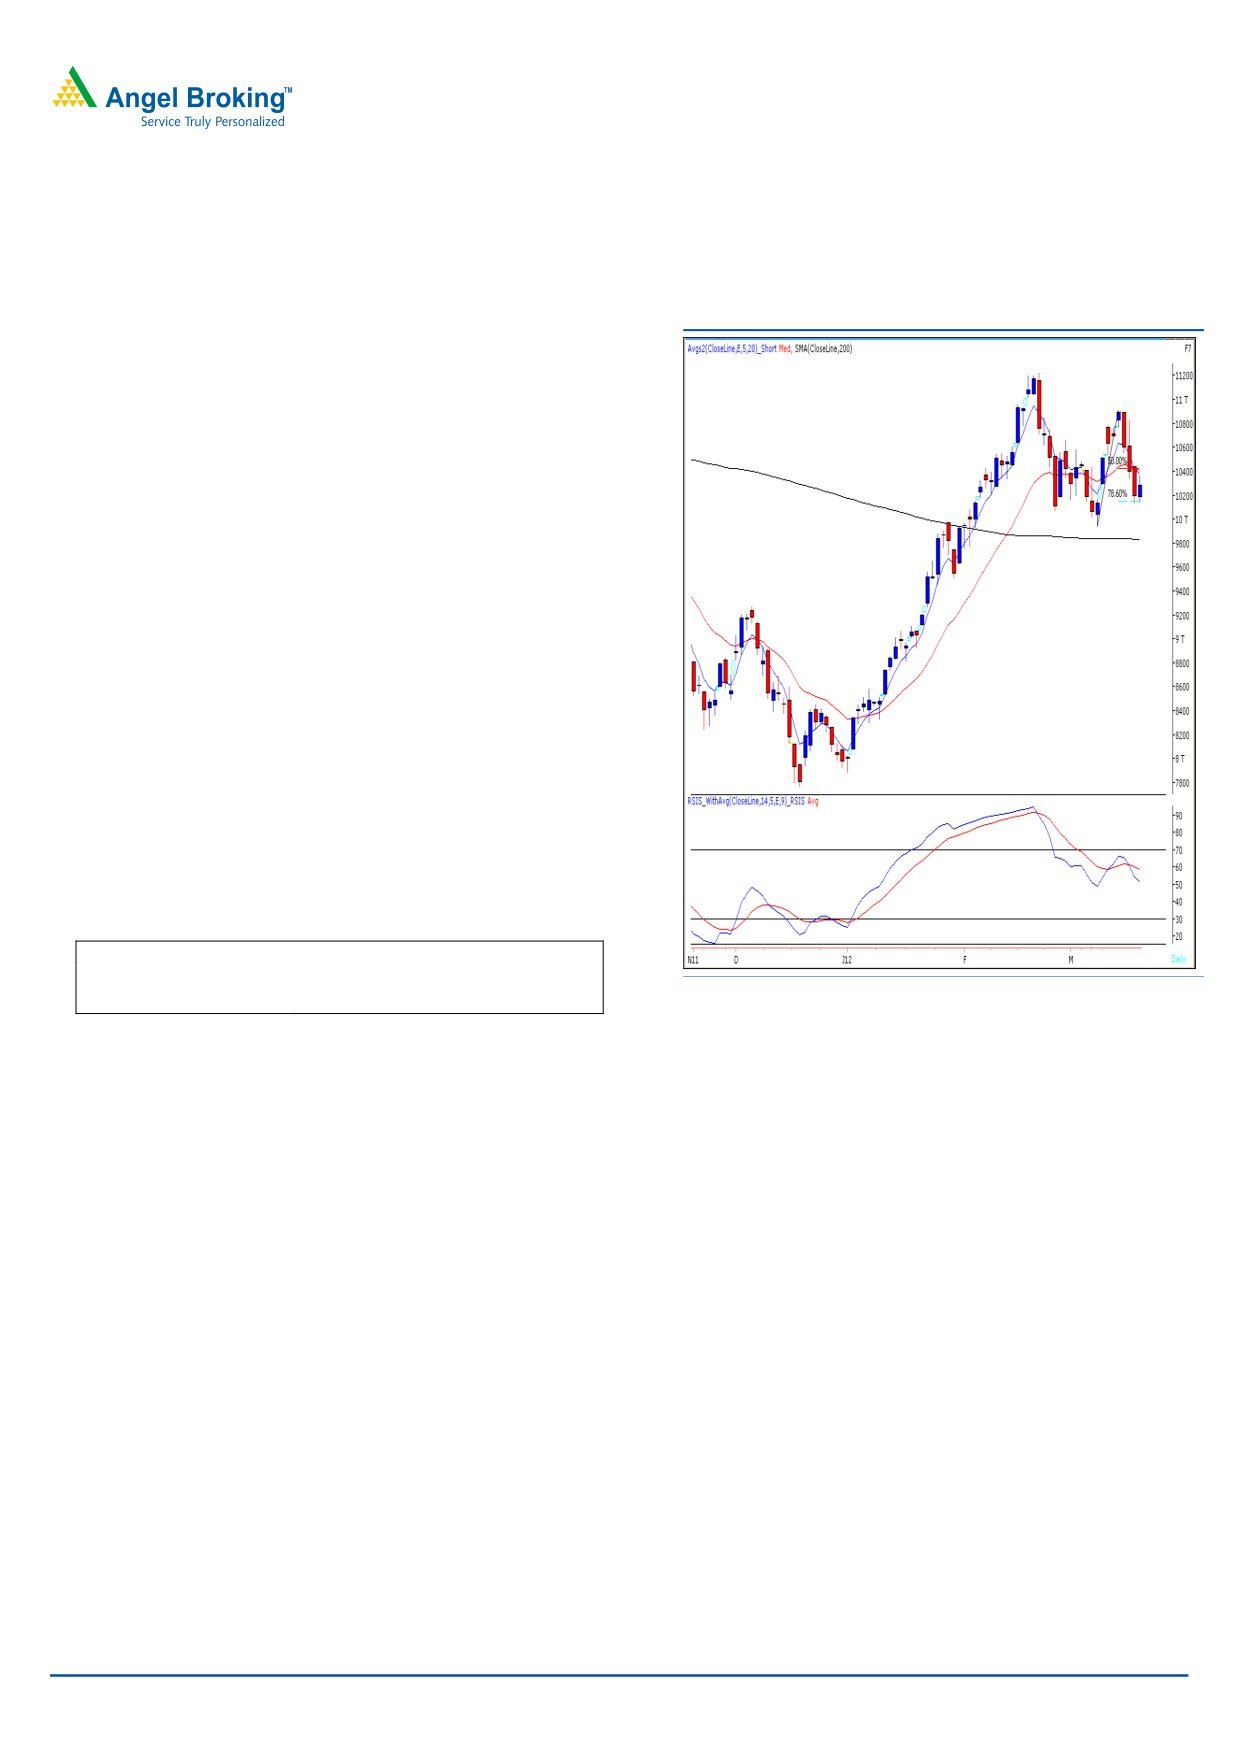
Bank Nifty Outlook - (10282)
Exhibit 2: Bank Nifty Daily Chart
Yesterday, Bank Nifty opened on a flat note and traded
with extreme volatility throughout the session. We had
mentioned in our previous report that the momentum
oscillators on the hourly chart are in an oversold
condition and a bounce back is likely. The index has
taken support near the mentioned support level of
10135. We are witnessing a “Tweezer Bottom” pattern
formation near 78.6% retracement of the rise from March
7,
2012 - March 14, 2012. The said pattern will be
confirmed if the index sustains above yesterday’s high of
10369. In this case the index may rally towards 10441 -
10556 levels. However, it must be noted that the negative
crossover in “RSI - Smoothened” oscillator on daily chart
is still intact. On the downside a fall and close below the
10135 support level will negate the bullish “Tweezer
Bottom” pattern and may drag the index to test 9939.
Actionable points:
View
Positive Above 10369
Expected Target
10441 - 10556
Source: Falcon
Support Levels
10135
For Private Circulation Only |
2
Technical Research | March 21, 2012
Positive Bias:
Positive
Expected
Stock Name
CMP
5 Day EMA
20 Day EMA
Remarks
Above
Target
View will change below
LIC Housing
255.3
251.7
251.8
257.7
264
251.5
Kotak
View will change below
Mahindra
539
544.5
550.7
541.6
555
531
Bank
For Private Circulation Only |
3
Technical Research | March 21, 2012
Daily Pivot Levels for Nifty 50 Stocks
SCRIPS
S2
S1
PIVOT
R1
R2
SENSEX
17,114
17,215
17,313
17,414
17,511
NIFTY
5,204
5,240
5,268
5,304
5,333
BANKNIFTY
10,031
10,157
10,263
10,388
10,494
ACC
1,321
1,340
1,359
1,378
1,397
AMBUJACEM
165
167
169
171
172
AXISBANK
1,155
1,171
1,196
1,212
1,237
BAJAJ-AUTO
1,640
1,664
1,690
1,714
1,739
BHARTIARTL
317
320
323
326
329
BHEL
250
256
262
268
273
BPCL
655
670
681
696
708
CAIRN
343
352
358
367
374
CIPLA
299
302
304
308
310
COALINDIA
319
323
329
333
339
DLF
190
193
195
198
200
DRREDDY
1,644
1,660
1,672
1,688
1,701
GAIL
356
360
364
368
372
HCLTECH
478
485
493
500
508
HDFC
645
651
656
662
667
HDFCBANK
485
495
503
513
521
HEROMOTOCO
1,859
1,896
1,927
1,963
1,994
HINDALCO
134
136
140
142
146
HINDUNILVR
389
392
396
399
402
ICICIBANK
888
898
910
920
932
IDFC
130
134
137
142
145
INFY
2,779
2,805
2,829
2,855
2,879
ITC
217
220
222
226
228
JINDALSTEL
572
580
586
594
600
JPASSOCIAT
73
76
77
80
82
KOTAKBANK
514
526
534
546
554
LT
1,258
1,273
1,294
1,309
1,330
M&M
670
678
689
697
707
MARUTI
1,315
1,337
1,350
1,371
1,384
NTPC
167
170
172
175
177
ONGC
269
271
272
274
276
PNB
908
933
949
974
989
POWERGRID
105
106
108
109
110
RANBAXY
391
397
402
408
412
RCOM
88
90
91
93
94
RELIANCE
743
752
759
768
775
RELINFRA
556
575
589
608
622
RPOWER
120
123
125
128
130
SAIL
92
93
94
95
96
SBIN
2,111
2,149
2,176
2,214
2,241
SESAGOA
193
196
200
203
206
SIEMENS
759
772
780
792
801
STER
111
113
115
117
119
SUNPHARMA
551
561
568
578
585
SUZLON
27
27
28
28
28
TATAMOTORS
259
265
276
282
292
TATAPOWER
100
102
103
105
107
TATASTEEL
440
448
452
459
464
TCS
1,108
1,122
1,133
1,147
1,158
WIPRO
423
426
428
432
434
Technical Research Team
For Private Circulation Only |
4
Technical Report
RESEARCH TEAM
Shardul Kulkarni
Head - Technicals
Sameet Chavan
Technical Analyst
Sacchitanand Uttekar
Technical Analyst
Mehul Kothari
Technical Analyst
Ankur Lakhotia
Technical Analyst
Research Team: 022-3952 6600
DISCLAIMER: This document is not for public distribution and has been furnished to you solely for your information and must not
be reproduced or redistributed to any other person. Persons into whose possession this document may come are required to observe
these restrictions.
Opinion expressed is our current opinion as of the date appearing on this material only. While we endeavor to update on a
reasonable basis the information discussed in this material, there may be regulatory, compliance, or other reasons that prevent us
from doing so. Prospective investors and others are cautioned that any forward-looking statements are not predictions and may be
subject to change without notice. Our proprietary trading and investment businesses may make investment decisions that are
inconsistent with the recommendations expressed herein.
The information in this document has been printed on the basis of publicly available information, internal data and other reliable
sources believed to be true and are for general guidance only. While every effort is made to ensure the accuracy and completeness of
information contained, the company takes no guarantee and assumes no liability for any errors or omissions of the information. No
one can use the information as the basis for any claim, demand or cause of action.
Recipients of this material should rely on their own investigations and take their own professional advice. Each recipient of this
document should make such investigations as it deems necessary to arrive at an independent evaluation of an investment in the
securities of companies referred to in this document (including the merits and risks involved), and should consult their own advisors to
determine the merits and risks of such an investment. Price and value of the investments referred to in this material may go up or
down. Past performance is not a guide for future performance. Certain transactions - futures, options and other derivatives as well as
non-investment grade securities - involve substantial risks and are not suitable for all investors. Reports based on technical analysis
centers on studying charts of a stock's price movement and trading volume, as opposed to focusing on a company's fundamentals
and as such, may not match with a report on a company's fundamentals.
We do not undertake to advise you as to any change of our views expressed in this document. While we would endeavor to update
the information herein on a reasonable basis, Angel Broking, its subsidiaries and associated companies, their directors and
employees are under no obligation to update or keep the information current. Also there may be regulatory, compliance, or other
reasons that may prevent Angel Broking and affiliates from doing so. Prospective investors and others are cautioned that any
forward-looking statements are not predictions and may be subject to change without notice.
Angel Broking Limited and affiliates, including the analyst who has issued this report, may, on the date of this report, and from time
to time, have long or short positions in, and buy or sell the securities of the companies mentioned herein or engage in any other
transaction involving such securities and earn brokerage or compensation or act as advisor or have other potential conflict of interest
with respect to company/ies mentioned herein or inconsistent with any recommendation and related information and opinions.
Angel Broking Limited and affiliates may seek to provide or have engaged in providing corporate finance, investment banking or
other advisory services in a merger or specific transaction to the companies referred to in this report, as on the date of this report or
in the past.
Sebi Registration No : INB 010996539
For Private Circulation Only |