Technical Research | February 21, 2012
Daily Technical Report
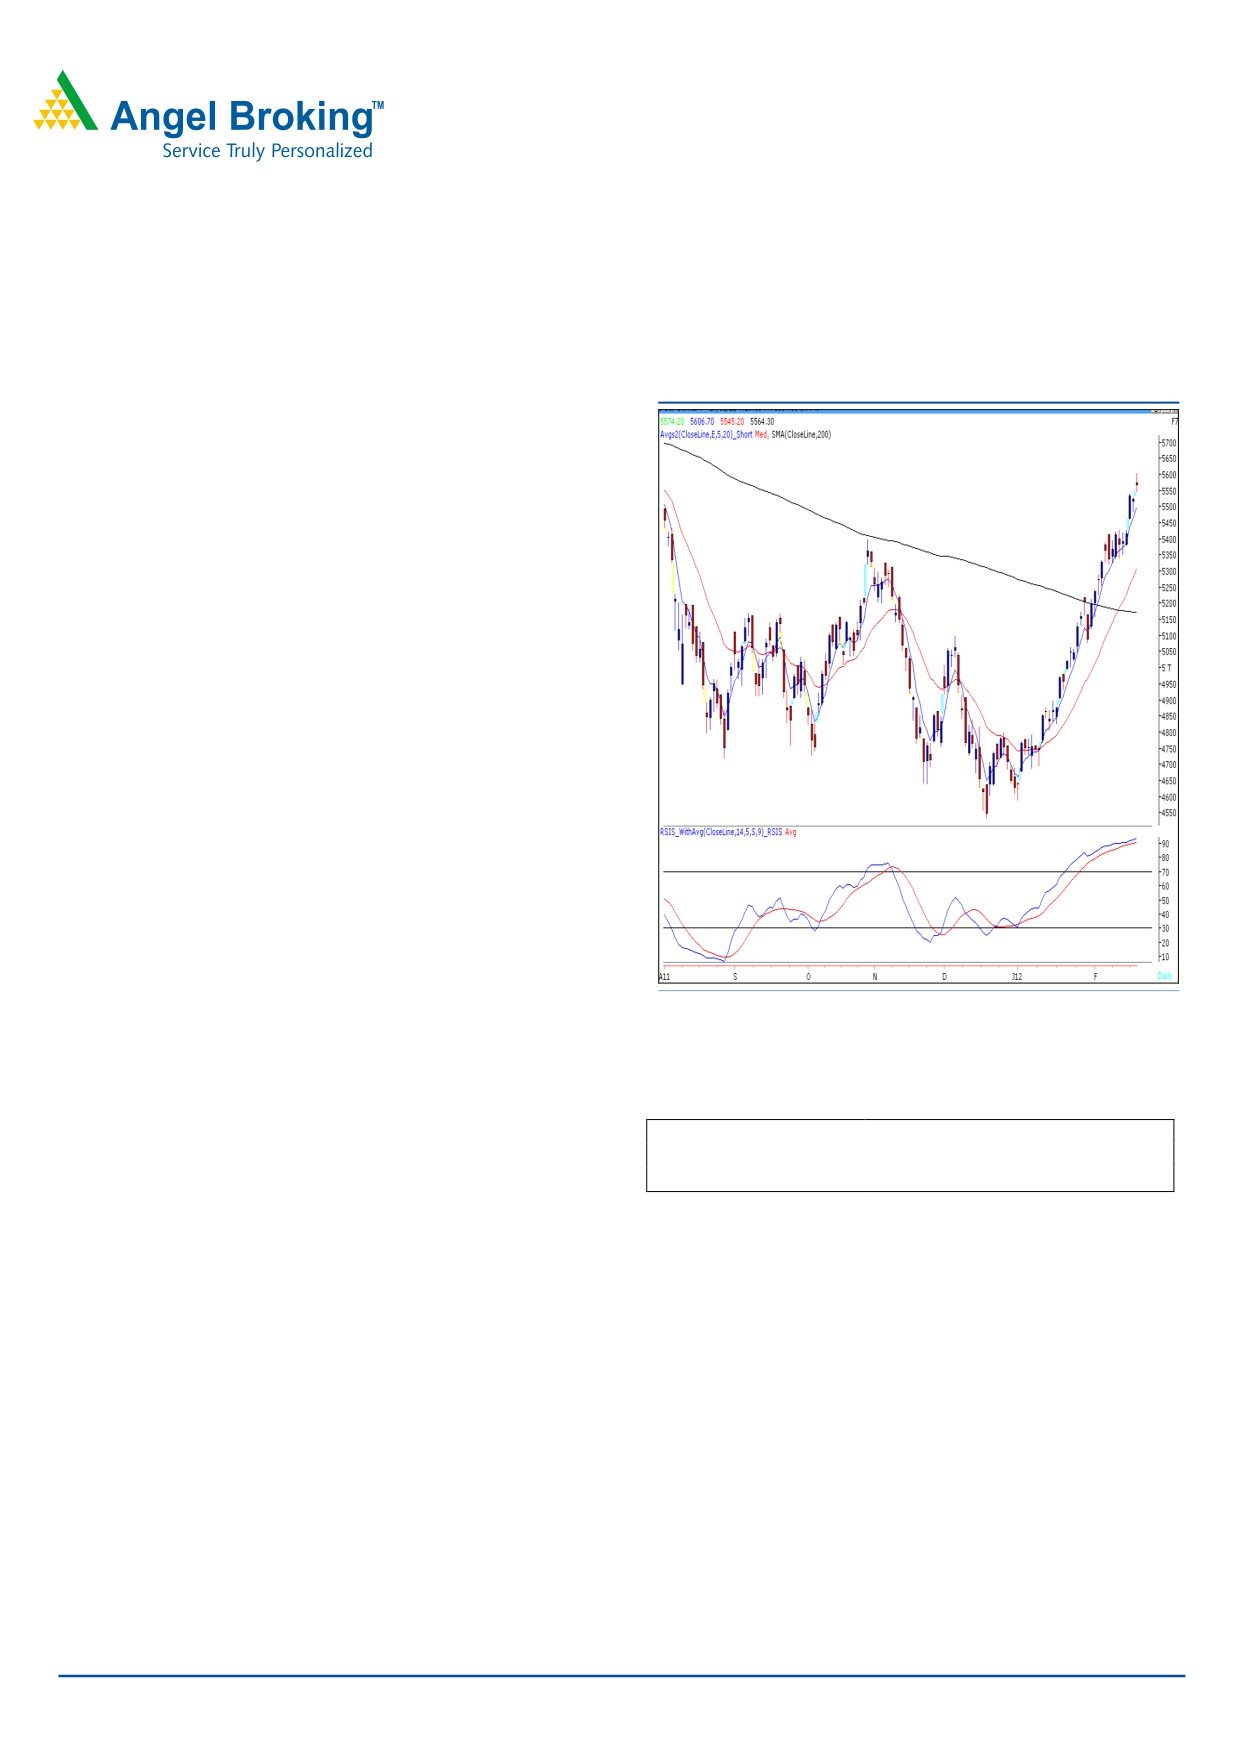
Sensex (18289) / NIFTY (5564)
Exhibit 1: Nifty Daily Chart
On Friday, our Benchmark indices opened with an upside
gap and Nifty tested the psychological level of 5600 during
the initial part of the session. However, due to some profit
booking at higher levels, our indices closed below their
initial opening level. On the sectoral front, Consumer
Durables, Power and Consumer Goods counters were
among the major gainers, whereas Metal and Auto sectors
ended on a losing side. The advance to decline ratio was
marginally in favor of declining counters. (A=1394
Formation:
• On the Weekly chart, indices have closed well above
the “Horizontal Resistance Line” placed at 17908 /
5400 level.
• The 200-day SMA and 20-day EMA have now shifted to
17210 / 5172 and 17522 / 5306, respectively.
• The “RSI-Smoothened” oscillator on the daily chart is
still placed in extreme overbought territory.
Source: Falcon
• The daily chart depicts a “Spinning Top” Japanese
candlestick pattern.
Trading strategy:
Actionable points:
View
Neutral
After a consolidation of nearly seven consecutive sessions,
Resistance levels
5606 - 5645
finally, indices managed to break out from the “Horizontal
Support levels
5545 - 5483
Resistance Line” placed at 17908 / 5400 level. Strong
The said pattern will be negated on a closing above of the
momentum was witnessed almost throughout the week as
high of the “Spinning Top” formation. As a result markets
bulls refused to take the foot off the pedal and relentless
are likely to move higher to test next target of 18756 -
buying from FII's pushed markets higher. We are now
18945 / 5645 - 5702 levels.
observing a “Spinning Top” pattern on the daily chart. This
pattern indicates possibility of some minor consolidation but
Traders are advised to exercise caution in view of the over-
requires a confirmation in the form of a closing below the
bought position of the RSI oscillator and should trade with
low of the pattern i.e. 18234 / 5545. In this scenario, we
strict stop-loss.
may witness a loss of current positive momentum. Hence,
indices may slide towards lower support levels of 18043 -
17627 / 5483 - 5341 levels.
For Private Circulation Only |
1
Technical Research | February 21, 2012
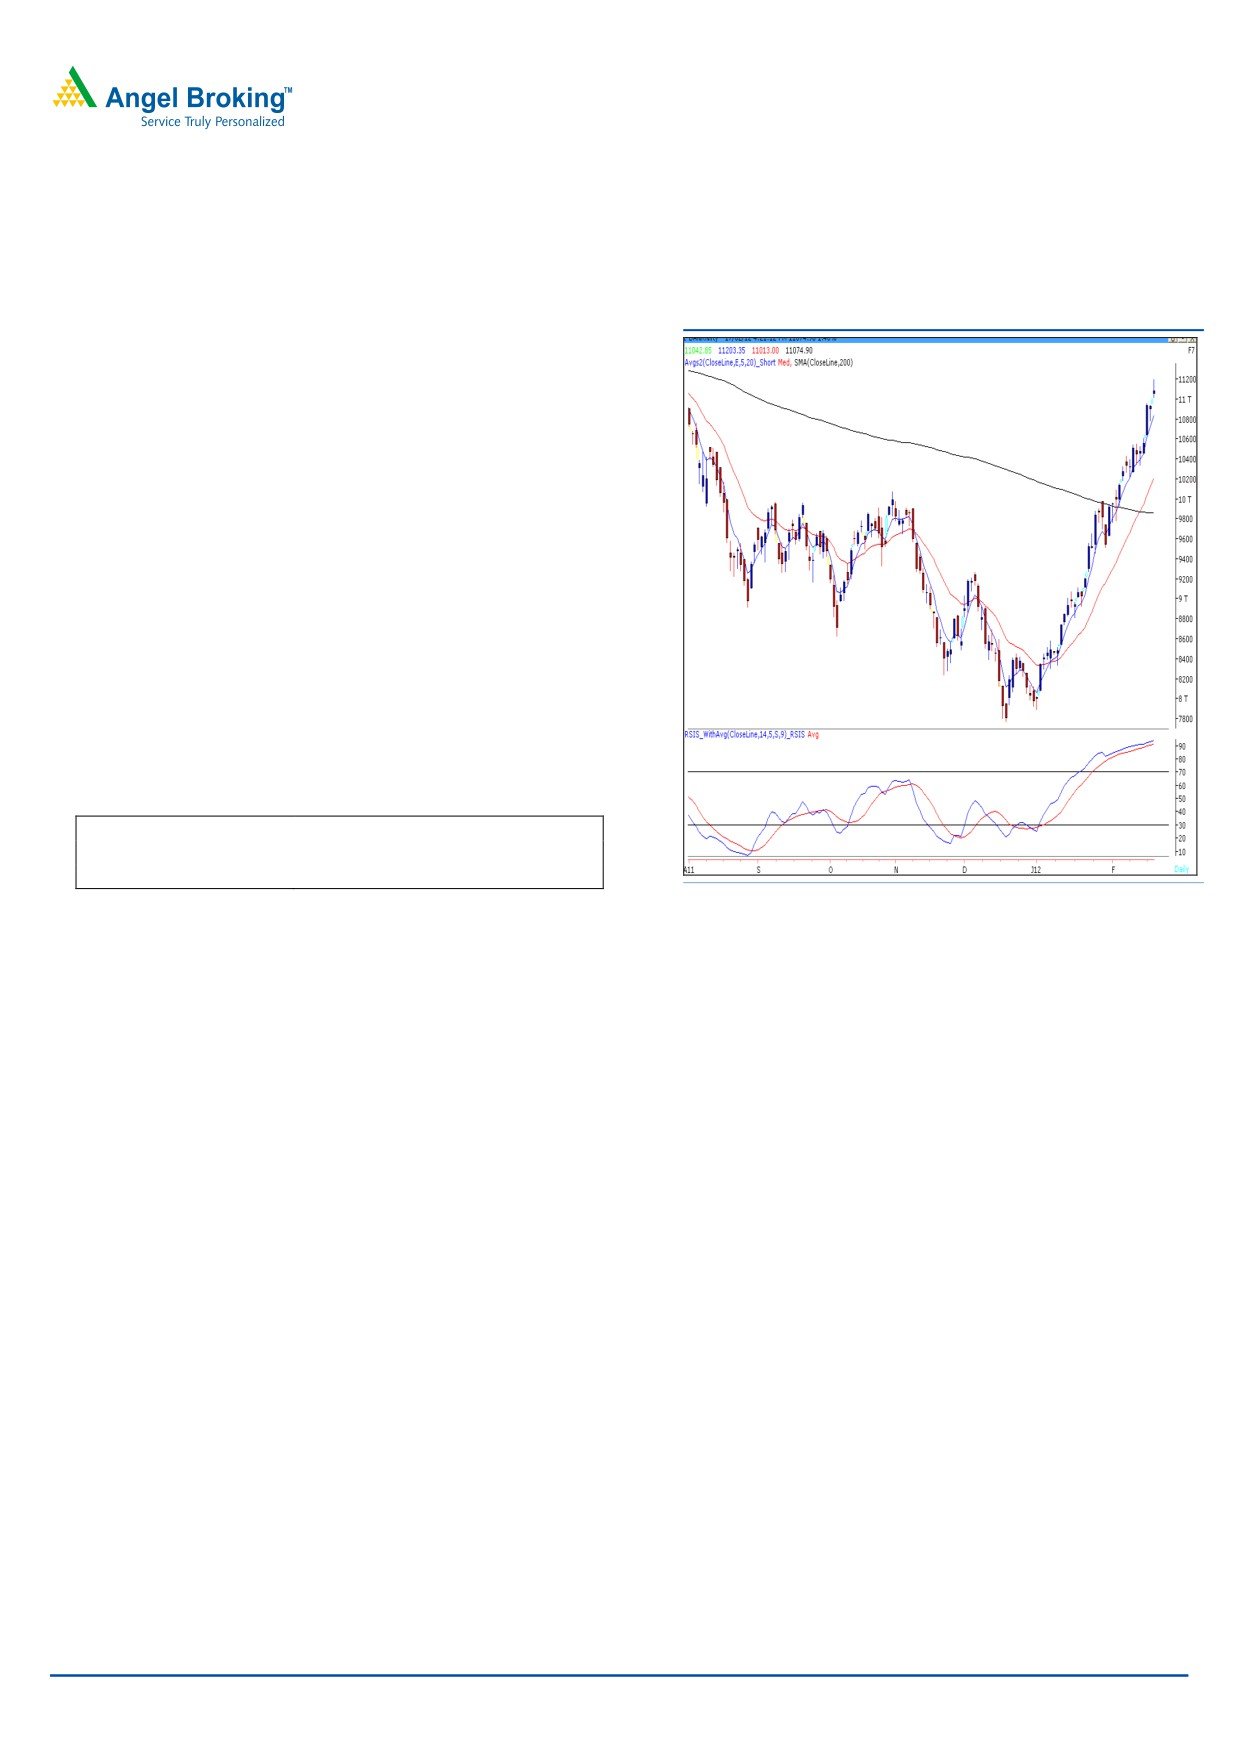
Bank Nifty Outlook - (11075)
Exhibit 2: Bank Nifty Daily Chart
On Friday, Bank Nifty opened with an upside gap and
traded with extreme volatility to close marginally above
the initial opening level. The index has formed a
“Spinning Top” candle stick pattern near
61.8%
Fibonacci retracement of the fall from 12th November
2010 - 23rd December 2011. The pattern indicates
possibility of some consolidation or minor correction,
only if Bank Nifty sustains below Friday’s low of 11013.
In such a scenario the index is likely to test 10938 -
10775 levels. On the upside, a move above the high of
the 'Spinning top' (11204) would result in further positive
momentum and indices may test 11325 - 11450 levels
in coming trading session.
Actionable points:
View
Neutral
Resistance Levels
11204 - 11325 - 11450
Support Levels
11013 - 10938 - 10775
Source: Falcon
For Private Circulation Only |
2
Technical Research | February 21, 2012
Positive Bias:
Expected
Stock Name
CMP
5 Day EMA
20 Day EMA
Remarks
Target
Mphasis
398.7
373.6
353.3
423
View will change below 384
For Private Circulation Only |
3
Technical Research | February 21, 2012
Daily Pivot Levels for Nifty 50 Stocks
SCRIPS
S2
S1
PIVOT
R1
R2
SENSEX
18,126
18,208
18,315
18,397
18,504
NIFTY
5,511
5,537
5,572
5,599
5,634
BANKNIFTY
10,907
10,991
11,097
11,181
11,287
ACC
1,315
1,341
1,363
1,389
1,411
AMBUJACEM
166
170
172
176
178
AXISBANK
1,216
1,247
1,271
1,302
1,326
BAJAJ-AUTO
1,752
1,778
1,802
1,828
1,851
BHARTIARTL
342
346
351
354
359
BHEL
266
285
305
324
344
BPCL
598
609
616
626
634
CAIRN
369
378
387
396
406
CIPLA
314
318
323
327
332
DLF
317
320
326
330
336
DRREDDY
248
251
255
258
263
GAIL
1,603
1,619
1,630
1,646
1,657
HCLTECH
368
374
382
389
397
HDFC
466
479
491
504
516
HDFCBANK
704
710
718
725
733
HEROMOTOCO
514
521
527
534
540
HINDALCO
2,021
2,065
2,138
2,182
2,254
HINDUNILVR
145
148
153
156
161
ICICIBANK
378
382
385
388
392
IDFC
963
972
985
994
1,007
INFY
137
142
152
157
167
ITC
2,864
2,906
2,942
2,984
3,020
JINDALSTEL
202
204
205
207
208
JPASSOCIAT
621
632
648
658
675
KOTAKBANK
80
82
85
87
90
LT
567
571
578
582
589
M&M
1,380
1,414
1,473
1,506
1,565
MARUTI
721
735
744
758
766
NTPC
1,287
1,304
1,335
1,352
1,383
ONGC
182
185
188
191
194
PNB
273
277
284
288
295
POWERGRID
1,046
1,061
1,075
1,091
1,105
RANBAXY
110
111
112
113
115
RCOM
438
444
451
456
464
RELCAPITAL
100
102
105
107
110
RELIANCE
802
810
818
826
834
RELINFRA
572
595
624
647
676
RPOWER
118
122
128
132
138
SAIL
108
110
113
115
118
SBIN
2,327
2,372
2,422
2,467
2,516
SESAGOA
218
231
251
264
284
SIEMENS
771
797
818
843
865
STER
127
130
134
137
142
SUNPHARMA
532
537
542
548
553
SUZLON
27
28
30
31
32
TATAMOTORS
264
269
276
281
289
TATAPOWER
112
115
118
121
124
TATASTEEL
461
469
479
488
498
TCS
1,202
1,215
1,235
1,248
1,268
WIPRO
432
440
447
455
461
Technical Research Team
For Private Circulation Only |
4
Technical Report
RESEARCH TEAM
Shardul Kulkarni
Head - Technicals
Sameet Chavan
Technical Analyst
Sacchitanand Uttekar
Technical Analyst
Mehul Kothari
Technical Analyst
Ankur Lakhotia
Technical Analyst
Research Team: 022-3952 6600
DISCLAIMER: This document is not for public distribution and has been furnished to you solely for your information and must not
be reproduced or redistributed to any other person. Persons into whose possession this document may come are required to observe
these restrictions.
Opinion expressed is our current opinion as of the date appearing on this material only. While we endeavor to update on a
reasonable basis the information discussed in this material, there may be regulatory, compliance, or other reasons that prevent us
from doing so. Prospective investors and others are cautioned that any forward-looking statements are not predictions and may be
subject to change without notice. Our proprietary trading and investment businesses may make investment decisions that are
inconsistent with the recommendations expressed herein.
The information in this document has been printed on the basis of publicly available information, internal data and other reliable
sources believed to be true and are for general guidance only. While every effort is made to ensure the accuracy and completeness of
information contained, the company takes no guarantee and assumes no liability for any errors or omissions of the information. No
one can use the information as the basis for any claim, demand or cause of action.
Recipients of this material should rely on their own investigations and take their own professional advice. Each recipient of this
document should make such investigations as it deems necessary to arrive at an independent evaluation of an investment in the
securities of companies referred to in this document (including the merits and risks involved), and should consult their own advisors to
determine the merits and risks of such an investment. Price and value of the investments referred to in this material may go up or
down. Past performance is not a guide for future performance. Certain transactions - futures, options and other derivatives as well as
non-investment grade securities - involve substantial risks and are not suitable for all investors. Reports based on technical analysis
centers on studying charts of a stock's price movement and trading volume, as opposed to focusing on a company's fundamentals
and as such, may not match with a report on a company's fundamentals.
We do not undertake to advise you as to any change of our views expressed in this document. While we would endeavor to update
the information herein on a reasonable basis, Angel Broking, its subsidiaries and associated companies, their directors and
employees are under no obligation to update or keep the information current. Also there may be regulatory, compliance, or other
reasons that may prevent Angel Broking and affiliates from doing so. Prospective investors and others are cautioned that any
forward-looking statements are not predictions and may be subject to change without notice.
Angel Broking Limited and affiliates, including the analyst who has issued this report, may, on the date of this report, and from time
to time, have long or short positions in, and buy or sell the securities of the companies mentioned herein or engage in any other
transaction involving such securities and earn brokerage or compensation or act as advisor or have other potential conflict of interest
with respect to company/ies mentioned herein or inconsistent with any recommendation and related information and opinions.
Angel Broking Limited and affiliates may seek to provide or have engaged in providing corporate finance, investment banking or
other advisory services in a merger or specific transaction to the companies referred to in this report, as on the date of this report or
in the past.
Sebi Registration No : INB 010996539
For Private Circulation Only |