Technical Research | November 21, 2011
Daily Technical Report
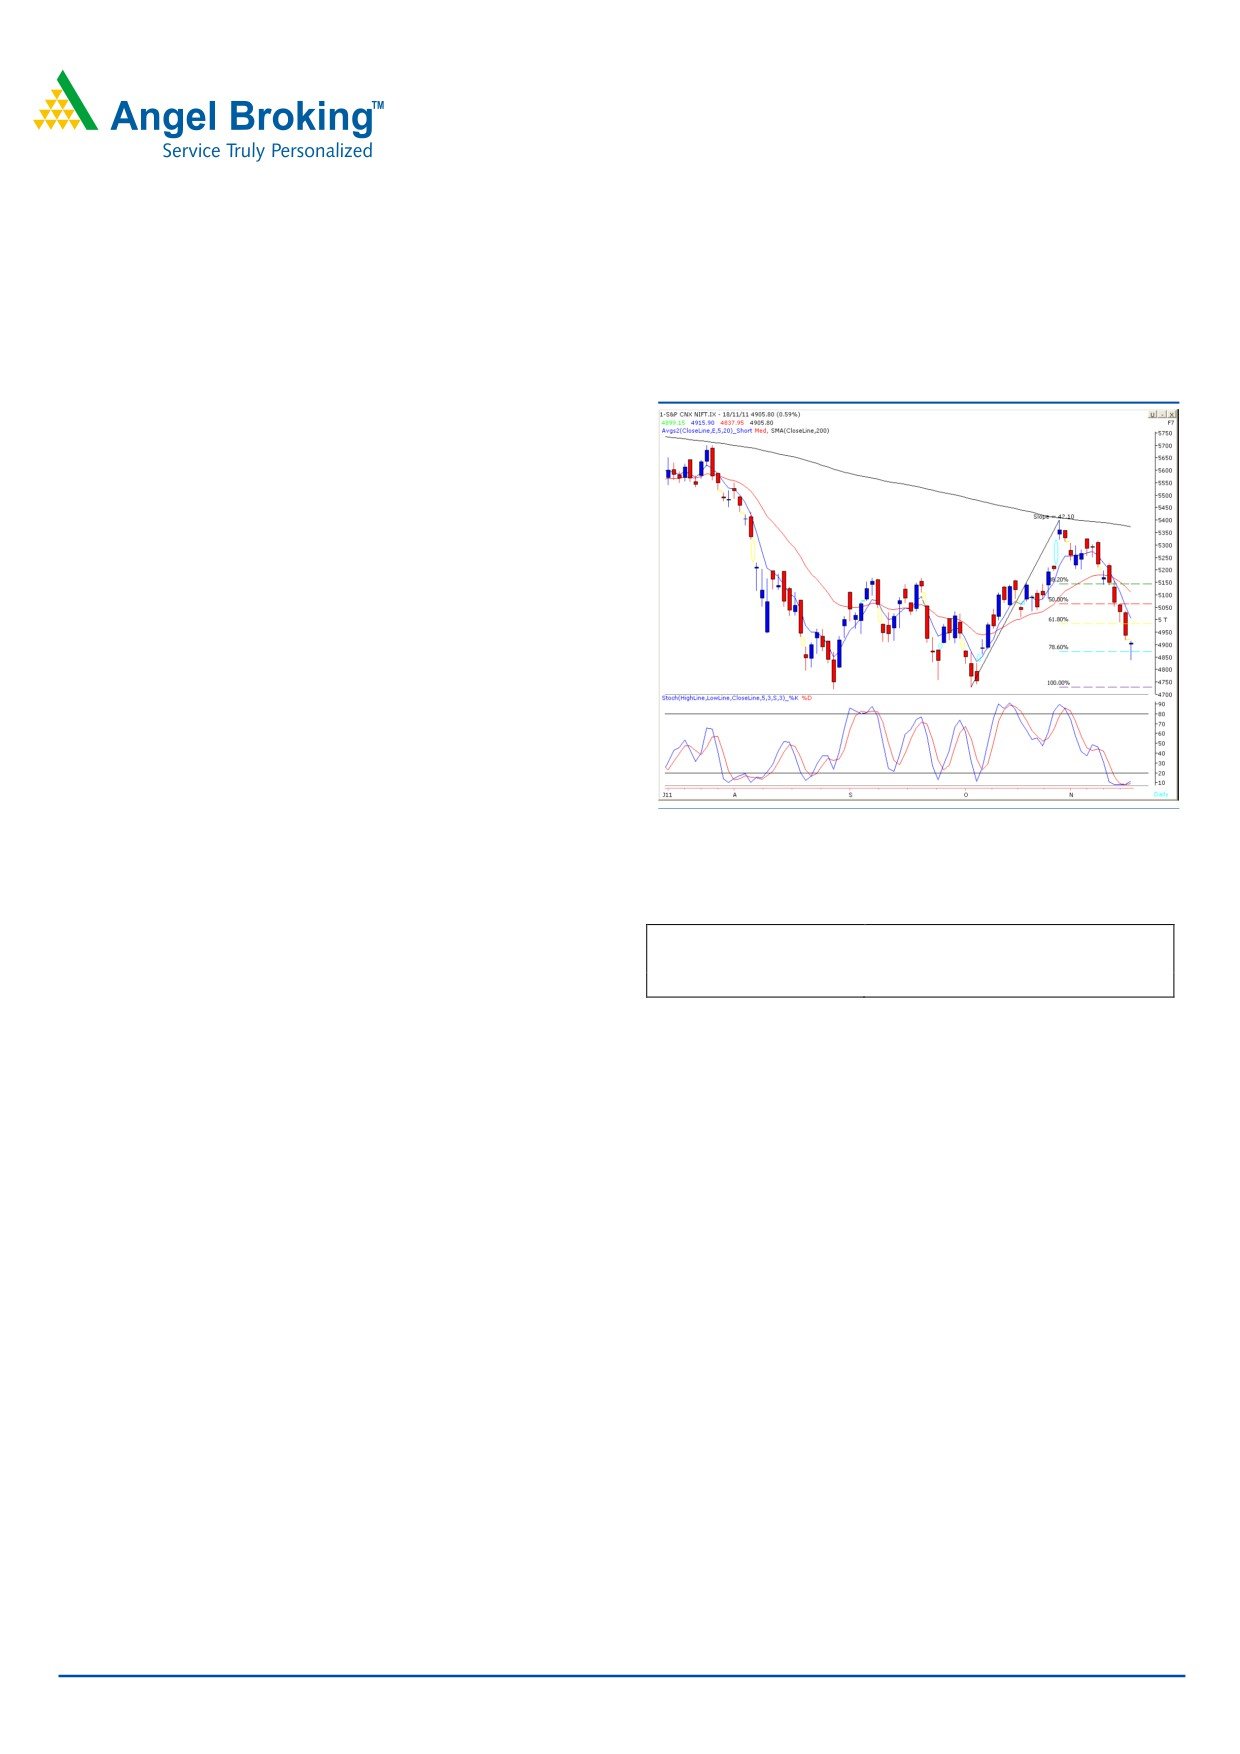
Sensex (16372) / NIFTY (4906)
Exhibit 1: Nifty Daily Chart
On Friday, once again our Benchmark indices opened with
a downside gap and traded with negative bias during the
first half of the session. However, markets found intraday
support near the gap area of 4860 - 4828 and managed
to close marginally above 4900. On the sectoral front,
Realty, FMCG and Metal counters were among the major
losers. There was no sector in the positive territory. The
advance decline ratio was strongly in favor of declining
Formation
• Momentum oscillators viz. the RSI and the Stochastic on
the Weekly chart are negatively poised.
• We are witnessing a negative crossover of “3 & 8
Source: Falcon
Weekly EMA”.
Actionable points:
• The stochastic oscillator on the Daily chart has given a
positive crossover.
View
Neutral
• The Daily chart exhibits a “Bullish Hammer” pattern at
Resistance levels
4916 - 5013
Support level
4845 - 4718
78.60% Fibonacci Retracement level. This pattern needs a
confirmation.
Trading strategy:
On the other hand, the Daily chart depicts a “Bullish
Markets registered a Weekly low of 16165 / 4837 and
Hammer” Japanese Candlestick pattern. The said pattern
will be confirmed only if indices manage to break and close
managed to give a minor bounce on Friday’s session, which
above Friday’s high of 16397 / 4916. In this scenario,
pushed indices higher to close marginally above 16300 /
markets may bounce up to 16669 - 16900 / 5013 - 5085
4900 levels. We are now observing that the momentum
levels.
oscillators and “3 & 8 EMA” on the weekly chart are
negatively poised. Thus, if indices sustain below the 16165
Therefore, we reiterate our view that traders should stay
/ 4837 level, further weakness is expected in the coming
light on positions and follow strict stop losses.
weeks. This may result into a sharp decline to test crucial
and important support level of 15745 / 4718. A move
below this level may reinforce strong negative momentum,
which can drag indices lower to test 15650 - 15330 / 4675
– 4540 levels.
For Private Circulation Only |
1
Technical Research | November 21, 2011
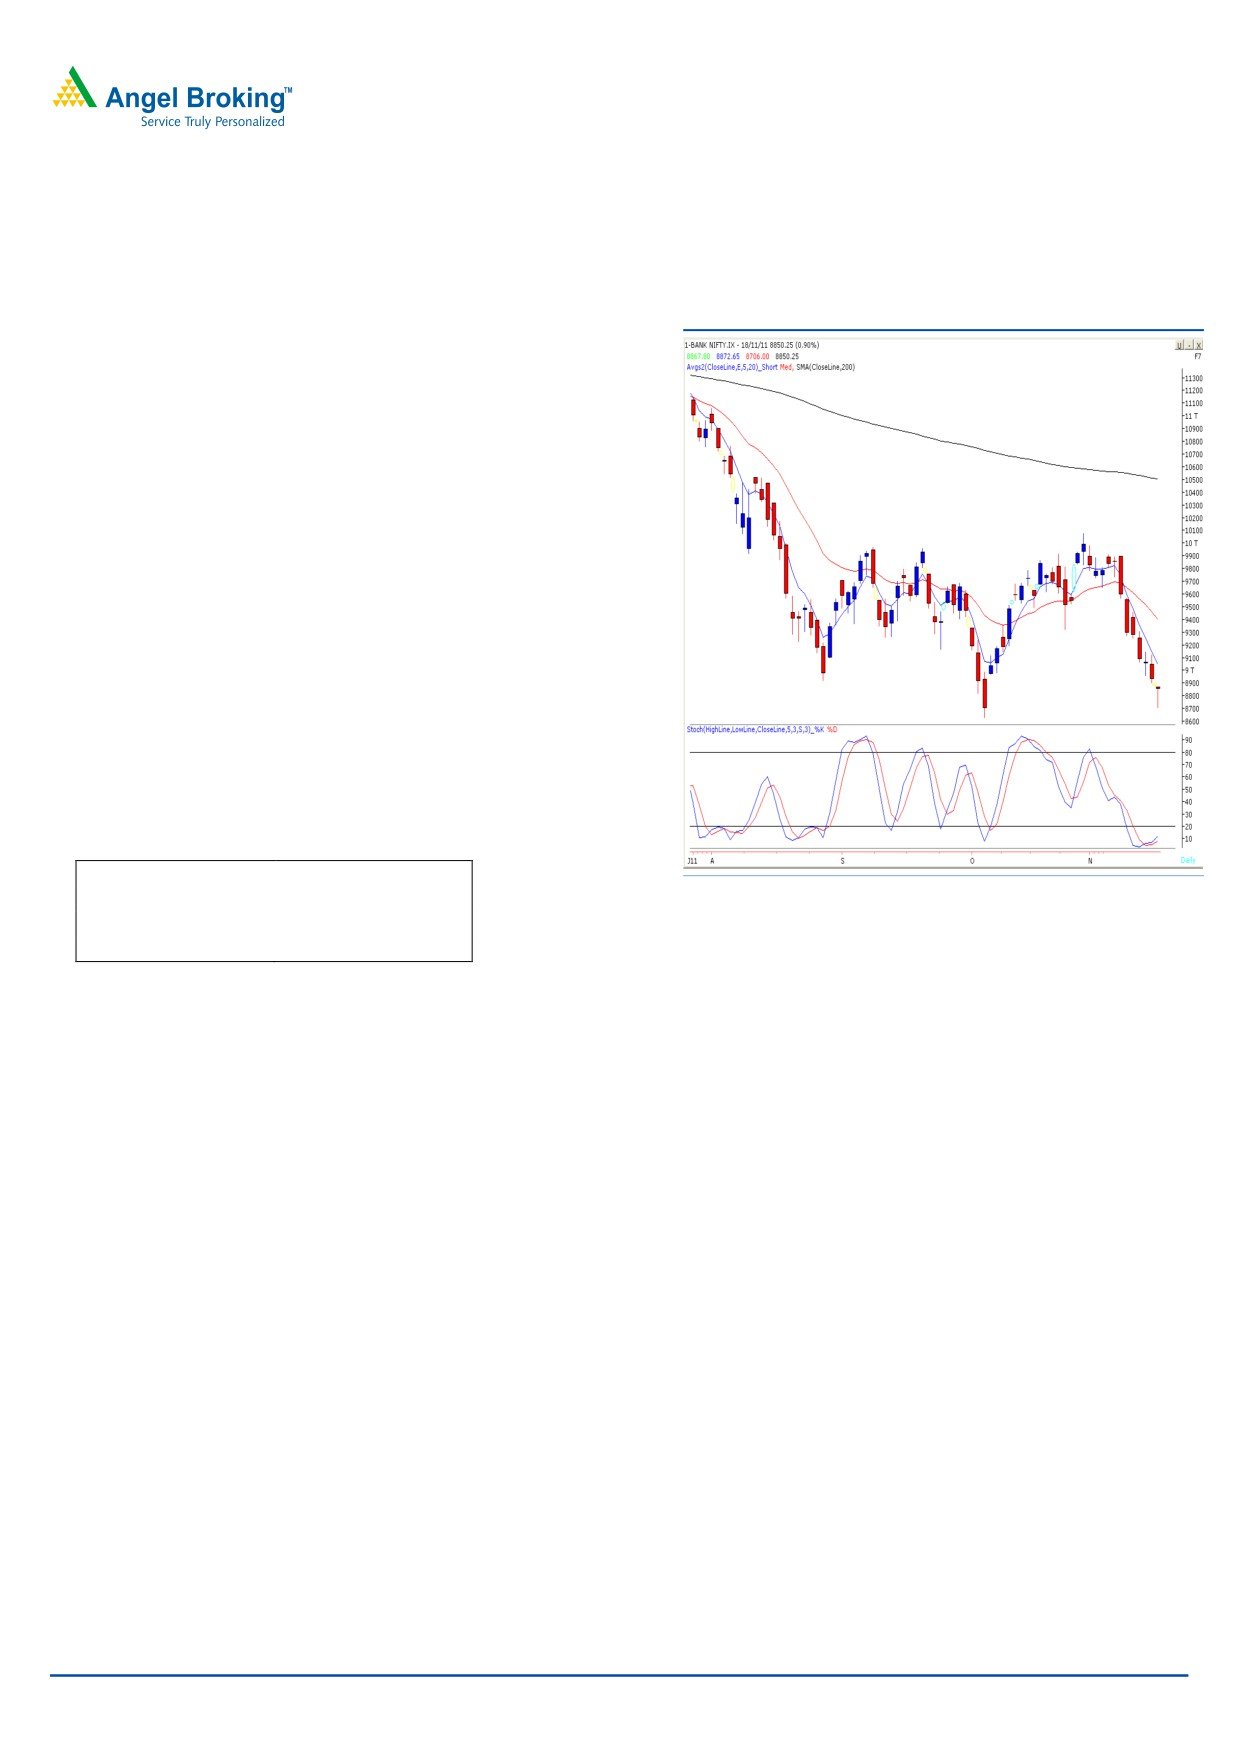
Bank Nifty Outlook - (8850)
Exhibit 2: Bank Nifty Daily Chart
Bank nifty opened with a minor downside gap and
witnessed selling pressure during the first half of the
session. However, index found intraday support near
8700 level and bounced back sharply during the second
half to close almost at the highest point of the day. We
are now observing a “Dragon Fly Doji” candle stick,
which is a reversal pattern and needs confirmation in the
form of a close above 8875 level. We are also witnessing
a positive crossover in momentum oscillator viz., the
Stochastic. Combining above technical evidences, if Bank
Nifty crosses Friday’s high of 8875, then it is likely to rally
towards 9165 - 9265 levels. The said pattern will be
negated only if Bank Nifty closes below 8706 level.
On the downside, 8706 - 8626 levels may act as support
levels for the day.
Actionable points:
View
Bullish
Source: Falcon
Positive Above
8875
Expected Targets
9165 - 9265
Support Levels
8706 - 8626
For Private Circulation Only |
2
Technical Research | November 21, 2011
Positive Bias:
Stock Name
5 Day EMA
20 Day EMA
Expected Target
Remarks
Sintex Industries
96
109.20
103
View will change below 83
Jain Irrigation
118.10
122.60
129.50
View will change below 113
Negative Bias:
Stock Name
5 Day EMA
20 Day EMA
Expected Target
Remarks
Max India
173
179.90
155
View will change above 178
JSW Steel
642.65
642.90
577
View will change above 636
For Private Circulation Only |
3
Technical Research | November 21, 2011
Daily Pivot Levels for Nifty 50 Stocks
SCRIPS
S2
S1
PIVOT
R1
R2
SENSEX
16,079
16,225
16,311
16,457
16,543
NIFTY
4,809
4,857
4,887
4,935
4,965
BANKNIFTY
8,643
8,747
8,810
8,913
8,976
ACC
1,118
1,134
1,149
1,165
1,180
AMBUJACEM
150
151
152
154
155
AXISBANK
921
943
962
983
1,002
BAJAJ-AUTO
1,659
1,676
1,702
1,719
1,745
BHARTIARTL
387
392
397
402
407
BHEL
257
266
276
285
296
BPCL
497
509
519
531
542
CAIRN
293
300
306
314
320
CIPLA
306
310
314
318
323
DLF
193
199
203
208
212
DRREDDY
1,525
1,541
1,560
1,576
1,595
GAIL
363
372
380
389
397
HCLTECH
397
401
404
408
411
HDFC
623
634
641
652
659
HDFCBANK
445
452
457
463
468
HEROMOTOCO
2,063
2,128
2,165
2,230
2,267
HINDALCO
116
120
122
126
128
HINDUNILVR
380
385
389
394
398
ICICIBANK
739
754
764
780
789
IDFC
105
108
110
113
115
INFY
2,697
2,719
2,742
2,764
2,786
ITC
196
199
203
206
210
JINDALSTEL
516
526
535
545
554
JPASSOCIAT
57
60
61
64
65
KOTAKBANK
457
466
472
481
487
LT
1,181
1,213
1,233
1,265
1,285
M&M
704
721
739
756
775
MARUTI
890
915
932
957
974
NTPC
158
160
163
165
167
ONGC
245
252
259
266
273
PNB
828
852
870
894
912
POWERGRID
96
98
101
104
106
RANBAXY
424
442
453
471
482
RCOM
69
71
73
75
77
RELCAPITAL
290
298
307
315
324
RELIANCE
777
793
802
818
827
RELINFRA
391
401
411
421
431
RPOWER
84
87
90
93
95
SAIL
82
88
94
101
107
SBIN
1,669
1,698
1,732
1,761
1,795
SESAGOA
175
179
186
190
197
SIEMENS
687
709
724
747
762
STER
104
106
108
110
112
SUNPHARMA
486
493
498
504
509
SUZLON
21
22
24
25
27
TATAMOTORS
165
168
170
173
175
TATAPOWER
92
95
96
99
100
TATASTEEL
378
385
392
398
405
TCS
1,057
1,072
1,091
1,106
1,124
WIPRO
353
364
370
381
387
Technical Research Team
For Private Circulation Only |
4
Technical Report
RESEARCH TEAM
Shardul Kulkarni
Head - Technicals
Sameet Chavan
Technical Analyst
Sacchitanand Uttekar
Technical Analyst
Mehul Kothari
Technical Analyst
Ankur Lakhotia
Technical Analyst
Research Team: 022-3952 6600
DISCLAIMER: This document is not for public distribution and has been furnished to you solely for your information and must not
be reproduced or redistributed to any other person. Persons into whose possession this document may come are required to observe
these restrictions.
Opinion expressed is our current opinion as of the date appearing on this material only. While we endeavor to update on a
reasonable basis the information discussed in this material, there may be regulatory, compliance, or other reasons that prevent us
from doing so. Prospective investors and others are cautioned that any forward-looking statements are not predictions and may be
subject to change without notice. Our proprietary trading and investment businesses may make investment decisions that are
inconsistent with the recommendations expressed herein.
The information in this document has been printed on the basis of publicly available information, internal data and other reliable
sources believed to be true and are for general guidance only. While every effort is made to ensure the accuracy and completeness of
information contained, the company takes no guarantee and assumes no liability for any errors or omissions of the information. No
one can use the information as the basis for any claim, demand or cause of action.
Recipients of this material should rely on their own investigations and take their own professional advice. Each recipient of this
document should make such investigations as it deems necessary to arrive at an independent evaluation of an investment in the
securities of companies referred to in this document (including the merits and risks involved), and should consult their own advisors to
determine the merits and risks of such an investment. Price and value of the investments referred to in this material may go up or
down. Past performance is not a guide for future performance. Certain transactions - futures, options and other derivatives as well as
non-investment grade securities - involve substantial risks and are not suitable for all investors. Reports based on technical analysis
centers on studying charts of a stock's price movement and trading volume, as opposed to focusing on a company's fundamentals
and as such, may not match with a report on a company's fundamentals.
We do not undertake to advise you as to any change of our views expressed in this document. While we would endeavor to update
the information herein on a reasonable basis, Angel Broking, its subsidiaries and associated companies, their directors and
employees are under no obligation to update or keep the information current. Also there may be regulatory, compliance, or other
reasons that may prevent Angel Broking and affiliates from doing so. Prospective investors and others are cautioned that any
forward-looking statements are not predictions and may be subject to change without notice.
Angel Broking Limited and affiliates, including the analyst who has issued this report, may, on the date of this report, and from time
to time, have long or short positions in, and buy or sell the securities of the companies mentioned herein or engage in any other
transaction involving such securities and earn brokerage or compensation or act as advisor or have other potential conflict of interest
with respect to company/ies mentioned herein or inconsistent with any recommendation and related information and opinions.
Angel Broking Limited and affiliates may seek to provide or have engaged in providing corporate finance, investment banking or
other advisory services in a merger or specific transaction to the companies referred to in this report, as on the date of this report or
in the past.
Sebi Registration No: INB 010996539
For Private Circulation Only |