Technical Research | October 21, 2011
Daily Technical Report
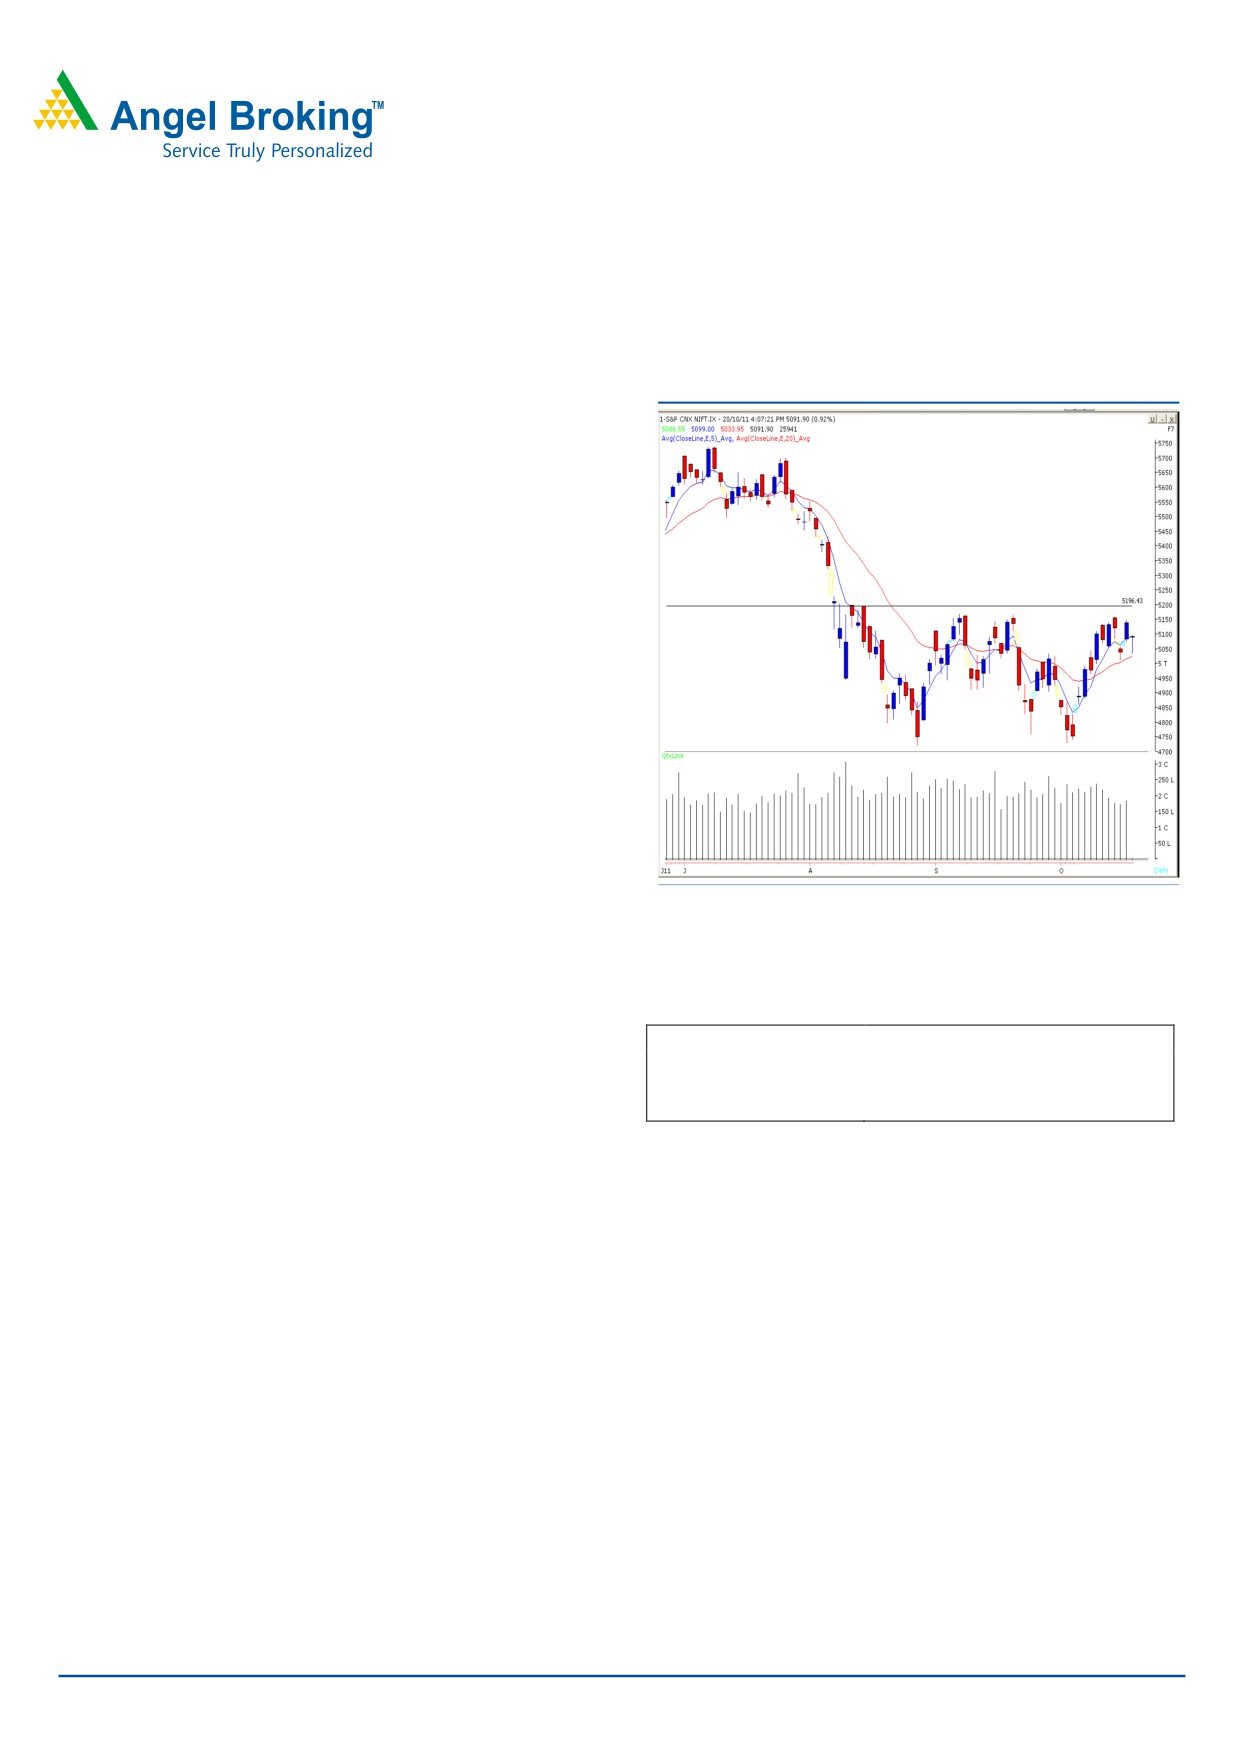
Sensex (16937) / NIFTY (5092)
We witnessed a gap down opening in yesterday’s session
Exhibit 1: Nifty Daily Chart
mainly due to negativity in Asian markets and headed
towards daily “20 EMA which has now moved higher
around 16706 / 5023 level. However, the buying emerged
near day’s low which pushed indices higher to close
marginally above the opening level. On the sector front,
Realty, Auto and Power counters were among the losers
whereas Teck and IT sectors ended with a marginal gain.
The advance decline ratio was strongly in favor of declining
Formation
• On the Daily as well as Weekly chart, there is a
“Horizontal Trend Line” resistance at 17256 / 5198 level.
• The “20 EMA” on the Daily chart is now placed at
16706 / 5023 level.
Source: Falcon
Trading strategy:
Actionable points:
Broadly speaking, indices are now trading range of 17300
to 16640 / 5198 to 5000. Thus, 16744 - 16640 / 5033 -
View
Neutral
5000 levels are likely to act as a strong support in coming
Resistance Levels
5177 - 5198
trading session. On the upside, the buying may emerged
Support Levels
5033 - 5000
only if indices manage to sustain above Wednesday’s high
of 17107 / 5148. In this case, indices would head towards
the strong resistance zone of 17260 - 17300 / 5177 -
5198.
We reiterate that traders should to adopt a stock specific
approach and trade with strict stop losses. Also, traders are
advised not to take heavy positions on the nifty while the
market stays on the above mentioned range of 17300 to
16640 / 5198 to 5000.
For Private Circulation Only |
1
Technical Research | October 21, 2011
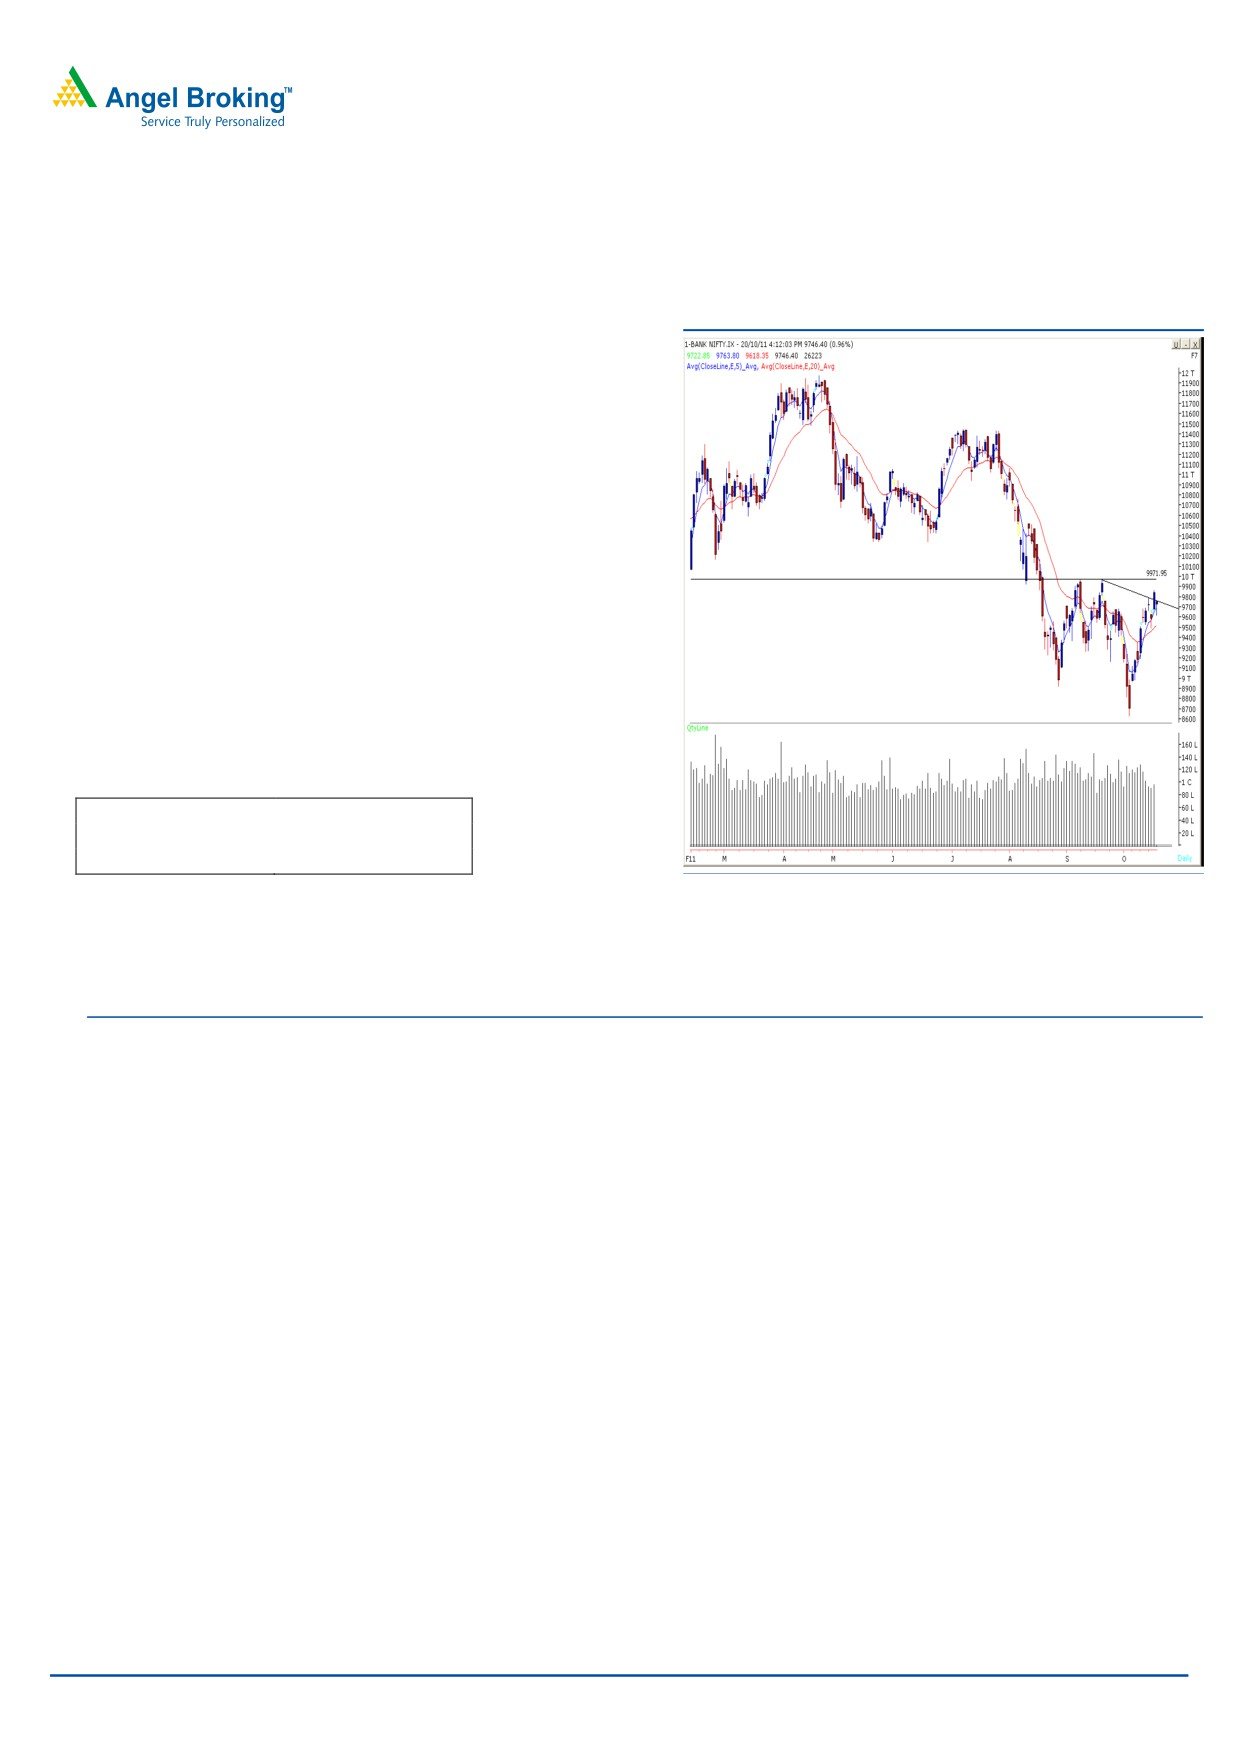
Bank Nifty Outlook - (9746)
Exhibit 2: Bank Nifty Daily Chart
Bank nifty opened with a negative bias due to weak global
sentiments and tested our mentioned support level of 9580
during the initial part of the session. However, during the
second part of the session, buying emerged near this support
level which led the index to close near day’s high. Going
forward if bank nifty sustains above yesterday’s high of
9764, then it is likely to test 9970 level. This level coincides
with the multiple resistance zone near to 9970 to 10030.
Therefore, some profit booking or consolidation is likely to
take place if Bank Nifty manages to rally towards these
levels.
On the downside, 9580 level may act as a support for the
day.
Actionable points:
View
Neutral
Resistance Levels
9865 - 9970
Support Level
9580
Source: Falcon
For Private Circulation Only |
2
Technical Research | October 21, 2011
Positive Bias:
Stock Name
5 Day EMA
20 Day EMA
Expected Target
Remarks
PFC
148.1
147.8
156.4
View will change below 144.5
SunPharma
480
475.1
497
View will change below 475
Vip Inds
941.1
931.2
977
View will change below 922
Negative Bias:
Stock Name
5 Day EMA
20 Day EMA
Expected Target
Remarks
Jp Assoc
71.8
71.5
67
View will change above 73.5
For Private Circulation Only |
3
Technical Research | October 21, 2011
Daily Pivot Levels for Nifty 50 Stocks
SCRIPS
S2
S1
PIVOT
R1
R2
SENSEX
16,664
16,801
16,881
17,018
17,098
NIFTY
5,010
5,051
5,075
5,116
5,140
BANKNIFTY
9,564
9,655
9,710
9,801
9,855
ACC
1,097
1,106
1,116
1,125
1,135
AMBUJACEM
151
153
154
156
157
AXISBANK
1,086
1,108
1,122
1,144
1,158
BAJAJ-AUTO
1,508
1,561
1,608
1,661
1,708
BHARTIARTL
375
383
387
395
399
BHEL
312
315
319
322
326
BPCL
623
633
641
651
659
CAIRN
286
290
294
297
301
CIPLA
284
286
288
291
293
DLF
224
227
232
236
241
DRREDDY
1,498
1,510
1,519
1,531
1,539
GAIL
412
417
420
425
428
HCLTECH
395
403
409
417
423
HDFC
619
632
651
664
683
HDFCBANK
476
483
488
494
499
HEROMOTOCO
1,969
1,999
2,028
2,058
2,086
HINDALCO
122
123
125
126
128
HINDUNILVR
325
328
331
334
337
ICICIBANK
862
870
878
887
895
IDFC
118
120
123
125
128
INFY
2,661
2,704
2,731
2,774
2,800
ITC
203
204
205
206
208
JINDALSTEL
507
522
533
548
558
JPASSOCIAT
68
69
71
72
73
KOTAKBANK
458
465
469
476
480
LT
1,364
1,375
1,382
1,392
1,400
M&M
773
787
801
816
830
MARUTI
1,039
1,058
1,069
1,088
1,099
NTPC
167
169
170
173
174
ONGC
261
264
266
269
271
PNB
943
963
979
1,000
1,016
POWERGRID
98
99
99
100
100
RANBAXY
490
496
504
510
518
RCOM
73
74
75
76
77
RELCAPITAL
321
329
334
343
348
RELIANCE
815
827
834
846
853
RELINFRA
396
401
406
410
415
RPOWER
84
84
85
86
87
SAIL
103
105
106
108
110
SBIN
1,867
1,901
1,921
1,954
1,974
SESAGOA
203
206
210
213
217
SIEMENS
792
801
816
825
839
STER
112
114
117
119
121
SUNPHARMA
474
481
486
493
497
SUZLON
35
36
36
37
37
TATAMOTORS
179
181
183
185
187
TATAPOWER
95
96
98
99
101
TATASTEEL
416
429
436
449
457
TCS
1,024
1,034
1,041
1,051
1,057
WIPRO
344
349
352
358
361
Technical Research Team
For Private Circulation Only |
4
Technical Report
RESEARCH TEAM
Shardul Kulkarni
Head - Technicals
Sameet Chavan
Technical Analyst
Sacchitanand Uttekar
Technical Analyst
Mehul Kothari
Technical Analyst
Ankur Lakhotia
Technical Analyst
Research Team: 022-3952 6600
DISCLAIMER: This document is not for public distribution and has been furnished to you solely for your information and must not
be reproduced or redistributed to any other person. Persons into whose possession this document may come are required to observe
these restrictions.
Opinion expressed is our current opinion as of the date appearing on this material only. While we endeavor to update on a
reasonable basis the information discussed in this material, there may be regulatory, compliance, or other reasons that prevent us
from doing so. Prospective investors and others are cautioned that any forward-looking statements are not predictions and may be
subject to change without notice. Our proprietary trading and investment businesses may make investment decisions that are
inconsistent with the recommendations expressed herein.
The information in this document has been printed on the basis of publicly available information, internal data and other reliable
sources believed to be true and are for general guidance only. While every effort is made to ensure the accuracy and completeness of
information contained, the company takes no guarantee and assumes no liability for any errors or omissions of the information. No
one can use the information as the basis for any claim, demand or cause of action.
Recipients of this material should rely on their own investigations and take their own professional advice. Each recipient of this
document should make such investigations as it deems necessary to arrive at an independent evaluation of an investment in the
securities of companies referred to in this document (including the merits and risks involved), and should consult their own advisors to
determine the merits and risks of such an investment. Price and value of the investments referred to in this material may go up or
down. Past performance is not a guide for future performance. Certain transactions - futures, options and other derivatives as well as
non-investment grade securities - involve substantial risks and are not suitable for all investors. Reports based on technical analysis
centers on studying charts of a stock's price movement and trading volume, as opposed to focusing on a company's fundamentals
and as such, may not match with a report on a company's fundamentals.
We do not undertake to advise you as to any change of our views expressed in this document. While we would endeavor to update
the information herein on a reasonable basis, Angel Broking, its subsidiaries and associated companies, their directors and
employees are under no obligation to update or keep the information current. Also there may be regulatory, compliance, or other
reasons that may prevent Angel Broking and affiliates from doing so. Prospective investors and others are cautioned that any
forward-looking statements are not predictions and may be subject to change without notice.
Angel Broking Limited and affiliates, including the analyst who has issued this report, may, on the date of this report, and from time
to time, have long or short positions in, and buy or sell the securities of the companies mentioned herein or engage in any other
transaction involving such securities and earn brokerage or compensation or act as advisor or have other potential conflict of interest
with respect to company/ies mentioned herein or inconsistent with any recommendation and related information and opinions.
Angel Broking Limited and affiliates may seek to provide or have engaged in providing corporate finance, investment banking or
other advisory services in a merger or specific transaction to the companies referred to in this report, as on the date of this report or
in the past.
Sebi Registration No : INB 010996539
For Private Circulation Only |