Technical Research | April 20, 2012
Daily Technical Report
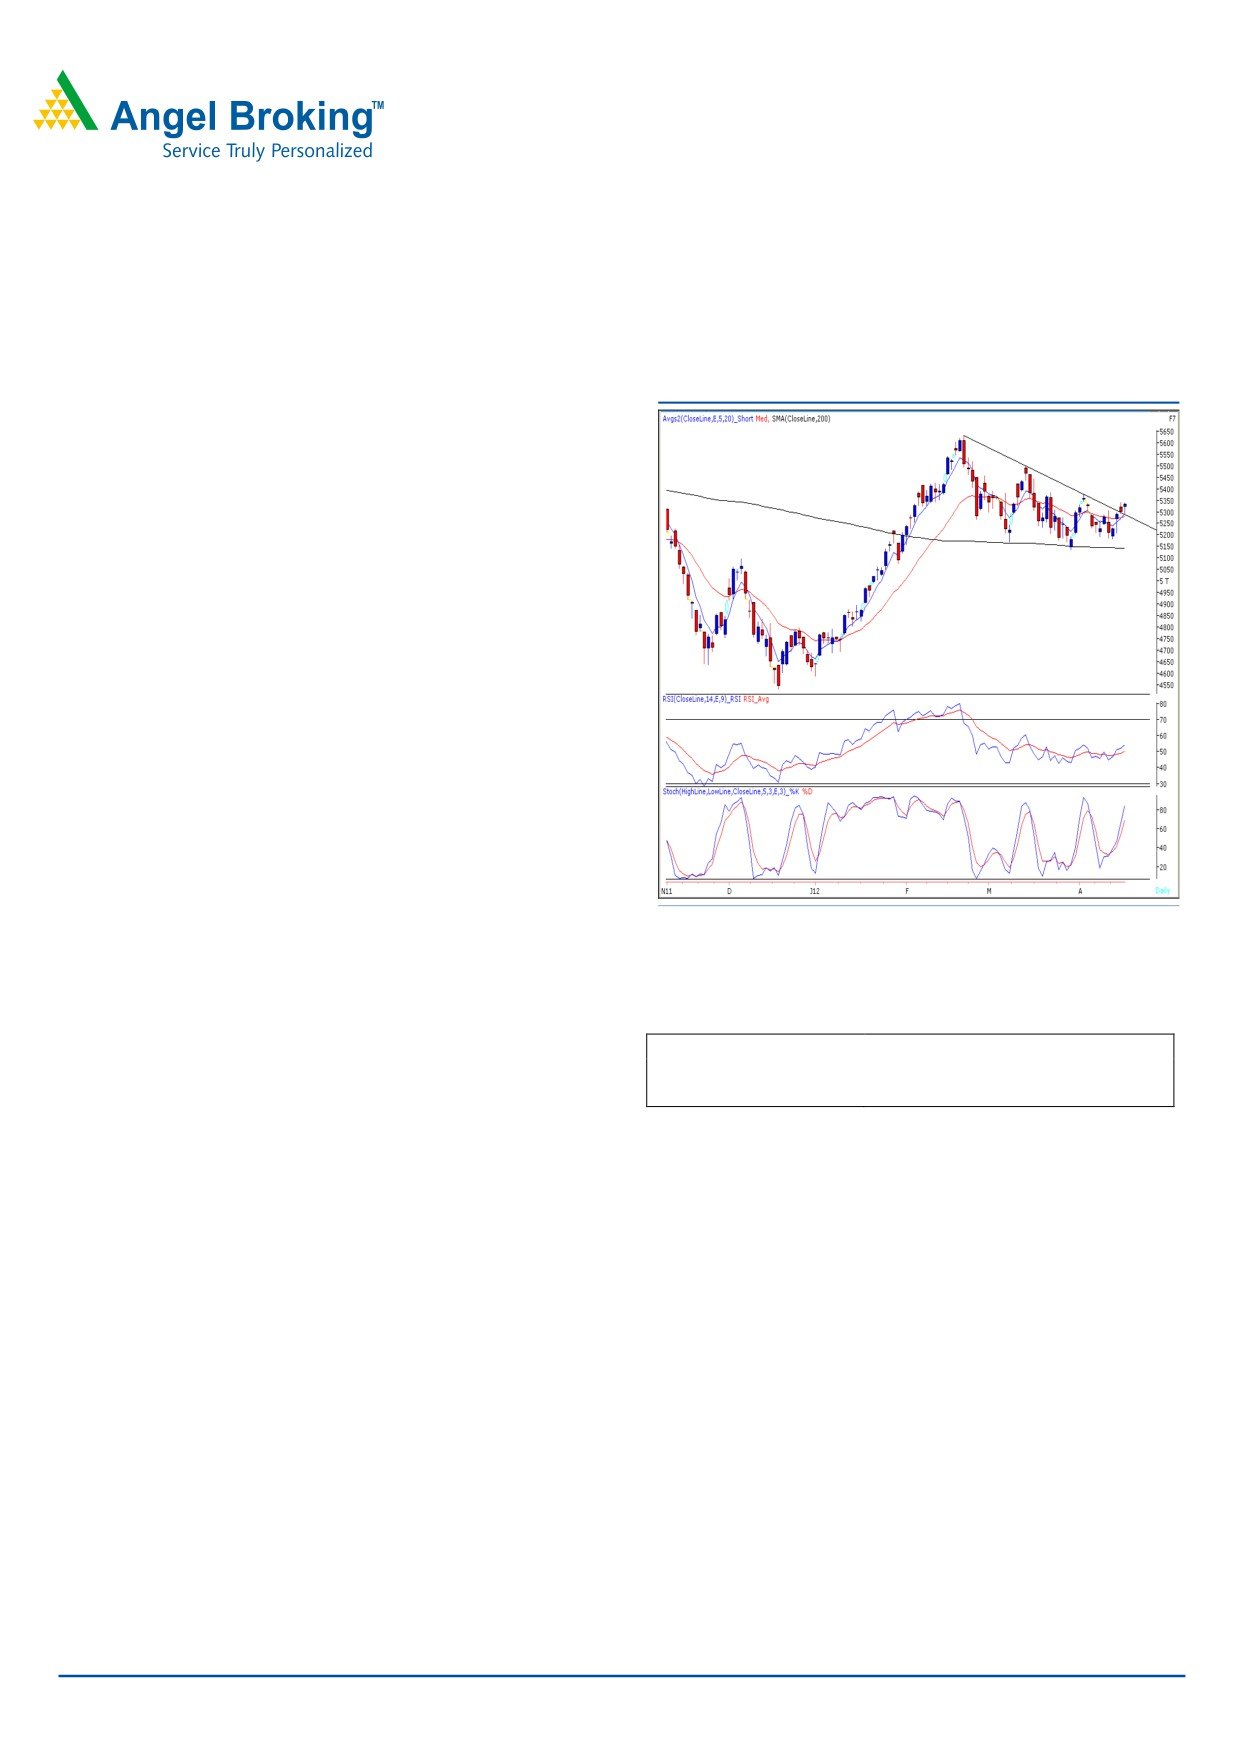
Sensex (17504) / NIFTY (5332)
Exhibit 1: Nifty Daily Chart
Yesterday, we witnessed a flat opening in-line with other
Asian markets. Our benchmark indices traded above hourly
20 EMA and momentum picked up during the second half,
to at the highest point of the session. On the sectoral front,
Auto, Health Care and FMCG counters contributed heavily
in yesterday’s up move; whereas Capital Goods and Power
sectors ended on the losing side. The advance to decline
ratio was in favor of advancing counters (A=1504
Formation:
• The 200-day SMA (Simple Moving Average) and 20-
day EMA (Exponential Moving Average) have now shifted to
17100 / 5150 and 17324 / 5271, respectively.
• The ‘20-Week EMA’ is placed at 17200 / 5200 level.
Source: Falcon
• We are witnessing a ‘Downward Sloping Trend Line’
breakout around 17400 / 5300 level.
Actionable points:
Trading strategy:
View
Positive Above 5343
Expected Targets
5380 - 5441
Markets opened on a flat note and lingered around the
Support Levels
5291
hourly ’20 EMA’ during the first half. However, strong
buying emerged near this support zone, which pushed
indices higher to test mentioned resistance level of 5330 /
17475. We reiterate our bullish opinion on the market
considering the breakout from the downward sloping trend
line. The markets have closed marginally below previous
day’s high of 17523 / 5342. Going forward, once indices
manage to trade above 17531 / 5343 level, then we may
witness enhanced buying interest among market
participants. In this scenario, markets are likely to rally
towards the next resistance zone of 17664 - 17900/ 5380
- 5441. Conversely, yesterday’s low of 17361 / 5291 holds
a key support for the markets.
For Private Circulation Only |
1
Technical Research | April 20, 2012
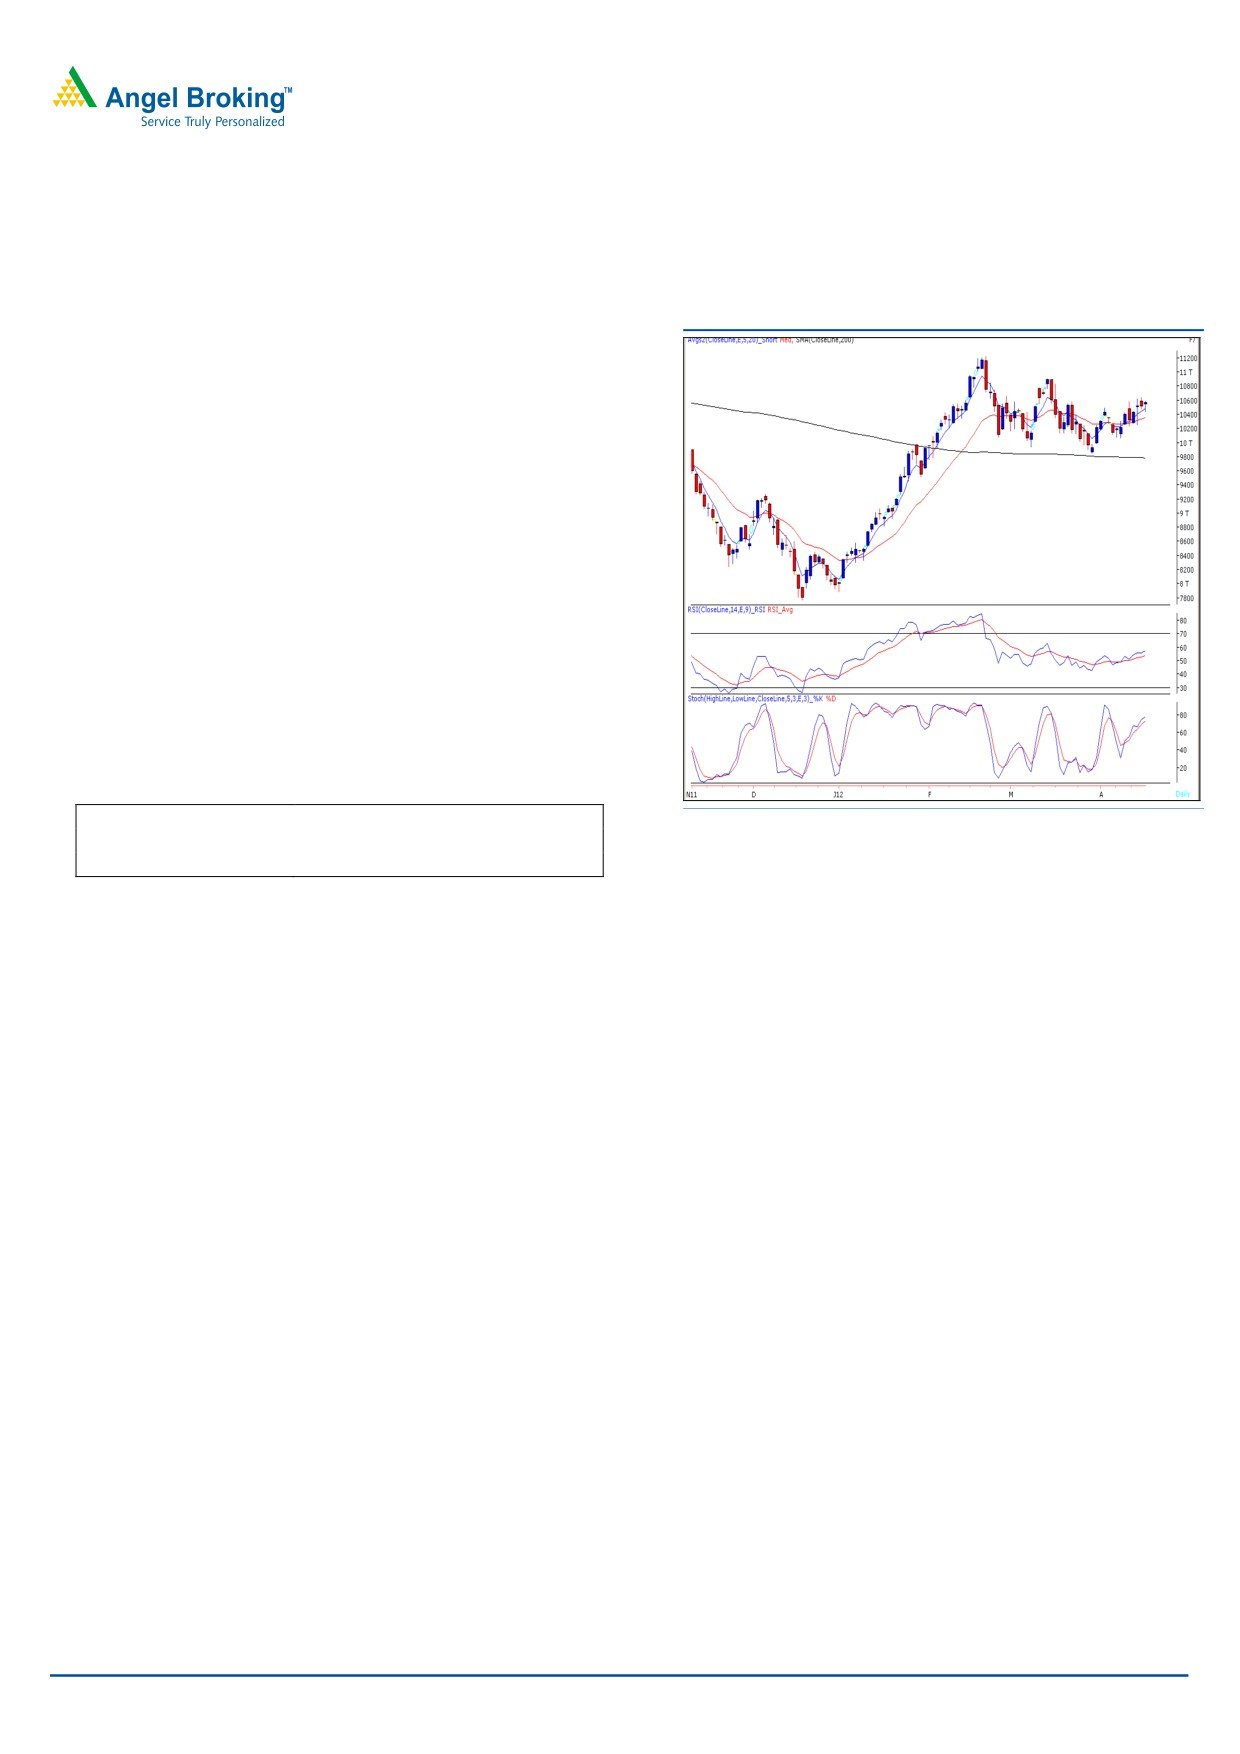
Bank Nifty Outlook - (10568)
Exhibit 2: Bank Nifty Daily Chart
Yesterday, Bank Nifty opened on a flat note and traded
with extreme volatility throughout the session. For the
third consecutive session we are observing a narrow
range body formation, which is a sign of indecisiveness
prevailing at current levels. Hence, we reiterate our view
that the index is in a trading range of 10650 - 10150.
Only a sustainable move outside the mentioned range
will dictate a clear direction of the trend. On the upside a
sustainable move above
10650 will trigger fresh
momentum on the upside and the index may rally
towards the resistance zone of 10750 - 10775. On the
downside a fall below yesterday’s low of 10438 may lead
the index to test the support zone of 10250 - 10235.
Actionable points:
View
Positive Above 10650
Source: Falcon
Resistance Levels
10750 - 10775
Support Levels
10438 - 10250 - 10235
For Private Circulation Only |
2
Technical Research | April 20, 2012
Positive Bias:
Positive
Expected
Stock Name
CMP
5 Day EMA
20 Day EMA
Remarks
Above
Target
Tata Global
View will change below
124.45
120.5
117.3
124.7
139
115.9
United
View will change below
128.2
127.9
131
129.2
132.5
Phosphorous
126
For Private Circulation Only |
3
Technical Research | April 20, 2012
Daily Pivot Levels for Nifty 50 Stocks
SCRIPS
S2
S1
PIVOT
R1
R2
SENSEX
17,297
17,400
17,465
17,569
17,634
NIFTY
5,271
5,302
5,322
5,353
5,373
BANKNIFTY
10,378
10,473
10,534
10,629
10,690
ACC
1,188
1,218
1,268
1,298
1,349
AMBUJACEM
160
162
166
168
172
AXISBANK
1,171
1,183
1,196
1,209
1,222
BAJAJ-AUTO
1,709
1,719
1,730
1,740
1,750
BHARTIARTL
319
322
324
326
328
BHEL
244
247
253
256
261
BPCL
687
691
696
700
706
CAIRN
345
348
351
354
358
CIPLA
311
316
319
323
326
COALINDIA
342
352
357
367
373
DLF
195
198
201
203
206
DRREDDY
1,755
1,781
1,797
1,823
1,839
GAIL
351
356
363
368
375
HCLTECH
490
497
501
507
511
HDFC
678
684
688
695
698
HDFCBANK
531
542
549
561
567
HEROMOTOCO
2,093
2,144
2,178
2,230
2,264
HINDALCO
125
127
129
130
133
HINDUNILVR
416
421
426
430
435
ICICIBANK
858
868
876
886
893
IDFC
130
131
133
135
136
INFY
2,349
2,377
2,396
2,424
2,443
ITC
236
240
243
246
249
JINDALSTEL
503
510
515
522
528
JPASSOCIAT
78
79
81
82
84
KOTAKBANK
564
579
590
605
615
LT
1,293
1,306
1,318
1,330
1,342
M&M
686
696
703
713
720
MARUTI
1,339
1,365
1,383
1,409
1,427
NTPC
166
167
168
169
171
ONGC
267
270
272
274
276
PNB
909
915
923
929
937
POWERGRID
113
114
114
115
116
RANBAXY
503
511
516
524
529
RCOM
84
85
86
87
88
RELIANCE
729
735
745
751
760
RELINFRA
549
558
570
579
591
RPOWER
115
116
117
118
119
SAIL
95
97
98
99
101
SBIN
2,229
2,249
2,274
2,294
2,319
SESAGOA
182
187
191
197
200
SIEMENS
813
821
827
836
841
STER
107
108
110
111
113
SUNPHARMA
587
592
600
605
612
SUZLON
24
24
24
24
24
TATAMOTORS
306
312
316
323
327
TATAPOWER
105
106
108
109
110
TATASTEEL
458
463
466
471
474
TCS
1,085
1,094
1,100
1,109
1,116
WIPRO
413
417
423
427
433
Technical Research Team
For Private Circulation Only |
4
Technical Report
RESEARCH TEAM
Shardul Kulkarni
Head - Technicals
Sameet Chavan
Technical Analyst
Sacchitanand Uttekar
Technical Analyst
Mehul Kothari
Technical Analyst
Ankur Lakhotia
Technical Analyst
Research Team: 022-3952 6600
DISCLAIMER: This document is not for public distribution and has been furnished to you solely for your information and must not
be reproduced or redistributed to any other person. Persons into whose possession this document may come are required to observe
these restrictions.
Opinion expressed is our current opinion as of the date appearing on this material only. While we endeavor to update on a
reasonable basis the information discussed in this material, there may be regulatory, compliance, or other reasons that prevent us
from doing so. Prospective investors and others are cautioned that any forward-looking statements are not predictions and may be
subject to change without notice. Our proprietary trading and investment businesses may make investment decisions that are
inconsistent with the recommendations expressed herein.
The information in this document has been printed on the basis of publicly available information, internal data and other reliable
sources believed to be true and are for general guidance only. While every effort is made to ensure the accuracy and completeness of
information contained, the company takes no guarantee and assumes no liability for any errors or omissions of the information. No
one can use the information as the basis for any claim, demand or cause of action.
Recipients of this material should rely on their own investigations and take their own professional advice. Each recipient of this
document should make such investigations as it deems necessary to arrive at an independent evaluation of an investment in the
securities of companies referred to in this document (including the merits and risks involved), and should consult their own advisors to
determine the merits and risks of such an investment. Price and value of the investments referred to in this material may go up or
down. Past performance is not a guide for future performance. Certain transactions - futures, options and other derivatives as well as
non-investment grade securities - involve substantial risks and are not suitable for all investors. Reports based on technical analysis
centers on studying charts of a stock's price movement and trading volume, as opposed to focusing on a company's fundamentals
and as such, may not match with a report on a company's fundamentals.
We do not undertake to advise you as to any change of our views expressed in this document. While we would endeavor to update
the information herein on a reasonable basis, Angel Broking, its subsidiaries and associated companies, their directors and
employees are under no obligation to update or keep the information current. Also there may be regulatory, compliance, or other
reasons that may prevent Angel Broking and affiliates from doing so. Prospective investors and others are cautioned that any
forward-looking statements are not predictions and may be subject to change without notice.
Angel Broking Limited and affiliates, including the analyst who has issued this report, may, on the date of this report, and from time
to time, have long or short positions in, and buy or sell the securities of the companies mentioned herein or engage in any other
transaction involving such securities and earn brokerage or compensation or act as advisor or have other potential conflict of interest
with respect to company/ies mentioned herein or inconsistent with any recommendation and related information and opinions.
Angel Broking Limited and affiliates may seek to provide or have engaged in providing corporate finance, investment banking or
other advisory services in a merger or specific transaction to the companies referred to in this report, as on the date of this report or
in the past.
Sebi Registration No: INB 010996539
For Private Circulation Only |