Technical Research | January 20, 2012
Daily Technical Report
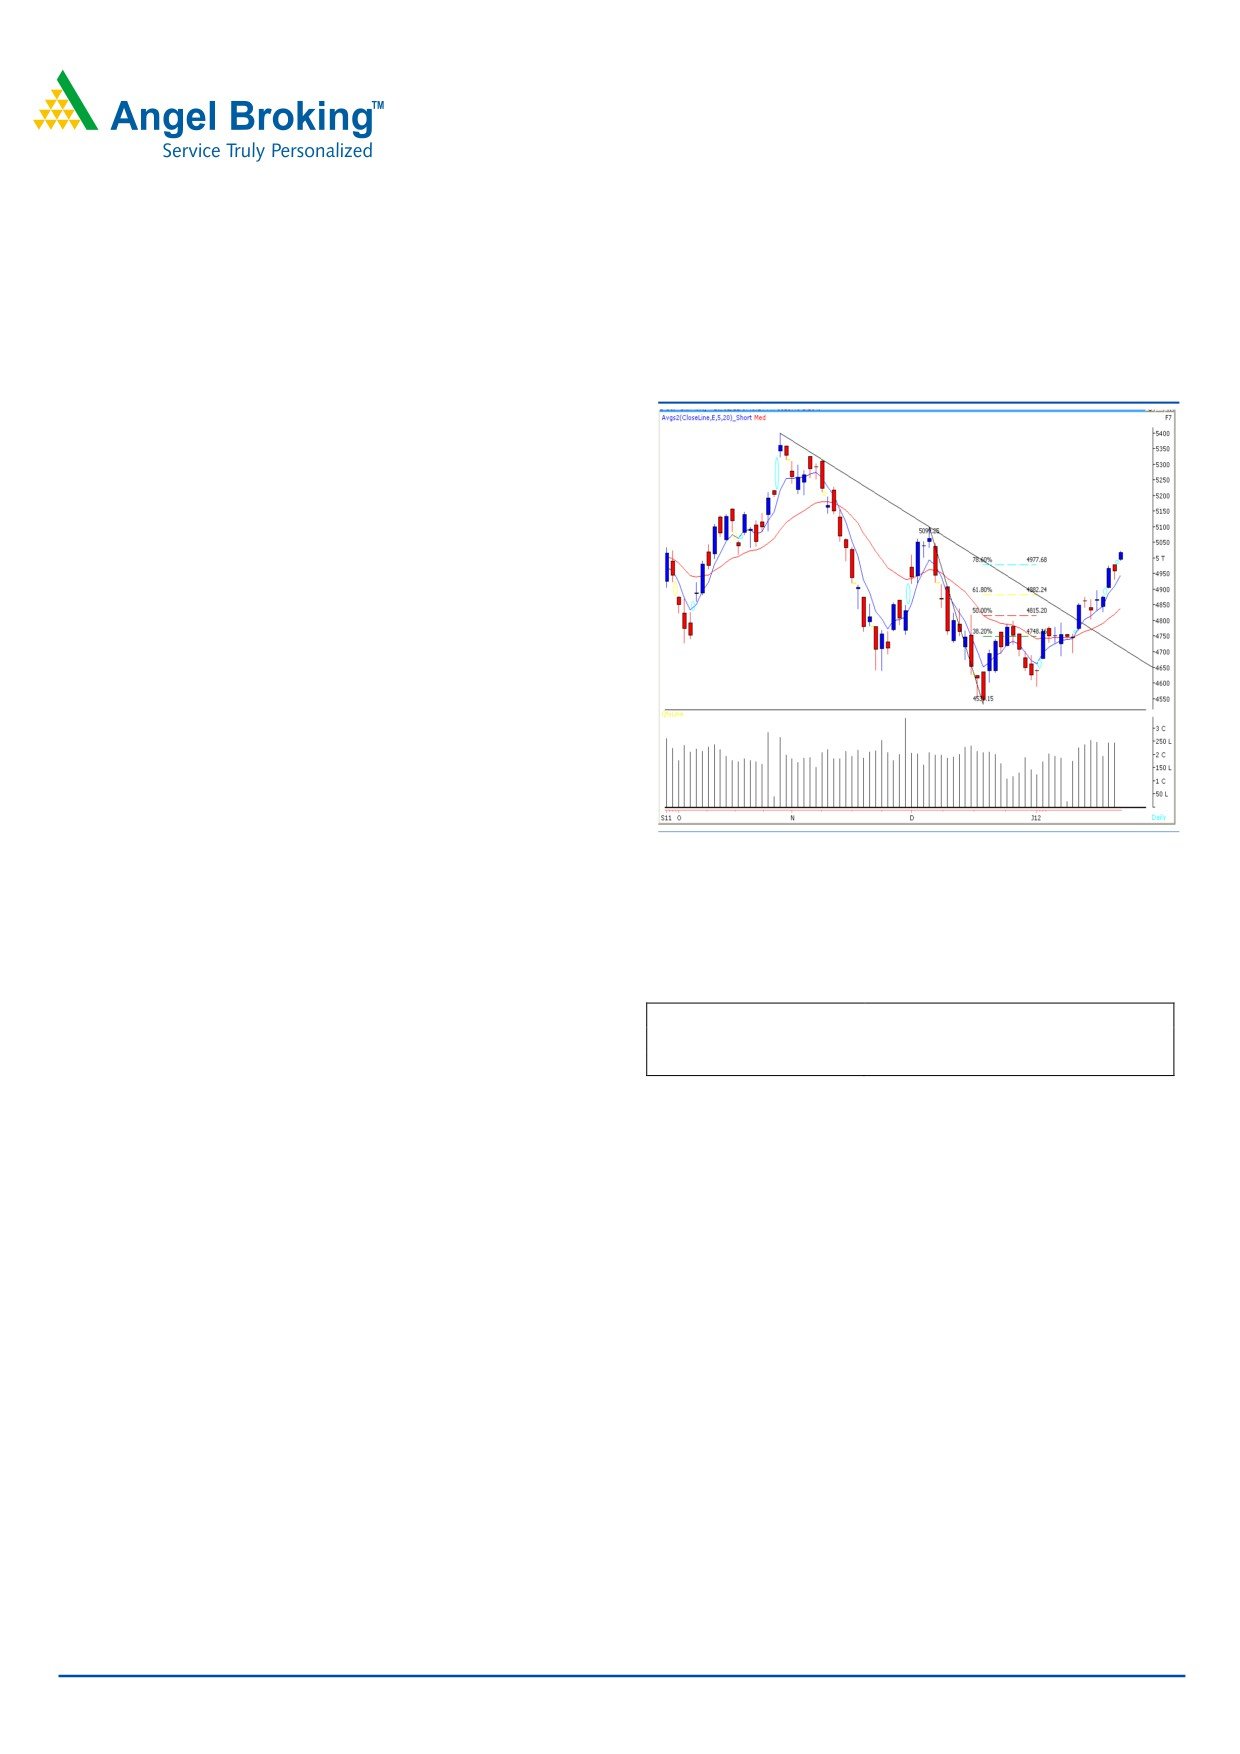
Sensex (16633) / NIFTY (5018)
Exhibit 1: Nifty Daily Chart
Yesterday, markets opened on a higher note in-line with
strong positive cues from other Asian markets and then
moved in a narrow range which led indices to give a close
above the psychological level of 5000. On the sectoral
front, Realty, Metal and Power sectors were among the
major gainers, whereas IT and Teck ended marginally in
the negative territory. The advance to decline ratio was in
strongly favor of advancing counters. (A=1802 D=985)
Formation:
• The 20-day EMA (Exponential Moving Average) has
now shifted to the 16050 / 4820 level.
Source: Falcon
Trading strategy:
After a gap up opening, indices traded in a narrow range
during the first half and convincingly managed to sustain
Actionable points:
above
78.6% Fibonacci retracement resistance level of
View
Neutral
16600 / 4976. Going forward, indices are likely to rally
Resistance levels
5024 - 5050 - 5100
Support levels
4980 - 4970 - 4931
towards 16848 - 17004 / 5050 - 5100, if they sustain
above yesterday’s high of 16662 / 5024. On the downside,
yesterday’s upside gap area of 16517 to 16572 / 4980 to
4991. A sustainable move below 16517 / 4980 may lead
to a minor correction towards next support levels of 16500
- 16384 / 4970 - 4931. Traders with are advised to lighten
up positions and partial book profits as the markets edge
higher towards the levels of 16848 - 17004 / 5050 - 5100.
For Private Circulation Only |
1
Technical Research | January 20, 2012
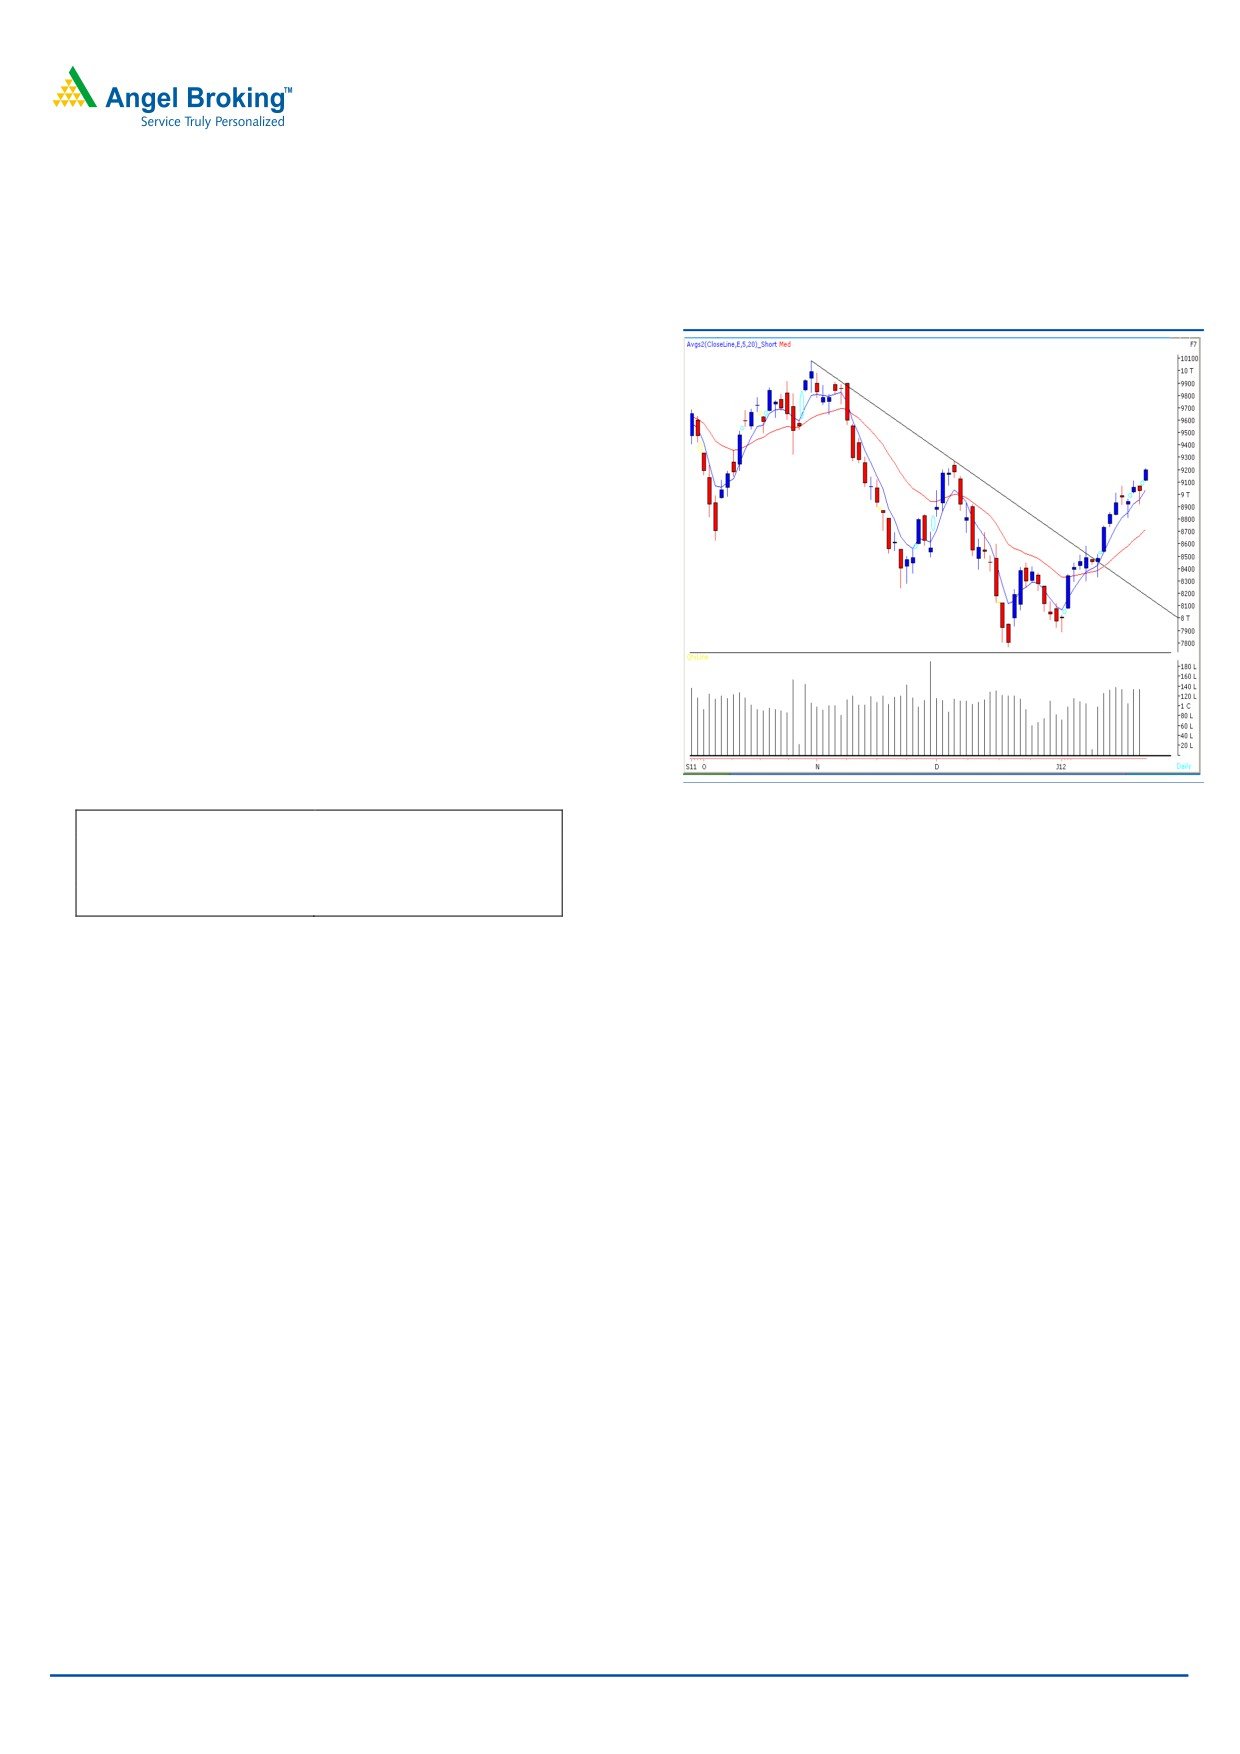
Bank Nifty Outlook - (9199)
Exhibit 2: Bank Nifty Daily Chart
Yesterday, once again Bank Nifty opened with an upside
gap, and gained momentum as the day progressed to close
near day’s high. However, we are observing narrow range
body formation on the hourly chart which suggests
exhaustion. The momentum oscillator stochastic is currently
placed in an overbought condition. Also on the hourly chart
we are observing a bearish formation called “Wolfe Wave”
This formation needs confirmation in the form of a move
below 9130. In this case the Index is likely to correct towards
8900 - 8850 levels. On the other hand only if the index
manages to sustain above yesterday’s high of 9213 then it is
likely to test the resistance zone of 9275 - 9323.
Actionable points:
Source: Falcon
View
Bearish
Sell Below
9130
Expected target
8900 - 8850
Resistance level
9275 - 9323
For Private Circulation Only |
2
Technical Research | January 20, 2012
Positive Bias:
Expected
Stock Name
CMP
5 Day EMA
20 Day EMA
Remarks
Target
Lupin
443.1
435.7
437.1
454
View will change below 432.5
Negative Bias:
Expected
Stock Name
CMP
5 Day EMA
20 Day EMA
Remarks
Target
M&M
672.9
683.4
682.1
640
View will change above 697
For Private Circulation Only |
3
Technical Research | January 20, 2012
Daily Pivot Levels for Nifty 50 Stocks
SCRIPS
S2
S1
PIVOT
R1
R2
SENSEX
16,536
16,590
16,626
16,680
16,716
NIFTY
4,979
4,998
5,011
5,031
5,043
BANKNIFTY
9,067
9,133
9,173
9,239
9,279
ACC
1,109
1,130
1,154
1,175
1,199
AMBUJACEM
156
158
160
162
164
AXISBANK
935
945
953
963
971
BAJAJ-AUTO
1,401
1,434
1,458
1,492
1,516
BHARTIARTL
332
336
341
345
349
BHEL
254
260
269
275
284
BPCL
524
533
541
550
557
CAIRN
340
344
348
352
356
CIPLA
325
328
332
336
339
DLF
201
206
209
213
216
DRREDDY
1,638
1,669
1,686
1,718
1,735
GAIL
363
366
369
372
375
HCLTECH
412
415
419
423
426
HDFC
681
687
691
697
701
HDFCBANK
476
481
486
491
496
HEROMOTOCO
1,841
1,873
1,902
1,935
1,964
HINDALCO
140
143
145
148
150
HINDUNILVR
384
388
392
395
399
ICICIBANK
772
785
793
806
815
IDFC
117
119
121
123
124
INFY
2,552
2,573
2,598
2,619
2,644
ITC
207
208
209
211
212
JINDALSTEL
503
510
516
523
529
JPASSOCIAT
62
64
66
68
69
KOTAKBANK
461
468
471
478
481
LT
1,233
1,255
1,268
1,290
1,304
M&M
654
663
680
690
706
MARUTI
1,096
1,113
1,124
1,141
1,152
NTPC
162
167
170
174
177
ONGC
261
266
270
276
280
PNB
901
906
911
917
922
POWERGRID
98
99
100
101
102
RANBAXY
454
459
462
467
470
RCOM
88
90
91
93
94
RELCAPITAL
317
323
329
336
341
RELIANCE
774
780
788
794
802
RELINFRA
431
458
474
501
517
RPOWER
90
92
93
95
96
SAIL
89
90
92
93
94
SBIN
1,853
1,869
1,891
1,906
1,928
SESAGOA
183
186
190
193
197
SIEMENS
729
737
746
754
763
STER
107
111
113
118
120
SUNPHARMA
508
518
525
534
542
SUZLON
22
22
23
23
23
TATAMOTORS
215
216
218
220
222
TATAPOWER
96
100
102
106
108
TATASTEEL
424
430
436
442
448
TCS
1,053
1,064
1,077
1,088
1,100
WIPRO
394
399
404
409
414
Technical Research Team
For Private Circulation Only |
4
Technical Report
RESEARCH TEAM
Shardul Kulkarni
Head - Technicals
Sameet Chavan
Technical Analyst
Sacchitanand Uttekar
Technical Analyst
Mehul Kothari
Technical Analyst
Ankur Lakhotia
Technical Analyst
Research Team: 022-3952 6600
DISCLAIMER: This document is not for public distribution and has been furnished to you solely for your information and must not
be reproduced or redistributed to any other person. Persons into whose possession this document may come are required to observe
these restrictions.
Opinion expressed is our current opinion as of the date appearing on this material only. While we endeavor to update on a
reasonable basis the information discussed in this material, there may be regulatory, compliance, or other reasons that prevent us
from doing so. Prospective investors and others are cautioned that any forward-looking statements are not predictions and may be
subject to change without notice. Our proprietary trading and investment businesses may make investment decisions that are
inconsistent with the recommendations expressed herein.
The information in this document has been printed on the basis of publicly available information, internal data and other reliable
sources believed to be true and are for general guidance only. While every effort is made to ensure the accuracy and completeness of
information contained, the company takes no guarantee and assumes no liability for any errors or omissions of the information. No
one can use the information as the basis for any claim, demand or cause of action.
Recipients of this material should rely on their own investigations and take their own professional advice. Each recipient of this
document should make such investigations as it deems necessary to arrive at an independent evaluation of an investment in the
securities of companies referred to in this document (including the merits and risks involved), and should consult their own advisors to
determine the merits and risks of such an investment. Price and value of the investments referred to in this material may go up or
down. Past performance is not a guide for future performance. Certain transactions - futures, options and other derivatives as well as
non-investment grade securities - involve substantial risks and are not suitable for all investors. Reports based on technical analysis
centers on studying charts of a stock's price movement and trading volume, as opposed to focusing on a company's fundamentals
and as such, may not match with a report on a company's fundamentals.
We do not undertake to advise you as to any change of our views expressed in this document. While we would endeavor to update
the information herein on a reasonable basis, Angel Broking, its subsidiaries and associated companies, their directors and
employees are under no obligation to update or keep the information current. Also there may be regulatory, compliance, or other
reasons that may prevent Angel Broking and affiliates from doing so. Prospective investors and others are cautioned that any
forward-looking statements are not predictions and may be subject to change without notice.
Angel Broking Limited and affiliates, including the analyst who has issued this report, may, on the date of this report, and from time
to time, have long or short positions in, and buy or sell the securities of the companies mentioned herein or engage in any other
transaction involving such securities and earn brokerage or compensation or act as advisor or have other potential conflict of interest
with respect to company/ies mentioned herein or inconsistent with any recommendation and related information and opinions.
Angel Broking Limited and affiliates may seek to provide or have engaged in providing corporate finance, investment banking or
other advisory services in a merger or specific transaction to the companies referred to in this report, as on the date of this report or
in the past.
Sebi Registration No : INB 010996539
For Private Circulation Only |