Technical Research | October 20, 2011
Daily Technical Report
Sensex (17085) / NIFTY (5139)
Markets opened with a decent upside gap and traded with
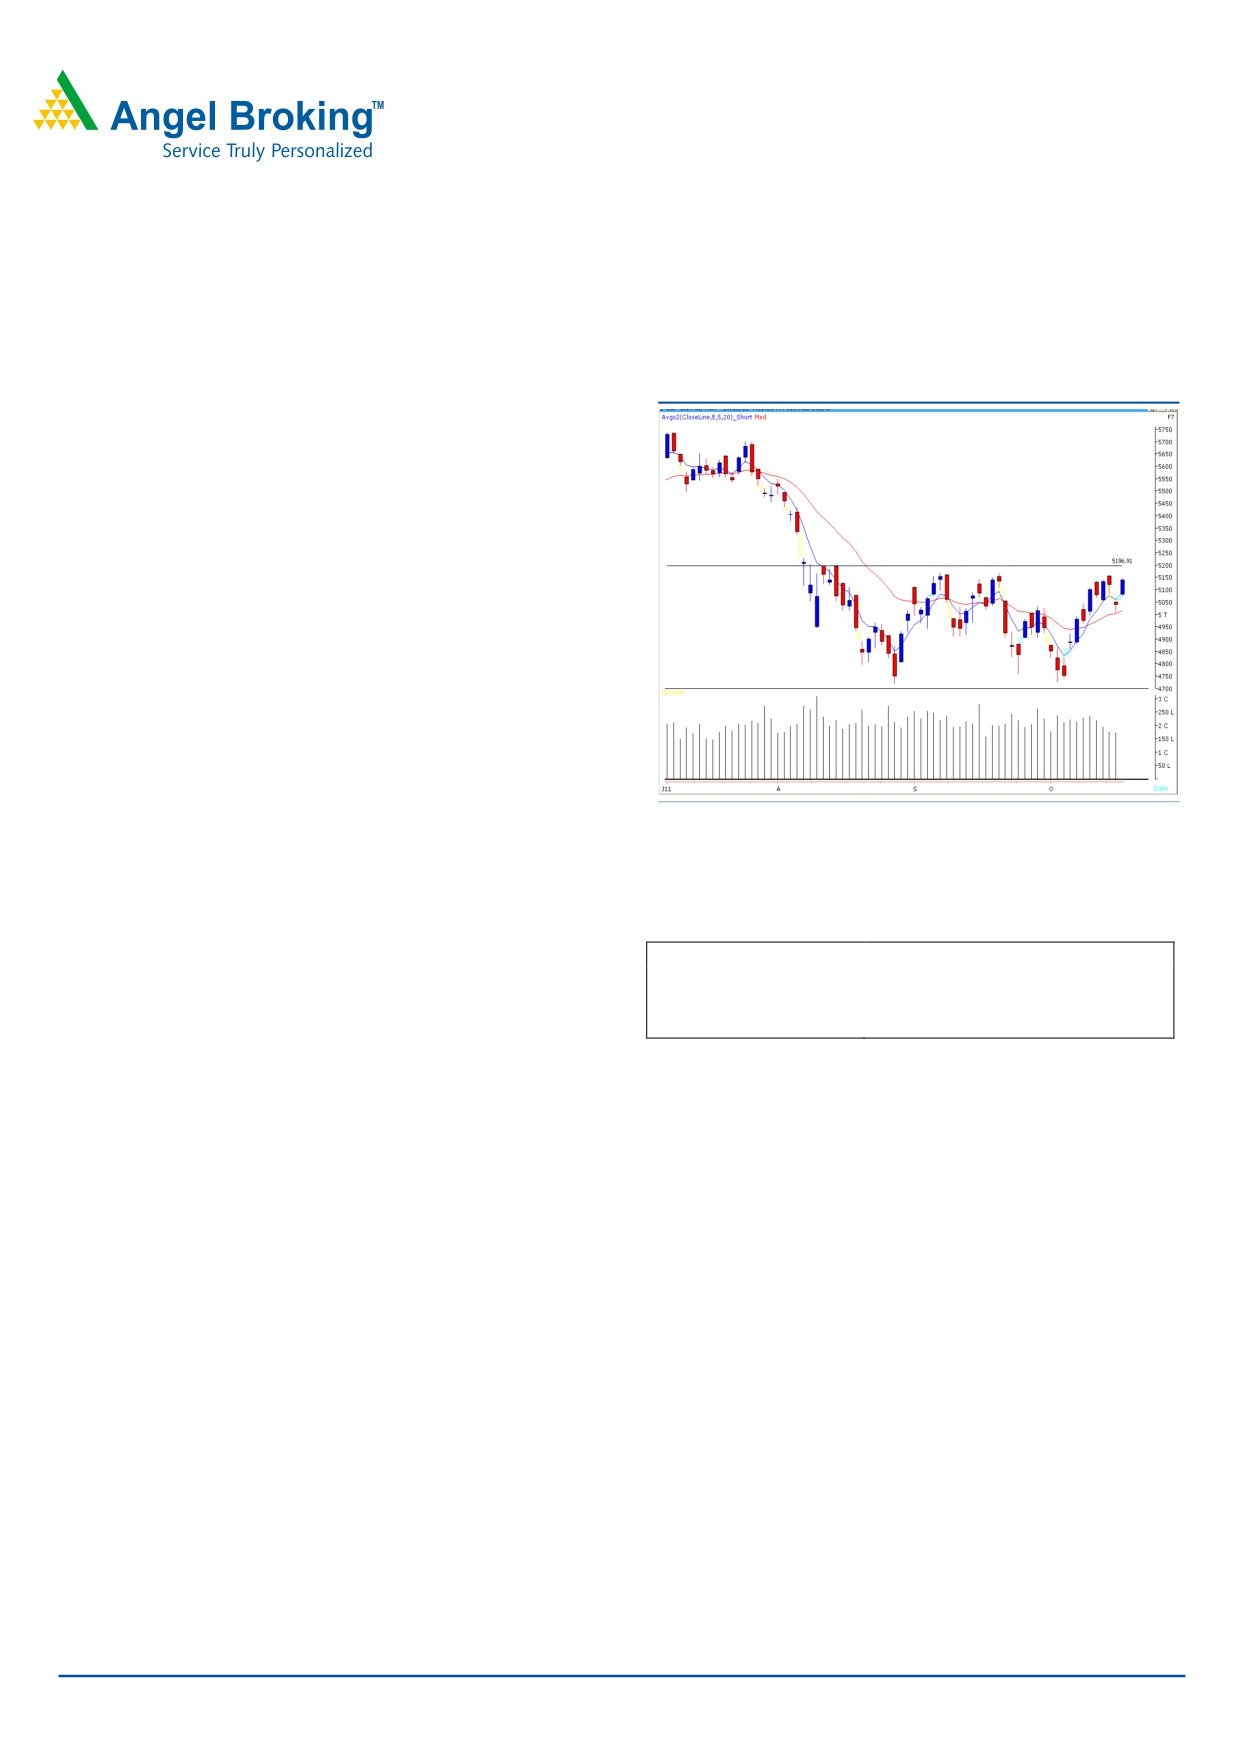
Exhibit 1: Nifty Daily Chart
strong positive momentum throughout the day to close
nearly 2% higher than Tuesday’s closing level. On the
sector front, Realty, Banking and Oil & Gas counters
contributed major part of yesterday’s gain. There was no
sector in the negative territory. The advance decline ratio
was strongly in favor of advancing counters (A=1670
Formation
• On the Daily as well as Weekly chart, there is a
“Horizontal Trend Line” resistance at 17256 / 5198 level.
• The “20 EMA” on the Daily chart is placed at 16640 /
5000 level.
Source: Falcon
Trading strategy:
Actionable points:
Markets opened with an upside gap and surged higher as
View
Neutral
the day progressed. Thus, the gap remained unfilled and
Resistance Levels
5177 - 5198
strong positive momentum led indices towards the
Support Levels
5075 - 5057
mentioned level of
17110
/
5140. Going forward,
yesterday’s unfilled gap area of 16874 and 16824 / 5057
and 5075 may act as a support in coming trading session.
On the upside, the buying interest may be seen if indices
manage to sustain above yesterday’s high of 17107 /
5148. Subsequently, they are likely to rally towards the
resistance zone of 17260 - 17300 / 5177 - 5198. A move
beyond this level would attract strong buying interest, which
may push indices higher to test the gap area of 17358 -
17665 / 5230 - 5323 created on August 5, 2011.
We would advise traders to adopt a stock specific approach
and trade with strict stop losses.
For Private Circulation Only |
1
Technical Research | October 20, 2011
Bank Nifty Outlook - (9841)
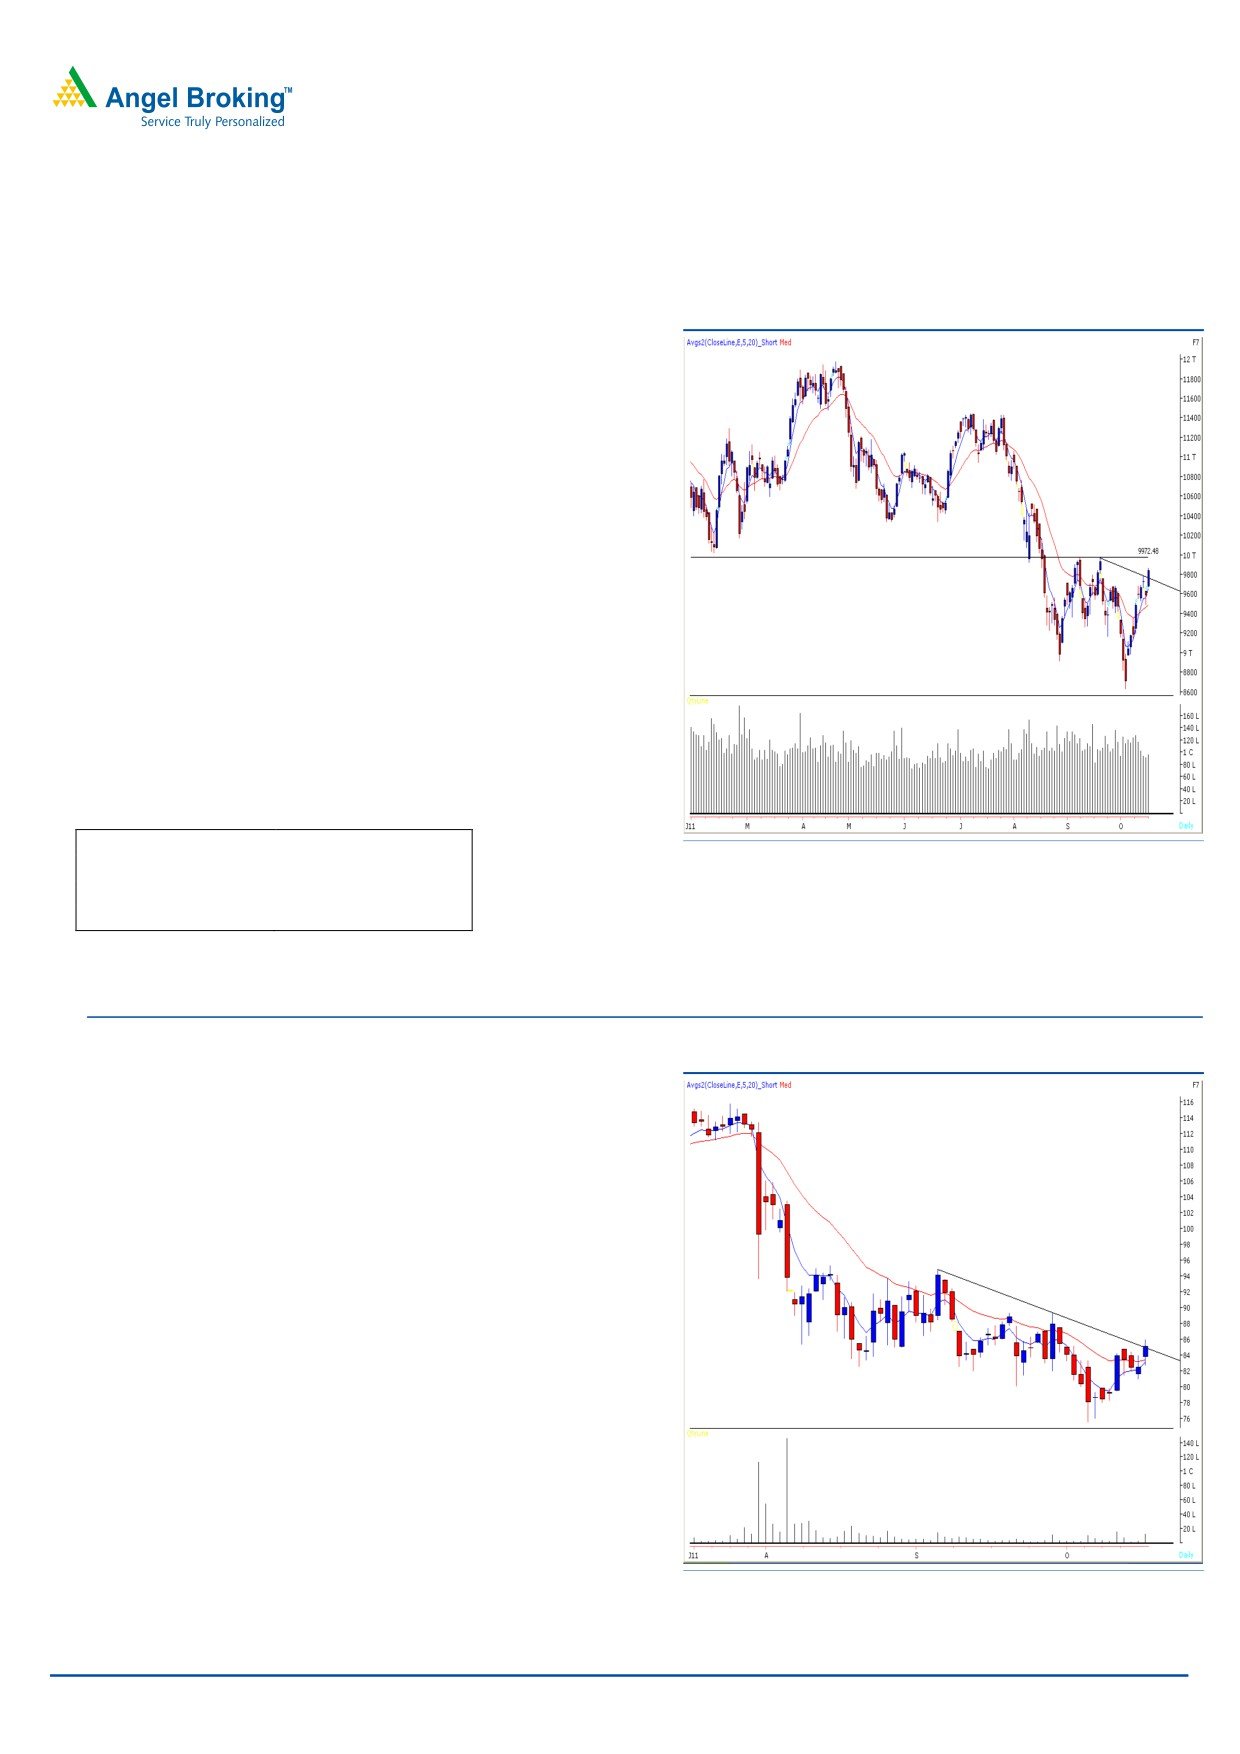
Exhibit 2: Bank Nifty Daily Chart
Bank nifty opened with an upward gap and gained strength
as the day progressed to close near day’s high. As
mentioned in our previous report, the bullish “Hammer”
pattern got confirmed yesterday as Bank Nifty managed to
close above 9635 level. We are also witnessing a trend line
breakout on daily chart by joining the high of September 21,
2011 and October 17, 2011. If Bank Nifty sustains above
yesterday’s high of 9866 then it is likely to test 9970 -
10030 levels. These levels coincide with multiple resistance
of “Horizontal Line”. Therefore, some profit booking or
consolidation is likely to take place if Bank Nifty manages to
rally towards these levels.
On the downside, 9750 - 9580 levels may act as support
levels for the day.
Actionable points:
View
Mildly bullish
Source: Falcon
Positive Above
9866
Expected Target
9970 - 10030
Support Level
9750 - 9580
Stock Recommendations:
Exhibit 3: Adani Power Daily chart
Stock - Adani Power (Nse Cash)
Action - Buy
Last close
` 85.10
Buying Range ` 83.50 - 84.50
Stop Loss
` 80.90
Target
` 91.50
Justification - On the daily chart, the stock has managed to
break out from the downward sloping trend line at ` 84.70
with significant rise in volumes. Further, the placement of “5
& 20 EMA” suggests possibility of a positive movement in
coming trading sessions. Therefore, we advise traders to
buy this stock in a range of ` 83.50 - 84.50 for a target of
` 91.50 in coming 3 - 4 trading sessions.
Source: Falcon
For Private Circulation Only |
2
Technical Research | October 20, 2011
Positive Bias:
Stock Name
5 Day EMA
20 Day EMA
Expected Target
Remarks
Bharti Airtel
378.7
378
395
View will change below 370
NTPC
171
170
174.5
View will change below 167
Hind Petro
347
359
359
View will change below 336.5
Negative Bias:
Stock Name
5 Day EMA
20 Day EMA
Expected Target
Remarks
Tata Steel
435.1
437
423
View will change above 438
Hindalco
128
131.6
124
View will change above 128.5
For Private Circulation Only |
3
Technical Research | October 20, 2011
Daily Pivot Levels for Nifty 50 Stocks
SCRIPS
S2
S1
PIVOT
R1
R2
SENSEX
16,790
16,937
17,022
17,170
17,255
NIFTY
5,048
5,094
5,121
5,166
5,194
BANKNIFTY
9,601
9,721
9,793
9,914
9,986
ACC
1,092
1,109
1,122
1,139
1,151
AMBUJACEM
151
153
155
157
158
AXISBANK
1,094
1,113
1,124
1,144
1,154
BAJAJ-AUTO
1,609
1,623
1,635
1,649
1,662
BHARTIARTL
366
375
381
390
396
BHEL
320
322
324
327
329
BPCL
632
640
646
653
659
CAIRN
294
297
300
303
306
CIPLA
283
286
289
292
294
DLF
230
235
238
242
245
DRREDDY
1,487
1,503
1,512
1,528
1,537
GAIL
406
416
422
432
439
HCLTECH
399
403
408
413
418
HDFC
664
669
675
679
685
HDFCBANK
473
483
489
498
504
HEROMOTOCO
2,016
2,041
2,067
2,093
2,118
HINDALCO
126
127
128
129
129
HINDUNILVR
325
328
331
334
337
ICICIBANK
880
892
900
912
920
IDFC
121
124
126
129
130
INFY
2,687
2,708
2,721
2,741
2,755
ITC
202
205
206
209
210
JINDALSTEL
509
520
527
537
545
JPASSOCIAT
70
72
73
74
75
KOTAKBANK
463
469
473
479
482
LT
1,339
1,370
1,387
1,418
1,435
M&M
802
806
812
816
822
MARUTI
1,042
1,054
1,064
1,076
1,086
NTPC
167
169
171
174
175
ONGC
260
264
267
271
274
PNB
963
971
978
986
993
POWERGRID
98
99
100
101
102
RANBAXY
496
506
511
520
525
RCOM
74
75
76
77
78
RELCAPITAL
321
327
331
338
342
RELIANCE
816
830
837
851
858
RELINFRA
404
409
413
418
422
RPOWER
85
86
87
88
89
SAIL
103
105
106
108
109
SBIN
1,872
1,895
1,909
1,933
1,947
SESAGOA
204
209
217
222
230
SIEMENS
805
819
827
841
849
STER
116
117
119
121
123
SUNPHARMA
461
472
479
490
496
SUZLON
35
36
37
37
38
TATAMOTORS
182
184
186
189
191
TATAPOWER
99
99
100
101
102
TATASTEEL
426
430
434
438
442
TCS
1,027
1,038
1,046
1,057
1,065
WIPRO
342
350
354
362
367
Technical Research Team
For Private Circulation Only |
4
Technical Report
RESEARCH TEAM
Shardul Kulkarni
Head - Technicals
Sameet Chavan
Technical Analyst
Sacchitanand Uttekar
Technical Analyst
Mehul Kothari
Technical Analyst
Ankur Lakhotia
Technical Analyst
Research Team: 022-3952 6600
DISCLAIMER: This document is not for public distribution and has been furnished to you solely for your information and must not
be reproduced or redistributed to any other person. Persons into whose possession this document may come are required to observe
these restrictions.
Opinion expressed is our current opinion as of the date appearing on this material only. While we endeavor to update on a
reasonable basis the information discussed in this material, there may be regulatory, compliance, or other reasons that prevent us
from doing so. Prospective investors and others are cautioned that any forward-looking statements are not predictions and may be
subject to change without notice. Our proprietary trading and investment businesses may make investment decisions that are
inconsistent with the recommendations expressed herein.
The information in this document has been printed on the basis of publicly available information, internal data and other reliable
sources believed to be true and are for general guidance only. While every effort is made to ensure the accuracy and completeness of
information contained, the company takes no guarantee and assumes no liability for any errors or omissions of the information. No
one can use the information as the basis for any claim, demand or cause of action.
Recipients of this material should rely on their own investigations and take their own professional advice. Each recipient of this
document should make such investigations as it deems necessary to arrive at an independent evaluation of an investment in the
securities of companies referred to in this document (including the merits and risks involved), and should consult their own advisors to
determine the merits and risks of such an investment. Price and value of the investments referred to in this material may go up or
down. Past performance is not a guide for future performance. Certain transactions - futures, options and other derivatives as well as
non-investment grade securities - involve substantial risks and are not suitable for all investors. Reports based on technical analysis
centers on studying charts of a stock's price movement and trading volume, as opposed to focusing on a company's fundamentals
and as such, may not match with a report on a company's fundamentals.
We do not undertake to advise you as to any change of our views expressed in this document. While we would endeavor to update
the information herein on a reasonable basis, Angel Broking, its subsidiaries and associated companies, their directors and
employees are under no obligation to update or keep the information current. Also there may be regulatory, compliance, or other
reasons that may prevent Angel Broking and affiliates from doing so. Prospective investors and others are cautioned that any
forward-looking statements are not predictions and may be subject to change without notice.
Angel Broking Limited and affiliates, including the analyst who has issued this report, may, on the date of this report, and from time
to time, have long or short positions in, and buy or sell the securities of the companies mentioned herein or engage in any other
transaction involving such securities and earn brokerage or compensation or act as advisor or have other potential conflict of interest
with respect to company/ies mentioned herein or inconsistent with any recommendation and related information and opinions.
Angel Broking Limited and affiliates may seek to provide or have engaged in providing corporate finance, investment banking or
other advisory services in a merger or specific transaction to the companies referred to in this report, as on the date of this report or
in the past.
Sebi Registration No : INB 010996539
For Private Circulation Only |