Technical Research | April 19, 2012
Daily Technical Report
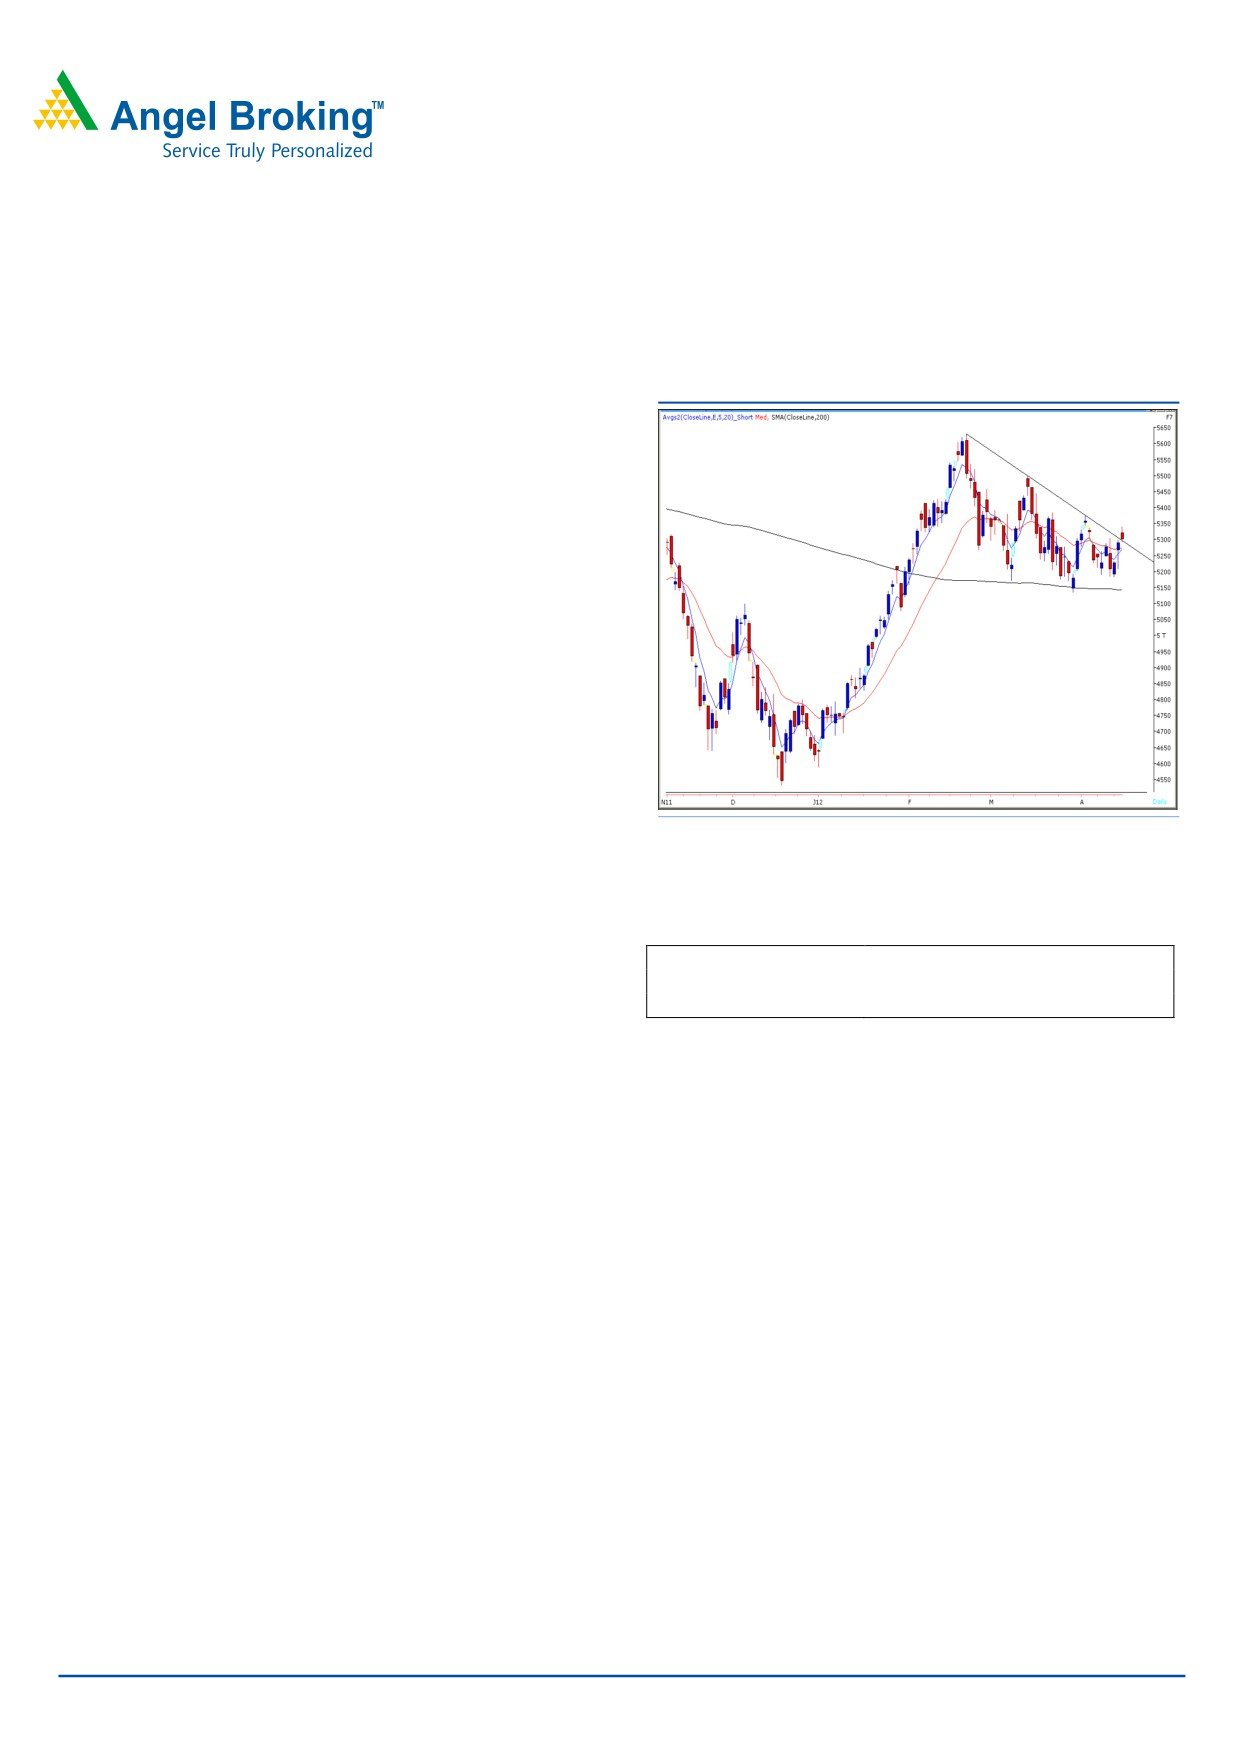
Sensex (17392) / NIFTY (5300)
Exhibit 1: Nifty Daily Chart
Yesterday, our benchmark indices opened on a higher note
in-line with positive cues from US and European bourses.
Subsequently, minor profit booking in selective large cap
counters dragged indices to close at the 5300 mark. On the
sectoral front, Auto and Health Care counters were among
the major gainers, whereas Realty counters ended on the
losing side. The advance to decline ratio was strongly in
favor of advancing counters (A=1625 D=1251) (Source -
Formation:
• The 200-day SMA (Simple Moving Average) and 20-
day EMA (Exponential Moving Average) have now shifted to
Source: Falcon
17100 / 5150 and 17324 / 5271, respectively.
• The ‘20-Week EMA’ is placed at 17200 / 5200 level.
Actionable points:
• We are witnessing a ‘Downward Sloping Trend Line’
breakout around 17400 / 5300 level.
View
Positive Above 5307
Expected Targets
5330 - 5379
Support Levels
5240 - 5170
Trading strategy:
Yesterday, we witnessed a gap up opening well above the
mentioned ‘Downward Sloping Trend Line’ resistance of
17400 / 5300 level, indices slipped nominally towards the
end of the session. This move above 5300 can be construed
as a breakout above the resistance zone and signals high
probability of an upside move. Going forward, once indices
manage to sustain above 17400 / 5307, they are likely to
rally towards the next resistance zone of -17664 - 17687/
5380 - 5386. O the downside, 17371 - 17293 / 5293 -
5266 will now act as a decent support for the markets.
For Private Circulation Only |
1
Technical Research | April 19, 2012
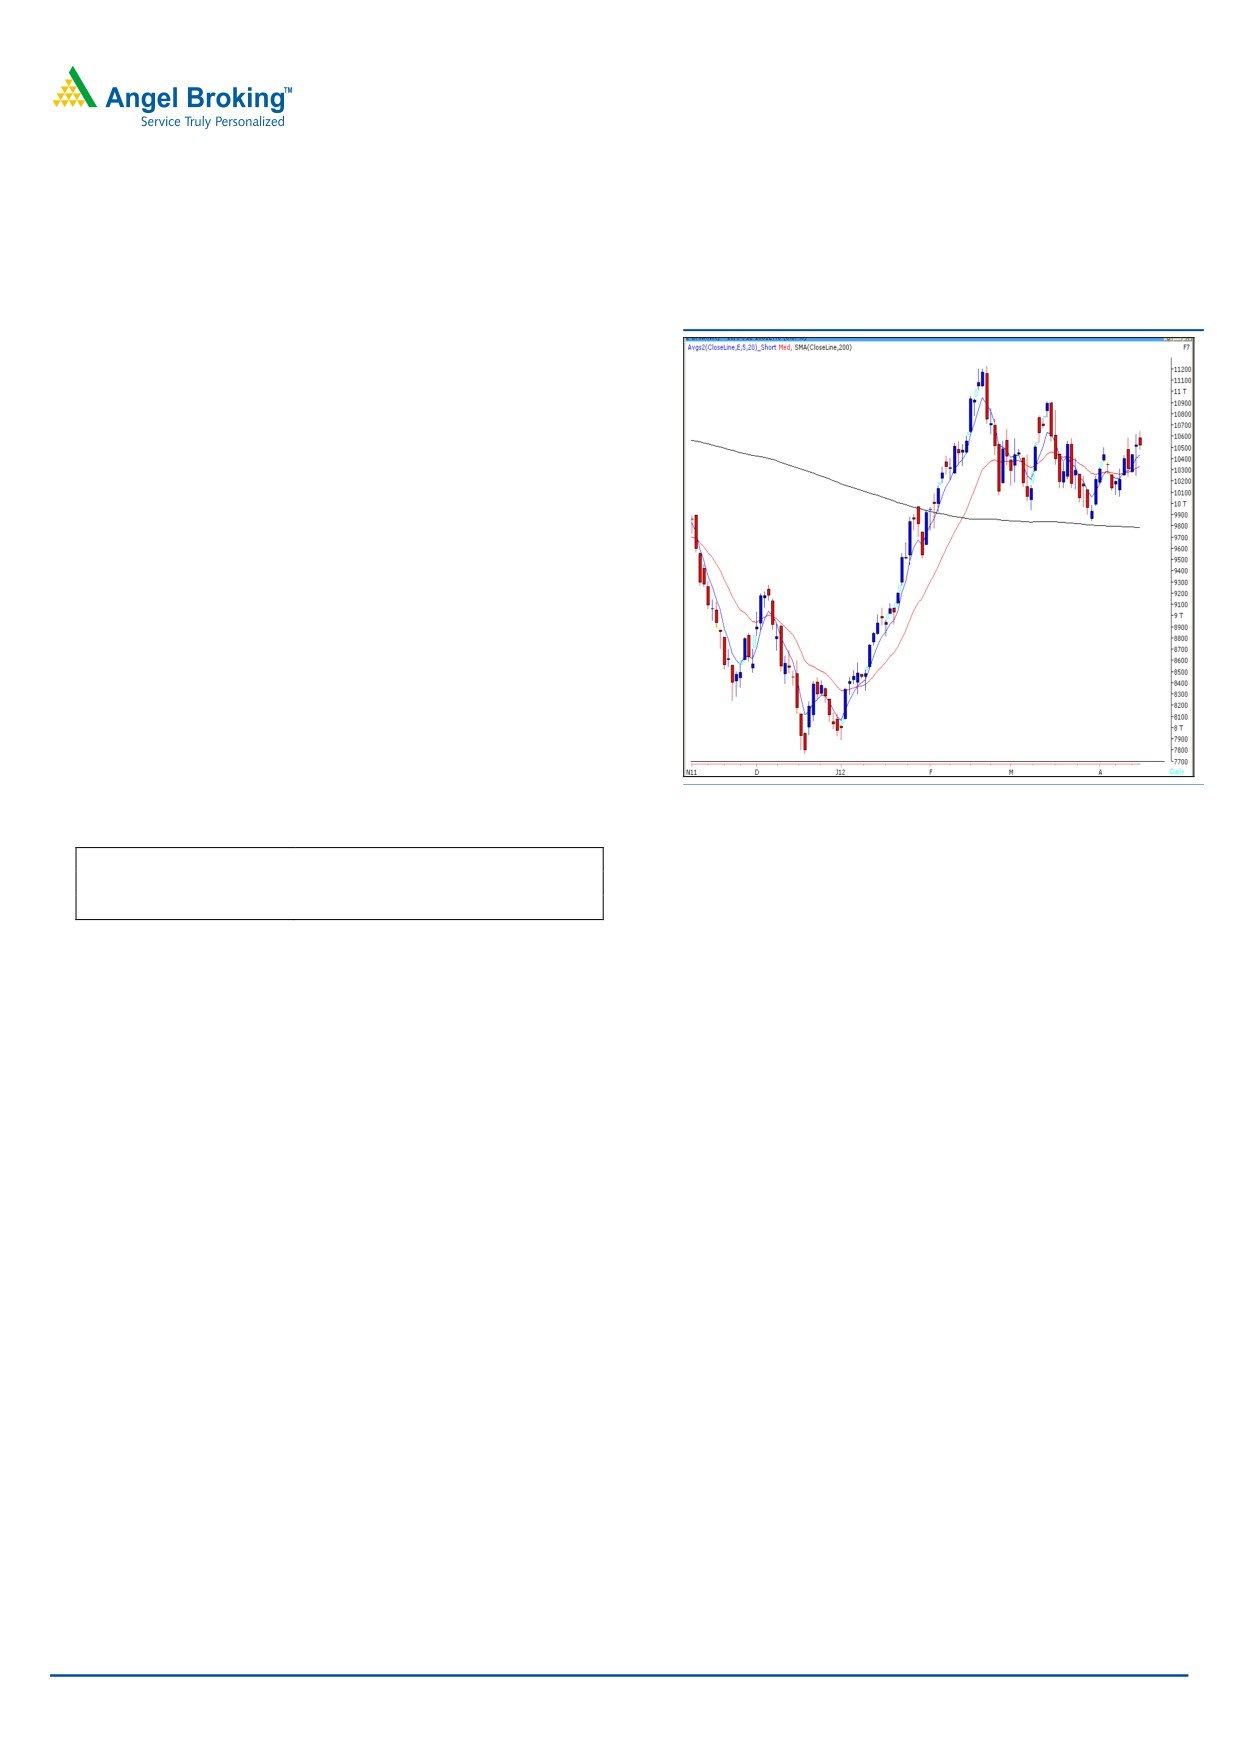
Bank Nifty Outlook - (10512)
Exhibit 2: Bank Nifty Daily Chart
Yesterday, Bank Nifty opened on a flat note and traded in
a narrow range throughout the session. We are
witnessing a “Spinning Top” candlestick pattern which is a
sign of indecisiveness prevailing at current levels. We are
even witnessing a negative crossover in “RSI
-
Smoothened” oscillator on the hourly chart. Hence, we
reiterate our view that the index is in a trading range of
10650 - 10150. Only a sustainable move outside the
mentioned range will dictate a clear direction of the
trend. Thus on the upside 10625 - 10650 levels are likely
to act as resistance zone and on the downside 10350 -
10250 levels are likely to act as support in coming
trading session.
Actionable points:
Source: Falcon
View
Neutral
Resistance Levels
10625 - 10650
Support Levels
10350 - 10250
For Private Circulation Only |
2
Technical Research | April 19, 2012
Positive Bias:
Positive
Expected
Stock Name
CMP
5 Day EMA
20 Day EMA
Remarks
Above
Target
View will change below
ONGC
271.30
266.7
268.3
273.4
280
269
ESCORTS
76.7
75.6
74.2
78
81
View will change below 74
For Private Circulation Only |
3
Technical Research | April 19, 2012
Daily Pivot Levels for Nifty 50 Stocks
SCRIPS
S2
S1
PIVOT
R1
R2
SENSEX
17,278
17,335
17,429
17,486
17,580
NIFTY
5,263
5,282
5,312
5,330
5,360
BANKNIFTY
10,380
10,446
10,546
10,612
10,712
ACC
1,242
1,270
1,289
1,317
1,336
AMBUJACEM
160
163
166
169
171
AXISBANK
1,167
1,181
1,204
1,219
1,241
BAJAJ-AUTO
1,653
1,684
1,710
1,741
1,767
BHARTIARTL
317
319
323
325
329
BHEL
255
258
263
265
270
BPCL
686
692
697
703
707
CAIRN
336
343
347
354
359
CIPLA
309
311
316
318
322
COALINDIA
342
345
349
353
357
DLF
194
198
203
206
211
DRREDDY
1,737
1,752
1,767
1,782
1,796
GAIL
357
362
369
374
381
HCLTECH
480
487
499
506
518
HDFC
672
676
683
687
695
HDFCBANK
530
534
537
541
544
HEROMOTOCO
2,110
2,126
2,144
2,160
2,178
HINDALCO
127
129
131
132
134
HINDUNILVR
419
421
422
425
426
ICICIBANK
864
872
886
895
908
IDFC
127
129
133
135
139
INFY
2,329
2,350
2,376
2,398
2,424
ITC
236
239
244
246
251
JINDALSTEL
504
509
514
520
525
JPASSOCIAT
80
81
83
84
85
KOTAKBANK
569
574
582
587
594
LT
1,299
1,312
1,331
1,344
1,364
M&M
683
687
691
696
699
MARUTI
1,333
1,343
1,355
1,364
1,376
NTPC
166
167
168
169
171
ONGC
267
269
271
273
276
PNB
907
916
927
935
946
POWERGRID
112
113
114
115
116
RANBAXY
502
505
509
513
517
RCOM
84
85
88
89
92
RELIANCE
735
742
749
756
763
RELINFRA
567
573
584
590
601
RPOWER
115
116
118
120
122
SAIL
95
96
97
98
99
SBIN
2,238
2,265
2,302
2,329
2,367
SESAGOA
188
190
192
193
195
SIEMENS
808
819
830
841
851
STER
108
108
110
111
112
SUNPHARMA
582
589
595
603
609
SUZLON
24
24
24
24
25
TATAMOTORS
300
305
308
313
316
TATAPOWER
103
105
106
108
109
TATASTEEL
458
462
467
470
475
TCS
1,081
1,089
1,102
1,110
1,123
WIPRO
422
425
427
430
432
Technical Research Team
For Private Circulation Only |
4
Technical Report
RESEARCH TEAM
Shardul Kulkarni
Head - Technicals
Sameet Chavan
Technical Analyst
Sacchitanand Uttekar
Technical Analyst
Mehul Kothari
Technical Analyst
Ankur Lakhotia
Technical Analyst
Research Team: 022-3952 6600
DISCLAIMER: This document is not for public distribution and has been furnished to you solely for your information and must not
be reproduced or redistributed to any other person. Persons into whose possession this document may come are required to observe
these restrictions.
Opinion expressed is our current opinion as of the date appearing on this material only. While we endeavor to update on a
reasonable basis the information discussed in this material, there may be regulatory, compliance, or other reasons that prevent us
from doing so. Prospective investors and others are cautioned that any forward-looking statements are not predictions and may be
subject to change without notice. Our proprietary trading and investment businesses may make investment decisions that are
inconsistent with the recommendations expressed herein.
The information in this document has been printed on the basis of publicly available information, internal data and other reliable
sources believed to be true and are for general guidance only. While every effort is made to ensure the accuracy and completeness of
information contained, the company takes no guarantee and assumes no liability for any errors or omissions of the information. No
one can use the information as the basis for any claim, demand or cause of action.
Recipients of this material should rely on their own investigations and take their own professional advice. Each recipient of this
document should make such investigations as it deems necessary to arrive at an independent evaluation of an investment in the
securities of companies referred to in this document (including the merits and risks involved), and should consult their own advisors to
determine the merits and risks of such an investment. Price and value of the investments referred to in this material may go up or
down. Past performance is not a guide for future performance. Certain transactions - futures, options and other derivatives as well as
non-investment grade securities - involve substantial risks and are not suitable for all investors. Reports based on technical analysis
centers on studying charts of a stock's price movement and trading volume, as opposed to focusing on a company's fundamentals
and as such, may not match with a report on a company's fundamentals.
We do not undertake to advise you as to any change of our views expressed in this document. While we would endeavor to update
the information herein on a reasonable basis, Angel Broking, its subsidiaries and associated companies, their directors and
employees are under no obligation to update or keep the information current. Also there may be regulatory, compliance, or other
reasons that may prevent Angel Broking and affiliates from doing so. Prospective investors and others are cautioned that any
forward-looking statements are not predictions and may be subject to change without notice.
Angel Broking Limited and affiliates, including the analyst who has issued this report, may, on the date of this report, and from time
to time, have long or short positions in, and buy or sell the securities of the companies mentioned herein or engage in any other
transaction involving such securities and earn brokerage or compensation or act as advisor or have other potential conflict of interest
with respect to company/ies mentioned herein or inconsistent with any recommendation and related information and opinions.
Angel Broking Limited and affiliates may seek to provide or have engaged in providing corporate finance, investment banking or
other advisory services in a merger or specific transaction to the companies referred to in this report, as on the date of this report or
in the past.
Sebi Registration No: INB 010996539
For Private Circulation Only |