Technical Research | January 19, 2012
Daily Technical Report
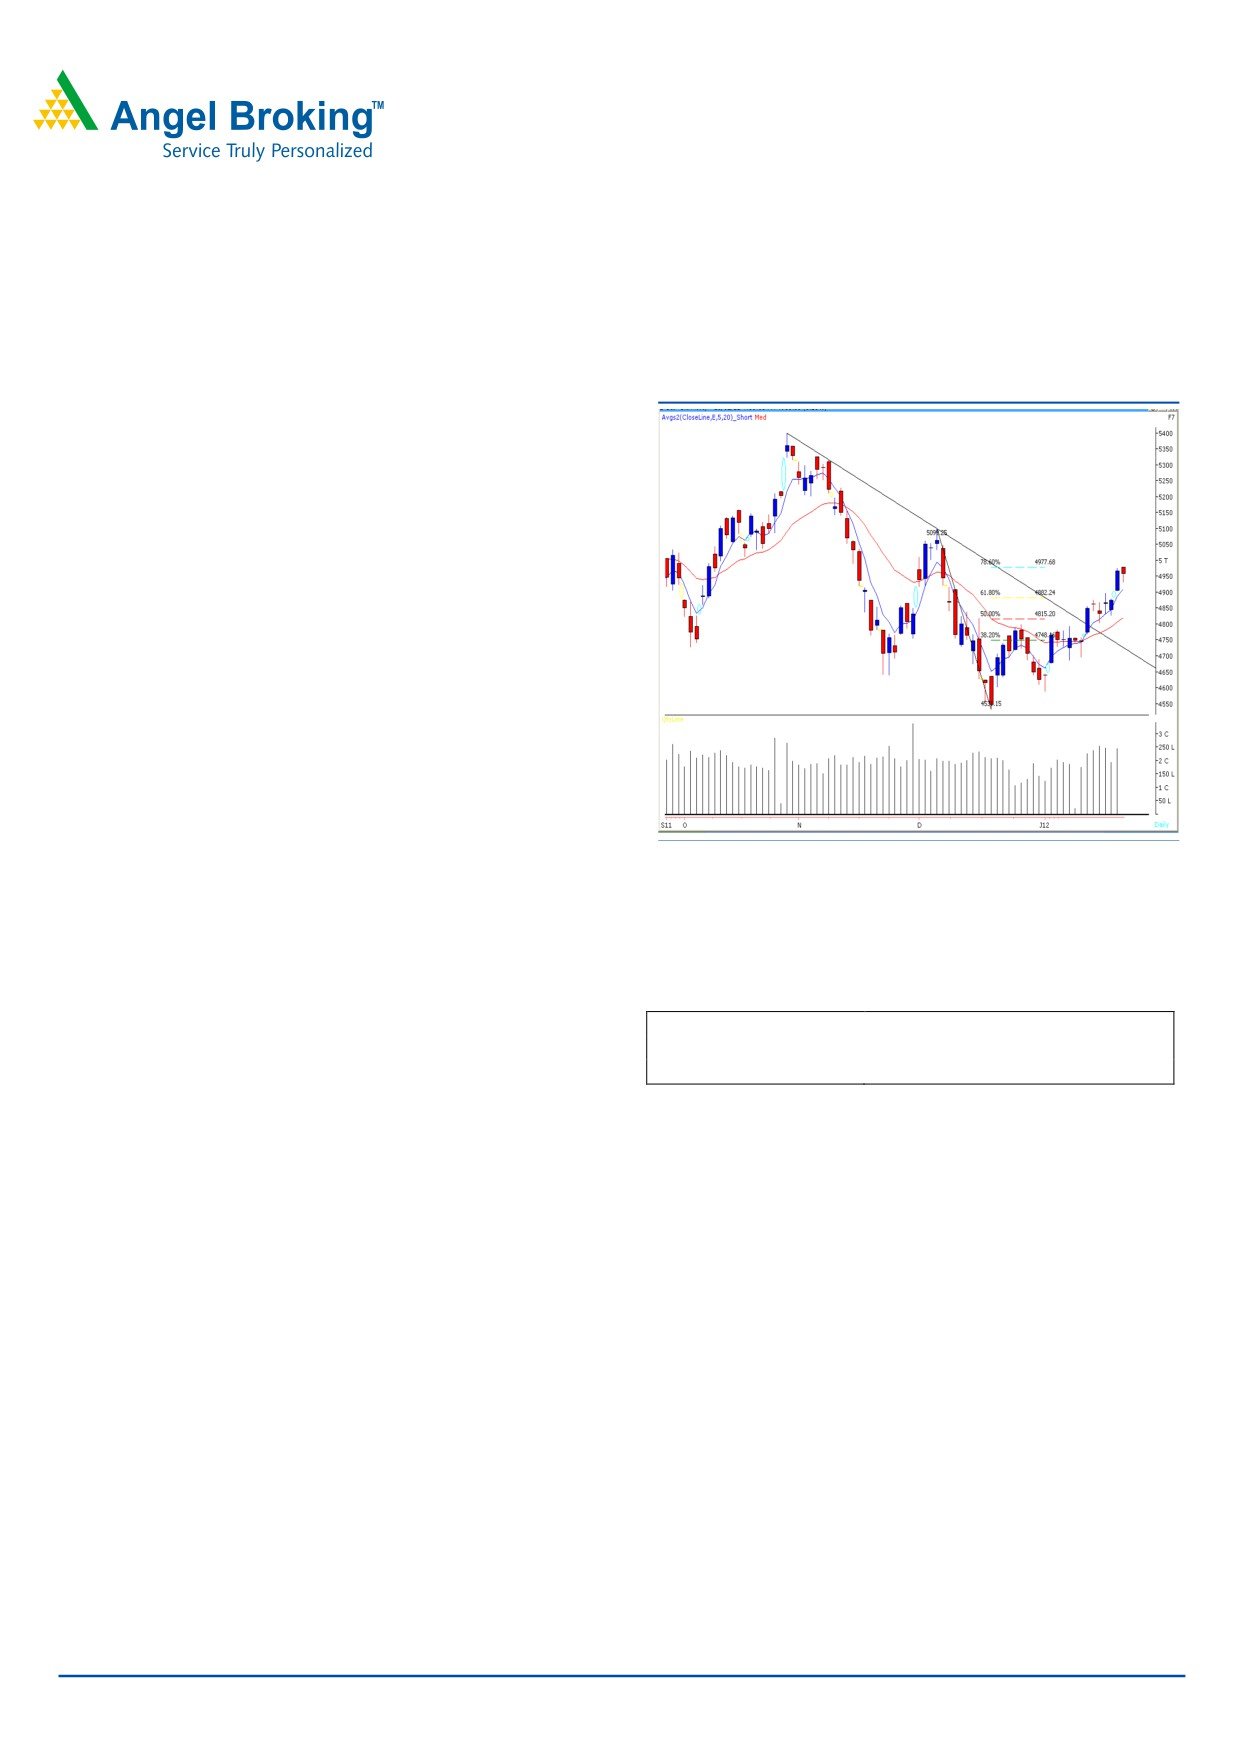
Sensex (16451) / NIFTY (4956)
Exhibit 1: Nifty Daily Chart
Yesterday, markets opened marginally higher but could not
sustain at higher levels and profit booking was seen in the
first half. Indices corrected during the mid-session to test
hourly 20 EMA placed around 16380 / 4930 level. On the
sectoral front, Metal, IT and Capital Goods sectors
corrected sharply, whereas Oil & Gas rallied during
yesterday’s session. The advance to decline ratio was in
favor of declining counters. (A=1086 D=1702) (Source -
Formation:
• The 20-day EMA (Exponential Moving Average) has
now shifted to the 16050 / 4820 level.
• The 78.6% Fibonacci retracement level of the fall from
Source: Falcon
17004 to 15135 / 5100 to 4531 is at 16600 / 4978.
Trading strategy:
Actionable points:
Markets opened marginally higher around the mentioned
View
Neutral
78.6% Fibonacci retracement resistance level of 16600 /
Resistance levels
4976- 5050
Support levels
4898 - 4827
4976. As expected, we witnessed selling pressure near this
level indices moved lower to test hourly 20 EMA which is
placed at 16380 / 4930 level. Going forward, 16600 /
4976 remains to be an important resistance. Only a
sustainable move beyond this level may lead to further up
move and indices may test 16848 - 17004 / 5050 - 5100.
We advise traders to book their profits and stay light on
positions in case the markets are able to scale to these
levels. On the downside, yesterday’s low of 16384 / 4931
would act as immediate support level. A breach of this level
may intensify selling pressure and indices may correct to test
16257 - 16037 / 4898 - 4827 levels.
For Private Circulation Only |
1
Technical Research | January 19, 2012
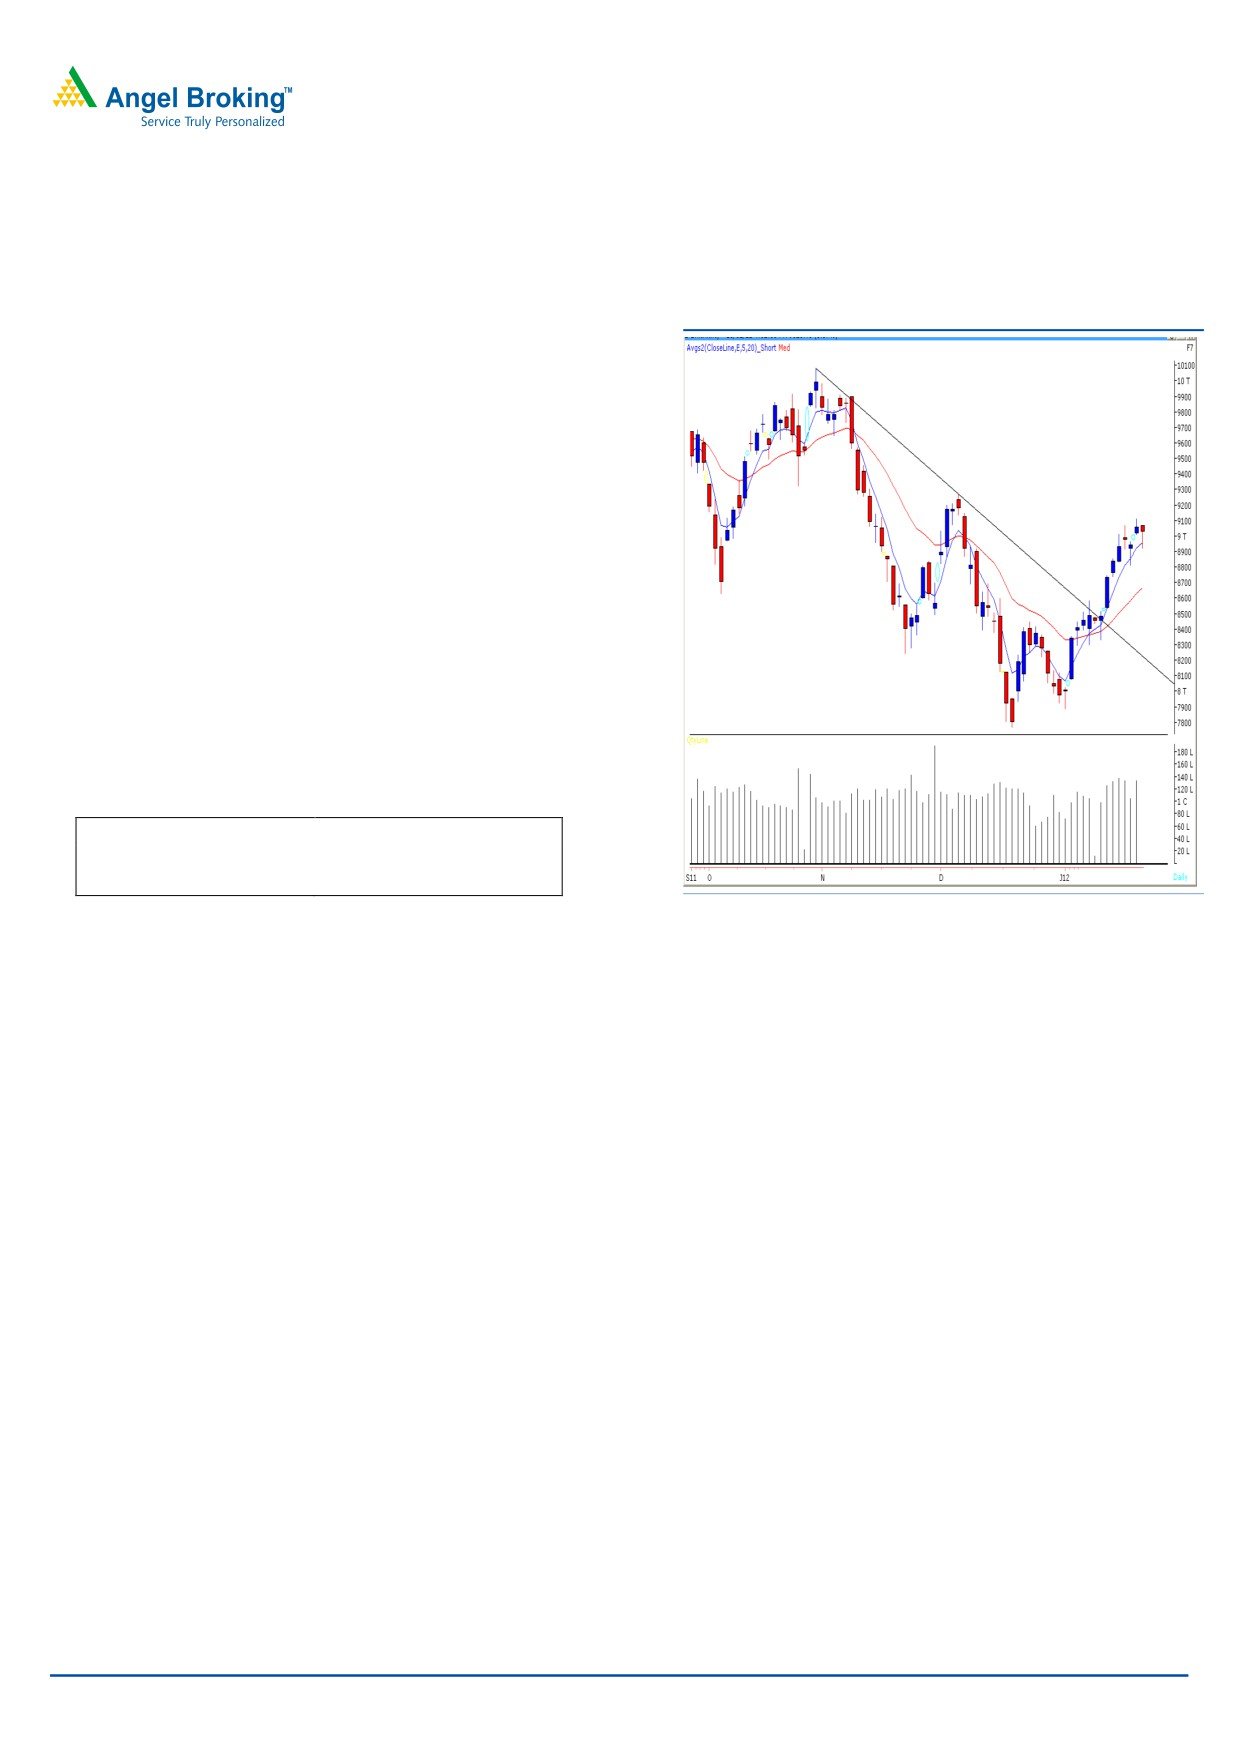
Bank Nifty Outlook - (9023)
Exhibit 2: Bank Nifty Daily Chart
Yesterday, Bank Nifty opened on a flat note and as
mentioned in our previous report, we witnessed minor
correction below the low of 9011. Bank Nifty traded with
negative bias during the first half of the trading session to
test the expected support of 8922 and finally recovered from
the day’s low to close above 9000 mark. On the Daily chart,
we are witnessing a cluster of narrow range bodies since
past few trading sessions. This indicates an exhaustion or
consolidation of the current rise from 7900 to 9100 level.
On the downside, the zone of 8922 - 8810 would now act
as a crucial support zone for coming trading session.
However, the momentum on the upside could only resume
once Bank Nifty trades convincingly above 9115 level. In
such a scenario, index can test 9275 level.
Actionable points:
View
Neutral
Resistance Levels
9115 - 9275
Support Levels
8922 - 8810
Source: Falcon
For Private Circulation Only |
2
Technical Research | January 19, 2012
Positive Bias:
Expected
Stock Name
CMP
5 Day EMA
20 Day EMA
Remarks
Target
HDFCBANK
481.9
470.1
455
495
View will change below 472
Negative Bias:
Expected
Stock Name
CMP
5 Day EMA
20 Day EMA
Remarks
Target
GAIL
365
371.6
380.5
345
View will change above 375
For Private Circulation Only |
3
Technical Research | January 19, 2012
Daily Pivot Levels for Nifty 50 Stocks
SCRIPS
S2
S1
PIVOT
R1
R2
SENSEX
16,318
16,385
16,451
16,518
16,585
NIFTY
4,906
4,931
4,956
4,981
5,005
BANKNIFTY
8,860
8,942
9,004
9,086
9,149
ACC
1,110
1,120
1,136
1,146
1,162
AMBUJACEM
155
156
158
159
161
AXISBANK
905
919
944
958
983
BAJAJ-AUTO
1,424
1,439
1,456
1,471
1,488
BHARTIARTL
339
342
347
350
355
BHEL
263
268
277
282
290
BPCL
506
521
536
551
567
CAIRN
335
340
345
350
355
CIPLA
324
328
335
340
347
DLF
194
198
201
205
208
DRREDDY
1,624
1,643
1,659
1,678
1,694
GAIL
352
359
366
373
381
HCLTECH
406
412
419
425
433
HDFC
668
675
680
687
692
HDFCBANK
463
473
479
488
495
HEROMOTOCO
1,823
1,842
1,856
1,875
1,889
HINDALCO
136
138
140
142
144
HINDUNILVR
382
387
393
398
404
ICICIBANK
751
760
771
780
791
IDFC
114
116
118
119
121
INFY
2,555
2,583
2,614
2,642
2,673
ITC
205
208
209
211
213
JINDALSTEL
489
500
509
520
530
JPASSOCIAT
61
62
63
64
66
KOTAKBANK
442
453
466
476
490
LT
1,201
1,221
1,254
1,274
1,307
M&M
652
668
689
705
726
MARUTI
1,061
1,081
1,113
1,134
1,165
NTPC
160
162
166
168
172
ONGC
258
263
266
272
275
PNB
881
891
906
916
930
POWERGRID
97
98
100
101
103
RANBAXY
439
447
456
464
473
RCOM
84
86
89
91
94
RELCAPITAL
295
306
314
325
333
RELIANCE
745
763
775
792
805
RELINFRA
419
431
439
451
458
RPOWER
87
89
91
93
95
SAIL
87
89
92
94
97
SBIN
1,801
1,833
1,852
1,884
1,903
SESAGOA
182
185
190
193
198
SIEMENS
725
735
746
756
767
STER
104
106
108
110
113
SUNPHARMA
506
512
516
522
526
SUZLON
21
22
22
23
24
TATAMOTORS
208
211
215
218
223
TATAPOWER
95
96
98
100
102
TATASTEEL
407
416
430
440
454
TCS
1,022
1,049
1,073
1,100
1,124
WIPRO
396
400
407
411
418
Technical Research Team
For Private Circulation Only |
4
Technical Report
RESEARCH TEAM
Shardul Kulkarni
Head - Technicals
Sameet Chavan
Technical Analyst
Sacchitanand Uttekar
Technical Analyst
Mehul Kothari
Technical Analyst
Ankur Lakhotia
Technical Analyst
Research Team: 022-3952 6600
DISCLAIMER: This document is not for public distribution and has been furnished to you solely for your information and must not
be reproduced or redistributed to any other person. Persons into whose possession this document may come are required to observe
these restrictions.
Opinion expressed is our current opinion as of the date appearing on this material only. While we endeavor to update on a
reasonable basis the information discussed in this material, there may be regulatory, compliance, or other reasons that prevent us
from doing so. Prospective investors and others are cautioned that any forward-looking statements are not predictions and may be
subject to change without notice. Our proprietary trading and investment businesses may make investment decisions that are
inconsistent with the recommendations expressed herein.
The information in this document has been printed on the basis of publicly available information, internal data and other reliable
sources believed to be true and are for general guidance only. While every effort is made to ensure the accuracy and completeness of
information contained, the company takes no guarantee and assumes no liability for any errors or omissions of the information. No
one can use the information as the basis for any claim, demand or cause of action.
Recipients of this material should rely on their own investigations and take their own professional advice. Each recipient of this
document should make such investigations as it deems necessary to arrive at an independent evaluation of an investment in the
securities of companies referred to in this document (including the merits and risks involved), and should consult their own advisors to
determine the merits and risks of such an investment. Price and value of the investments referred to in this material may go up or
down. Past performance is not a guide for future performance. Certain transactions - futures, options and other derivatives as well as
non-investment grade securities - involve substantial risks and are not suitable for all investors. Reports based on technical analysis
centers on studying charts of a stock's price movement and trading volume, as opposed to focusing on a company's fundamentals
and as such, may not match with a report on a company's fundamentals.
We do not undertake to advise you as to any change of our views expressed in this document. While we would endeavor to update
the information herein on a reasonable basis, Angel Broking, its subsidiaries and associated companies, their directors and
employees are under no obligation to update or keep the information current. Also there may be regulatory, compliance, or other
reasons that may prevent Angel Broking and affiliates from doing so. Prospective investors and others are cautioned that any
forward-looking statements are not predictions and may be subject to change without notice.
Angel Broking Limited and affiliates, including the analyst who has issued this report, may, on the date of this report, and from time
to time, have long or short positions in, and buy or sell the securities of the companies mentioned herein or engage in any other
transaction involving such securities and earn brokerage or compensation or act as advisor or have other potential conflict of interest
with respect to company/ies mentioned herein or inconsistent with any recommendation and related information and opinions.
Angel Broking Limited and affiliates may seek to provide or have engaged in providing corporate finance, investment banking or
other advisory services in a merger or specific transaction to the companies referred to in this report, as on the date of this report or
in the past.
Sebi Registration No : INB 010996539
For Private Circulation Only |