Daily Technical Report
June 18, 2012
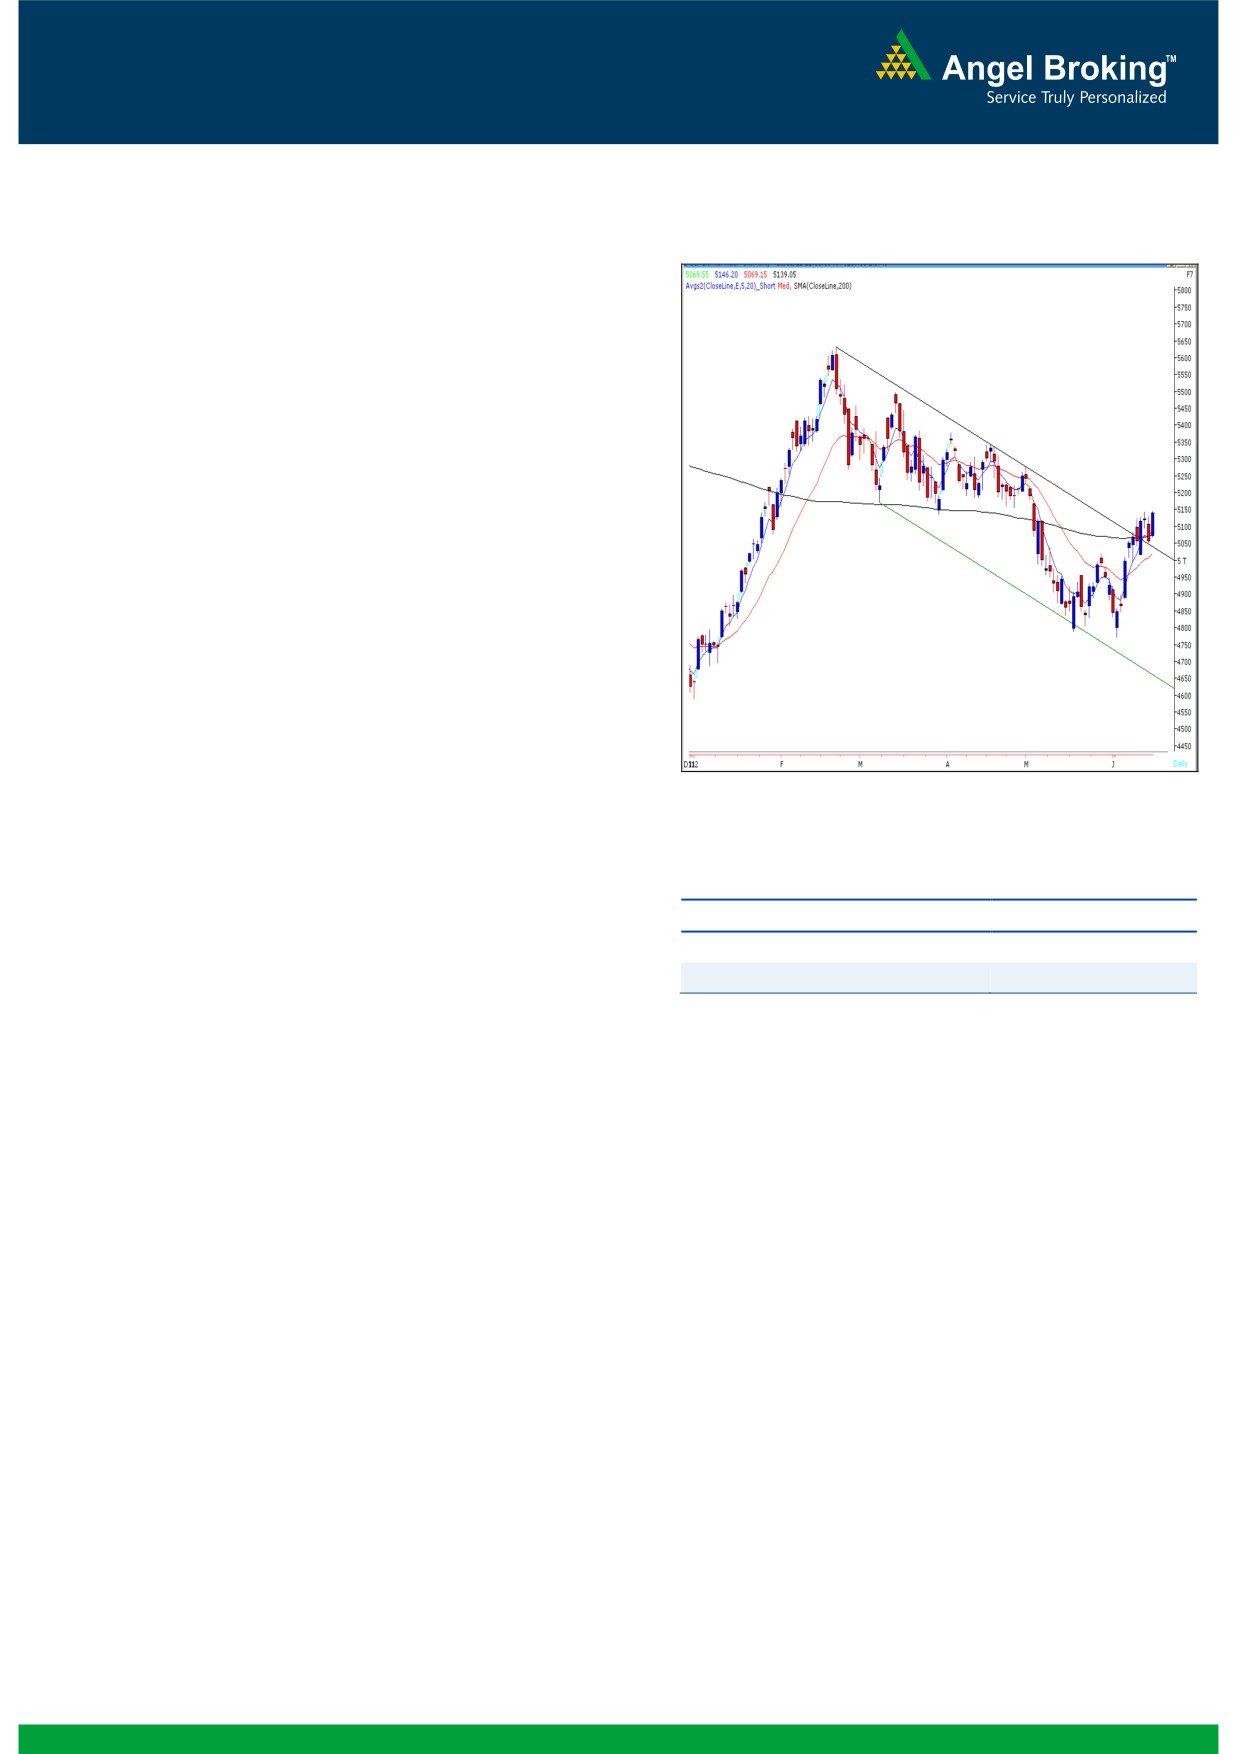
Exhibit 1: Nifty Daily Chart
Sensex (16950) / NIFTY (5139)
On Friday, our benchmark indices opened on a flat
note in-line with mixed global cues but traded with
extreme optimism throughout the day to close near
the week’s high. On sectoral front, Auto, Banking and
Realty counters contributed heavily during Friday’s
rally. There was no sector on the losing side. The
advance to decline ratio was strongly in favor of
advancing counters (A=1525 D=1165) (Source -
Formation
The 200-day SMA (Simple Moving Average) and
20-day EMA (Exponential Moving Average) have
now shifted to 16800 / 5070 and 16550 /
5019, respectively.
The ‘20-Week EMA’ is placed at 16830 / 5100
level.
Source: Falcon
Indices have taken a support near 15860 /
4766 level, which is the
78.6% Fibonacci
Retracement level of the rise from 15135 / 4531
Actionable points:
(Low on December 23, 2011) to 18524 / 5630
View
Bullish above 5146
(High on February 22, 2012).
Expected target
5220
Support Levels
5095 -5070
On the daily chart, indices are trading near the
upper range of ‘Downward Sloping Channel’
drawn by joining two highs of February 22,
2012 - April 19, 2012 and low of March 7,
This technical indicator coupled with the positively
2012.
poised ‘RSI’ momentum indicator indicates further
The positive crossover in weekly ‘RSI’ momentum
upside. We advise traders to hold their long positions
oscillator is still intact. Also, the weekly ‘3 & 8
for the expected target around 17400 / 5270 in spite
EMA’ is signaling a positive crossover.
of the upcoming global and domestic events. We are
of the opinion that markets have already begun
assessing the outcome from these events and are
Trading strategy:
thus, reacting prior to the actual announcement.
Broadly speaking, indices have traded in the range of
Traders are advised to maintain a STRICT stop loss
16968 to 16553 / 5146 to 5015 over the last few
below 4880 on closing basis.
sessions. Friday’s decent upside rally has confirmed a
bullish implication of the mentioned ‘Downward
Sloping Channel’. Further, we are also observing that
indices have managed to close convincingly above
‘200-day SMA’ as well as
’20-week EMA’. This
indicates significant strength in current up move. We
are now observing a positive crossover in ‘3 & 8 week
EMA’.
1
Daily Technical Report
June 18, 2012
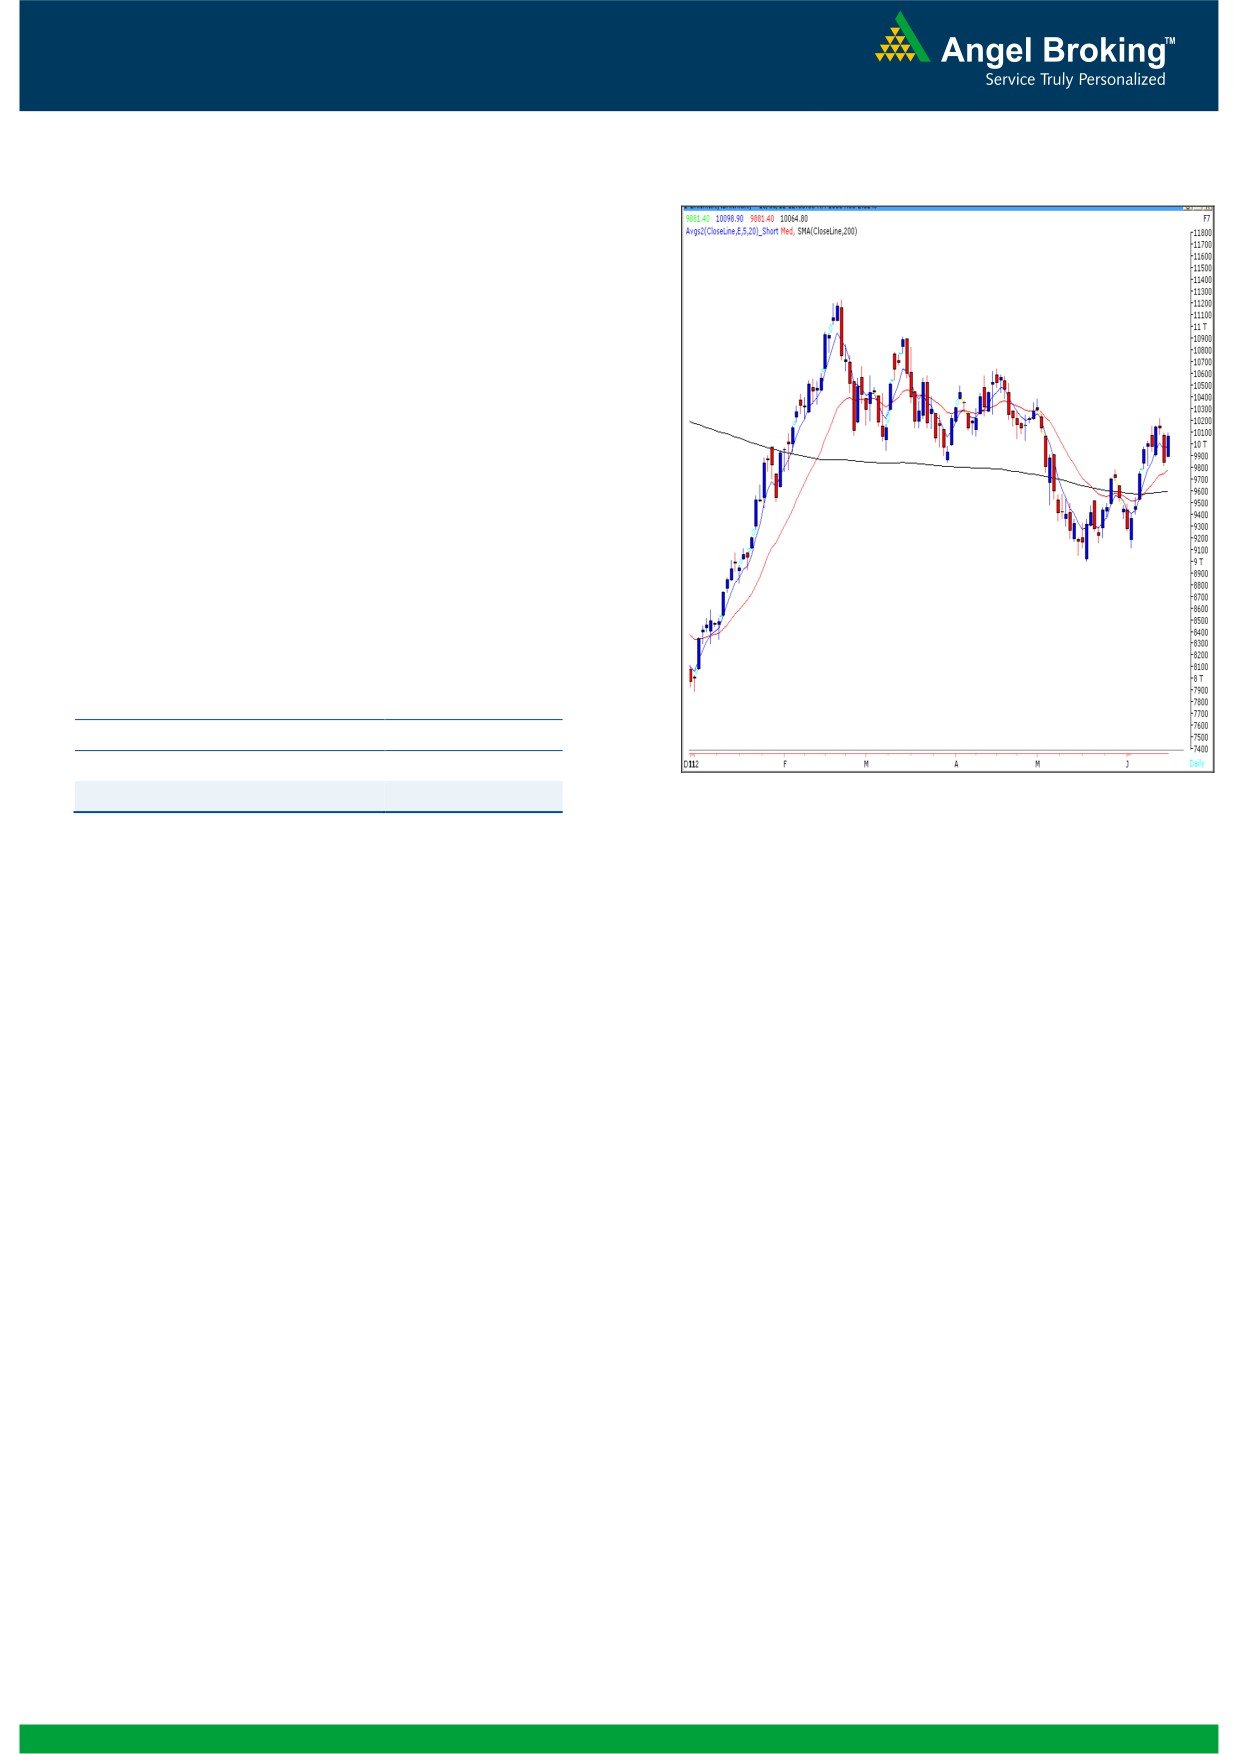
Bank Nifty Outlook - (10065)
Exhibit 2: Bank Nifty Daily Chart
On Friday, Bank Nifty opened on a positive note and
gained strength as the day progressed to close near
the highest point of the day. The “Evening Star”
candlestick pattern mentioned in our previous report
has resulted in the expected degree of consolidation
on the Index and would now be negated once the
Bank Nifty closes above 10225 level. On the weekly
chart we are witnessing a “Doji” candlestick pattern
formation which indicates indecisiveness. Today, on
account of the RBI monetary policy, we expect the
Index to remain volatile in the first half. A sustainable
move above
10225 will trigger fresh positive
momentum and the index is likely to rally towards
10335 - 10382 levels. On the downside 9880 -
9809 levels are likely to act as support for the day.
Actionable points:
View
Bullish Above 10225
Expected Target
10335-10382
Support Levels
9880
Source: Falcon
2
Daily Technical Report
June 18, 2012
Daily Pivot Levels for Nifty 50 Stocks
SCRIPS
S2
S1
PIVOT
R1
R2
SENSEX
16,606
16,778
16,873
17,045
17,139
NIFTY
5,041
5,090
5,118
5,167
5,195
BANKNIFTY
9,798
9,931
10,015
10,149
10,233
ACC
1,180
1,202
1,217
1,238
1,253
AMBUJACEM
161
165
168
172
174
ASIANPAINT
3,821
3,853
3,877
3,909
3,933
AXISBANK
999
1,016
1,027
1,044
1,055
BAJAJ-AUTO
1,496
1,512
1,531
1,547
1,566
BANKBARODA
690
696
702
708
714
BHARTIARTL
299
306
309
315
319
BHEL
213
216
218
220
222
BPCL
724
733
742
751
760
CAIRN
323
326
328
331
334
CIPLA
301
305
308
311
314
COALINDIA
330
335
338
343
346
DLF
190
193
195
199
201
DRREDDY
1,529
1,554
1,571
1,596
1,612
GAIL
327
331
335
338
342
GRASIM
2,288
2,387
2,447
2,546
2,606
HCLTECH
476
481
484
490
493
HDFC
634
640
644
650
654
HDFCBANK
529
538
544
553
559
HEROMOTOCO
1,931
1,966
1,992
2,027
2,053
HINDALCO
119
121
123
125
127
HINDUNILVR
437
443
448
454
458
ICICIBANK
809
827
841
860
874
IDFC
128
129
131
132
134
INFY
2,490
2,506
2,519
2,535
2,548
ITC
242
245
247
250
252
JINDALSTEL
429
433
436
440
444
JPASSOCIAT
67
69
69
71
72
KOTAKBANK
562
572
579
588
595
LT
1,267
1,296
1,315
1,343
1,363
M&M
676
687
694
705
712
MARUTI
1,065
1,086
1,098
1,119
1,131
NTPC
145
148
150
152
154
ONGC
259
263
268
272
277
PNB
764
778
787
801
809
POWERGRID
105
105
106
107
107
RANBAXY
467
473
477
482
486
RELIANCE
714
720
725
732
736
RELINFRA
494
507
516
529
538
SAIL
91
92
93
93
94
SBIN
2,130
2,157
2,173
2,200
2,216
SESAGOA
179
182
186
189
193
SIEMENS
684
691
696
703
709
STER
96
98
101
102
105
SUNPHARMA
579
586
591
599
604
TATAMOTORS
223
232
237
245
250
TATAPOWER
91
92
93
95
96
TATASTEEL
404
409
413
418
421
TCS
1,236
1,254
1,267
1,285
1,298
WIPRO
393
395
398
401
404
3
Daily Technical Report
June 18, 2012
Research Team Tel: 022 - 39357800
DISCLAIMER
This document is solely for the personal information of the recipient, and must not be singularly used as the basis of any investment
decision. Nothing in this document should be construed as investment or financial advice. Each recipient of this document should make
such investigations as they deem necessary to arrive at an independent evaluation of an investment in the securities of the companies
referred to in this document (including the merits and risks involved), and should consult their own advisors to determine the merits and
risks of such an investment.
Angel Broking Limited, its affiliates, directors, its proprietary trading and investment businesses may, from time to time, make
investment decisions that are inconsistent with or contradictory to the recommendations expressed herein. The views contained in this
document are those of the analyst, and the company may or may not subscribe to all the views expressed within.
Reports based on technical and derivative analysis center on studying charts of a stock's price movement, outstanding positions and
trading volume, as opposed to focusing on a company's fundamentals and, as such, may not match with a report on a company's
fundamentals.
The information in this document has been printed on the basis of publicly available information, internal data and other reliable
sources believed to be true, but we do not represent that it is accurate or complete and it should not be relied on as such, as this
document is for general guidance only. Angel Broking Limited or any of its affiliates/ group companies shall not be in any way
responsible for any loss or damage that may arise to any person from any inadvertent error in the information contained in this report.
Angel Broking Limited has not independently verified all the information contained within this document. Accordingly, we cannot testify,
nor make any representation or warranty, express or implied, to the accuracy, contents or data contained within this document. While
Angel Broking Limited endeavours to update on a reasonable basis the information discussed in this material, there may be regulatory,
compliance, or other reasons that prevent us from doing so.
This document is being supplied to you solely for your information, and its contents, information or data may not be reproduced,
redistributed or passed on, directly or indirectly.
Angel Broking Limited and its affiliates may seek to provide or have engaged in providing corporate finance, investment banking or
other advisory services in a merger or specific transaction to the companies referred to in this report, as on the date of this report or in
the past.
Neither Angel Broking Limited, nor its directors, employees or affiliates shall be liable for any loss or damage that may arise from or in
connection with the use of this information.
Note: Please refer to the important `Stock Holding Disclosure' report on the Angel website (Research Section). Also, please refer to the
latest update on respective stocks for the disclosure status in respect of those stocks. Angel Broking Limited and its affiliates may have
investment positions in the stocks recommended in this report.
Research Team
Shardul Kulkarni
-
Head - Technicals
Sameet Chavan
-
Technical Analyst
Sacchitanand Uttekar
-
Technical Analyst
Mehul Kothari
-
Technical Analyst
Ankur Lakhotia
-
Technical Analyst
Angel Broking Pvt. Ltd.
Registered Office: G-1, Ackruti Trade Centre, Rd. No. 7, MIDC, Andheri (E), Mumbai - 400 093.
Corporate Office: 6th Floor, Ackruti Star, MIDC, Andheri (E), Mumbai - 400 093. Tel: (022) 3952 6600
Sebi Registration No: INB 010996539
4