Daily Technical Report
May 18, 2012
Sensex (16070) / NIFTY (4870)
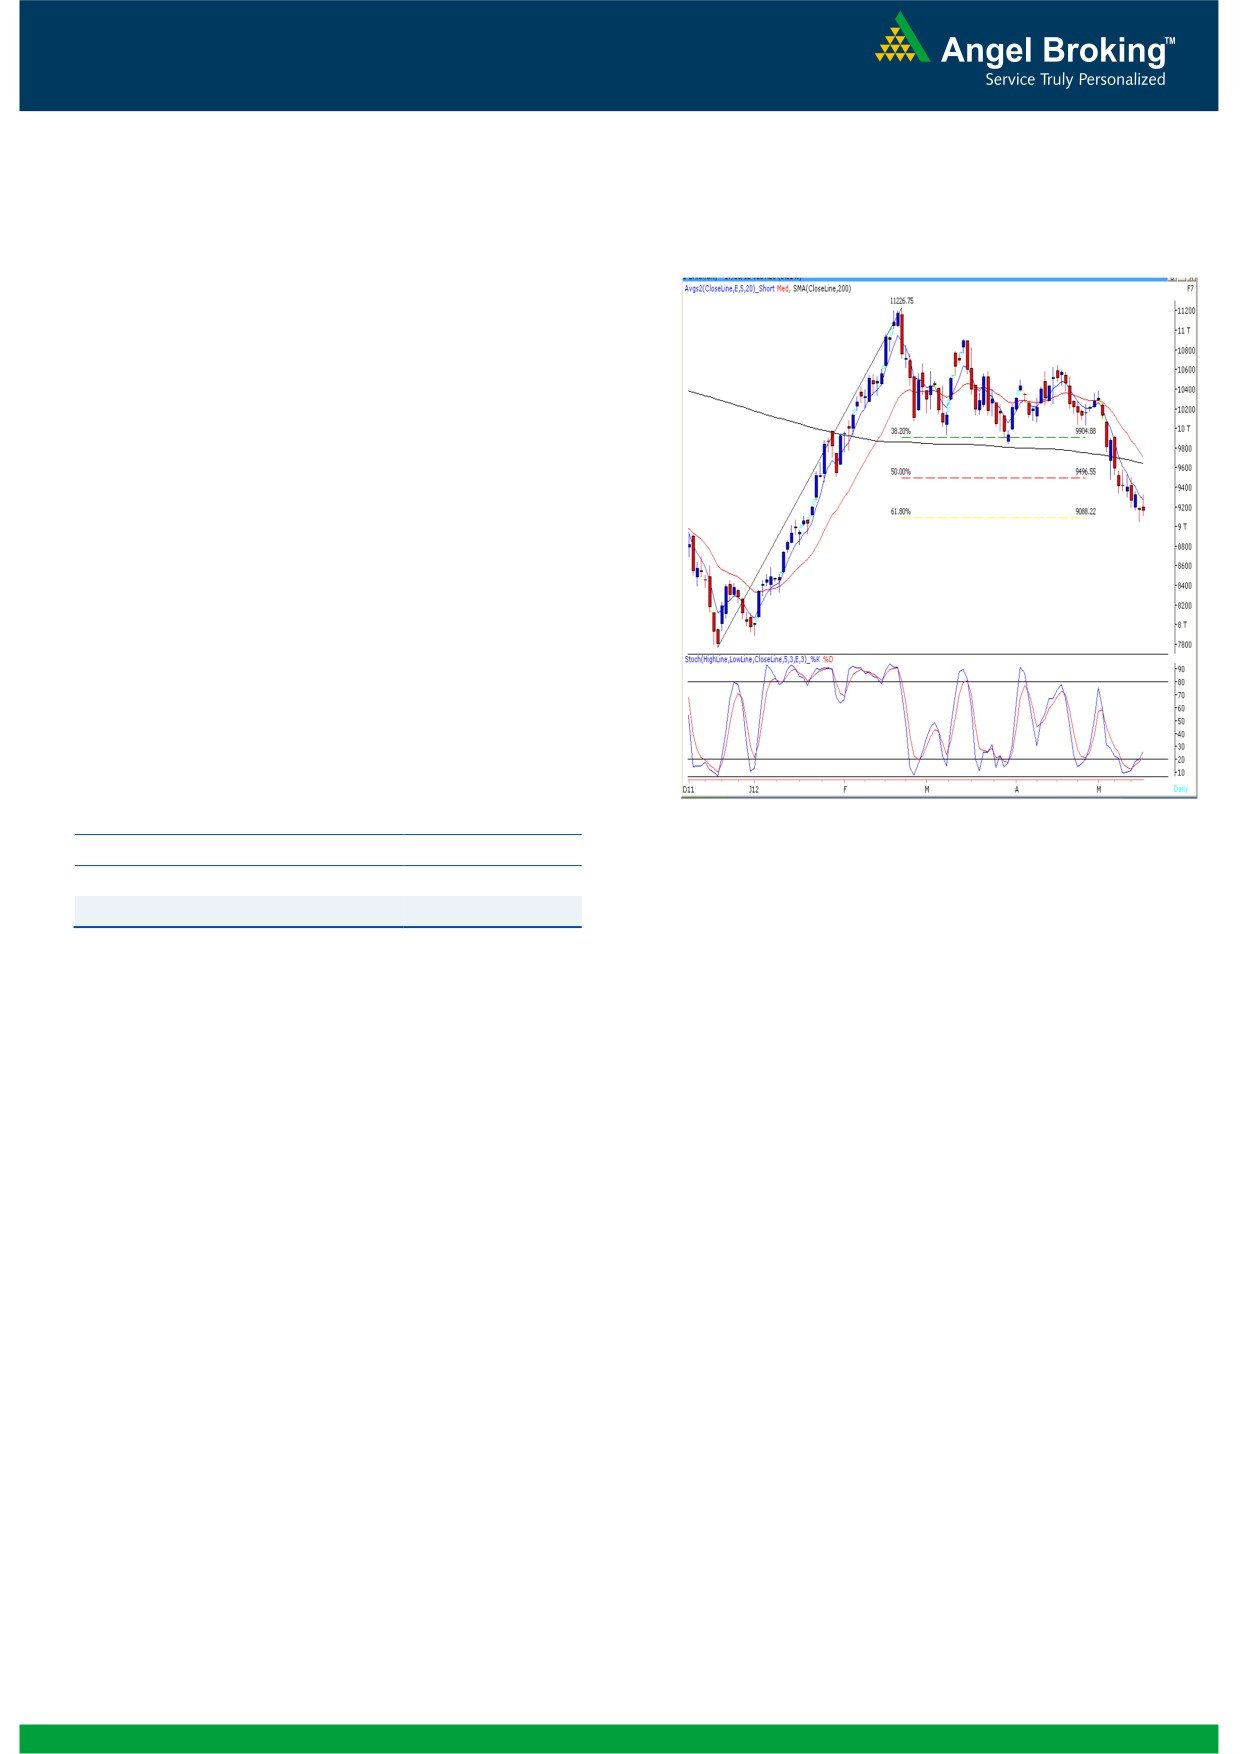
Exhibit 1: Nifty Daily Chart
Yesterday, indices opened marginally higher and
moved upwards during the initial part of the session.
However during the second half, strong selling
pressure in Capital Goods, Consumer Durables,
Banking and Auto stocks resulted in loss of all initial
gains. FMCG, Realty and Oil & Gas counters were
among the major gainers. The advance to decline
ratio was in favor of declining counters (A=1340
Formation
The 200-day SMA (Simple Moving Average) and
20-day EMA (Exponential Moving Average) have
now shifted to 16920 / 5092 and 16940 /
5072, respectively.
The daily ‘Stochastic’ momentum oscillator is
Source: Falcon
signaling a positive crossover.
Indices have now tested 16430 / 4950 level,
which is the 61.8 % Fibonacci Retracement level
of the rise from
15135
/
4531 (Low on
December 23, 2011) to 18524 / 5630 (High on
February 22, 2012).
Actionable points:
Trading strategy:
View
Neutral
Resistance Levels
4922 - 4976
Yesterday, with an optimistic start markets showed
Support Levels
4837 - 4766
some early signs of a bounce back. We have been
witnessing since past few sessions that every intraday
rally loses momentum and gets sold into after nearing
important resistance levels. Likewise, yesterday too
indices drifted off sharply from the day high. Going
forward, we continue to mention that traders should
avoid creating long positions until we observe a
'Higher Top Higher Bottom' formation in hourly chart.
Only a move beyond 16390 / 4957 would confirm
the beginning of a pullback in the strong downward
slide of the index and we may then witness a rally up
to 16447 - 16725 / 4976 - 5050 levels. Conversely,
the support levels remains around the 15974 - 15860
/ 4837 - 4766.
1
Daily Technical Report
May 18, 2012
Bank Nifty Outlook - (9154)
Yesterday, Bank Nifty opened on a flat note and
Exhibit 2: Bank Nifty Daily Chart
traded with extreme volatility throughout the day. The
index tested the mentioned support and resistance
levels of 9105 and 9310 respectively. The “Bullish
Hammer” candlestick pattern mentioned in our
previous report still holds its significance. We are
witnessing positive crossover in “Stochastic”
momentum oscillator on the daily chart. Also at this
juncture we are witnessing a “Spinning Top”
candlestick formation which suggests indecisiveness
prevailing at current levels. Going forward, only if the
index manages to sustain above yesterday’s high of
9328 then it is likely to rally towards 9430 - 9500
levels. On the downside 9105 - 9047 are likely to act
as support in coming trading session. A close below
the low of the
9047 would negate the bullish
implication of the Hammer pattern and may lead to
further sell off in the Index.
Actionable points:
Source: Falcon
View
Neutral
Resistance Levels
9328 - 9430
Support Levels
9105 - 9047
2
Daily Technical Report
May 18, 2012
Research Team Tel: 022 - 39357800
DISCLAIMER
This document is solely for the personal information of the recipient, and must not be singularly used as the basis of any investment
decision. Nothing in this document should be construed as investment or financial advice. Each recipient of this document should make
such investigations as they deem necessary to arrive at an independent evaluation of an investment in the securities of the companies
referred to in this document (including the merits and risks involved), and should consult their own advisors to determine the merits and
risks of such an investment.
Angel Broking Limited, its affiliates, directors, its proprietary trading and investment businesses may, from time to time, make
investment decisions that are inconsistent with or contradictory to the recommendations expressed herein. The views contained in this
document are those of the analyst, and the company may or may not subscribe to all the views expressed within.
Reports based on technical and derivative analysis center on studying charts of a stock's price movement, outstanding positions and
trading volume, as opposed to focusing on a company's fundamentals and, as such, may not match with a report on a company's
fundamentals.
The information in this document has been printed on the basis of publicly available information, internal data and other reliable
sources believed to be true, but we do not represent that it is accurate or complete and it should not be relied on as such, as this
document is for general guidance only. Angel Broking Limited or any of its affiliates/ group companies shall not be in any way
responsible for any loss or damage that may arise to any person from any inadvertent error in the information contained in this report.
Angel Broking Limited has not independently verified all the information contained within this document. Accordingly, we cannot testify,
nor make any representation or warranty, express or implied, to the accuracy, contents or data contained within this document. While
Angel Broking Limited endeavours to update on a reasonable basis the information discussed in this material, there may be regulatory,
compliance, or other reasons that prevent us from doing so.
This document is being supplied to you solely for your information, and its contents, information or data may not be reproduced,
redistributed or passed on, directly or indirectly.
Angel Broking Limited and its affiliates may seek to provide or have engaged in providing corporate finance, investment banking or
other advisory services in a merger or specific transaction to the companies referred to in this report, as on the date of this report or in
the past.
Neither Angel Broking Limited, nor its directors, employees or affiliates shall be liable for any loss or damage that may arise from or in
connection with the use of this information.
Note: Please refer to the important `Stock Holding Disclosure' report on the Angel website (Research Section). Also, please refer to the
latest update on respective stocks for the disclosure status in respect of those stocks. Angel Broking Limited and its affiliates may have
investment positions in the stocks recommended in this report.
Research Team
Shardul Kulkarni
-
Head - Technicals
Sameet Chavan
-
Technical Analyst
Sacchitanand Uttekar
-
Technical Analyst
Mehul Kothari
-
Technical Analyst
Ankur Lakhotia
-
Technical Analyst
Angel Broking Pvt. Ltd.
Registered Office: G-1, Ackruti Trade Centre, Rd. No. 7, MIDC, Andheri (E), Mumbai - 400 093.
Corporate Office: 6th Floor, Ackruti Star, MIDC, Andheri (E), Mumbai - 400 093. Tel: (022) 3952 6600
Sebi Registration No: INB 010996539
4