Technical Research | April 18, 2012
Daily Technical Report
Sensex (17358) / NIFTY (5290)
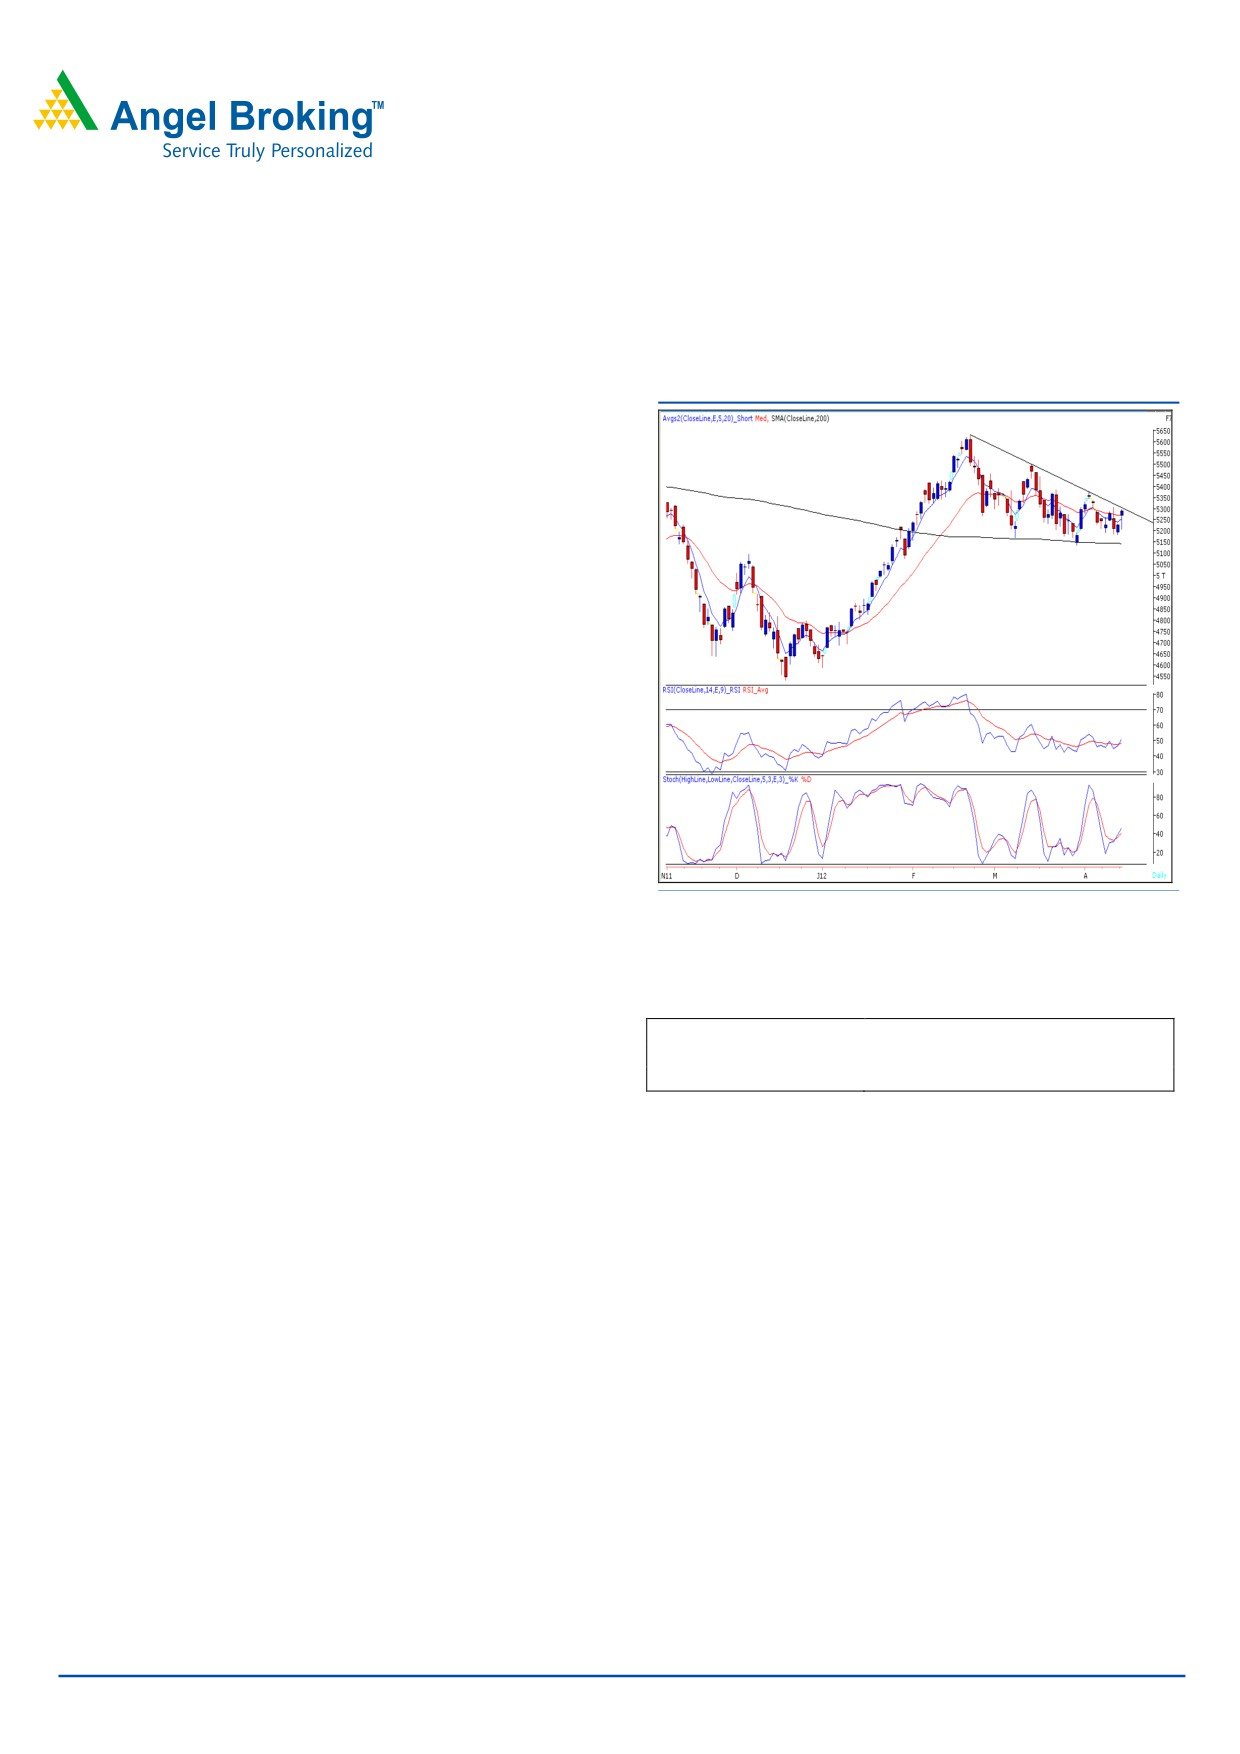
Exhibit 1: Nifty Daily Chart
Yesterday, our Benchmark indices opened on a flat note
and traded in a narrow range in the initial hour of the
session. Later on, as expected and mentioned, indices
traded with extreme volatility post the announcement of the
RBI Monetary Policy as RBI surprised markets with 50bps
rate cut. On the sectoral front, Realty and Metal counters
were among the major gainers, whereas there was no
sector on the losing side. The advance to decline ratio was
strongly in favor of advancing counters (A=1657 D=1155)
Formation:
• The 200-day SMA (Simple Moving Average) and 20-
day EMA (Exponential Moving Average) have now shifted to
17100 / 5150 and 17324 / 5271, respectively.
Source: Falcon
• The ‘20-Week EMA’ is placed at 17200 / 5200 level.
• We are witnessing a ‘Downward Sloping Trend Line’
resistance around 17400 / 5300 level.
Actionable points:
View
Positive Above 5307
Expected Targets
5330 - 5379
Trading strategy:
Support Levels
5240 - 5170
Yesterday, we witnessed a volatile trading session on
account of “RBI Monetary Policy”. After the announcement
of the policy, our indices rallied almost 1.5% from day’s low
and closed in green. Today, our markets are likely to open
in the green on the back of strong positive global cues. We
reiterate our positive bias on the markets and are of the
view that once the indices cross the temporary resistance at
17408 / 5307 they are likely to rally further towards 17664
- 18041 / 5379 - 5500 levels. On the downside, 17210 -
17010 / 5240 - 5170 will now act as a decent support for
the markets.
For Private Circulation Only |
1
Technical Research | April 18, 2012
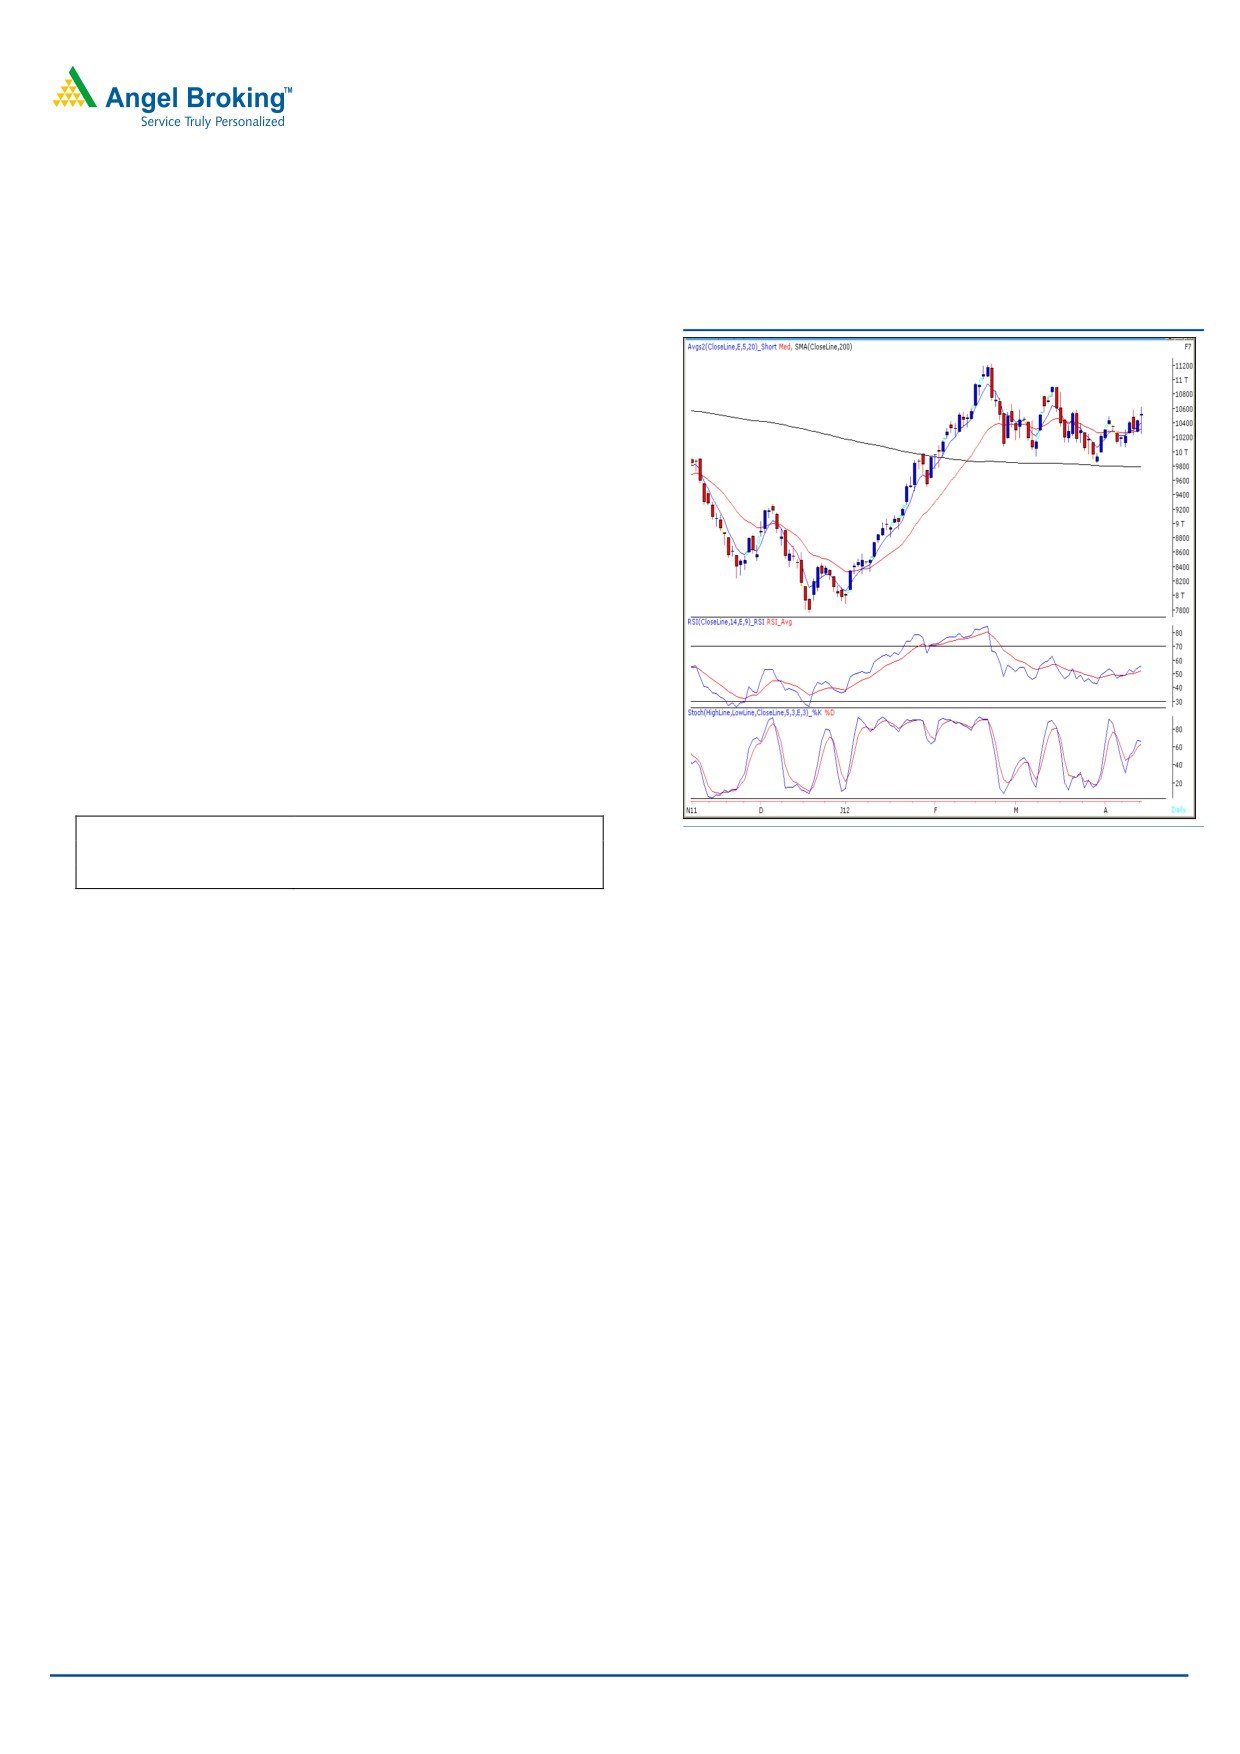
Bank Nifty Outlook - (10520)
Exhibit 2: Bank Nifty Daily Chart
In Yesterday’s session, as expected Bank Nifty remained
highly volatile and tested the mentioned resistance and
support levels. We are witnessing a “Doji” candlestick
pattern which is a sign of indecisiveness prevailing at
current levels. Hence, we reiterate our view that presently
the index is in trading range of 10600 - 10150. Only a
sustainable move outside the mentioned range will dictate
a clear direction of the trend. A move above the 10625
level will trigger fresh upside momentum and the Bank
Nifty is then likely to test 10750 - 10832. On the
downside 10348 - 10250 are likely to act as support in
coming trading session.
Actionable points:
View
Positive above 10625
Source: Falcon
Expected target
10750 - 10832
Support Levels
10348 - 10250
For Private Circulation Only |
2
Technical Research | April 18, 2012
Positive Bias:
Positive
Expected
Stock Name
CMP
5 Day EMA
20 Day EMA
Remarks
Above
Target
View will change below
Bharti Airtel
322.3
322.7
329.6
324
340
314
View will change below
Siemens
813
794.4
784
820
880
790
For Private Circulation Only |
3
Technical Research | April 18, 2012
Daily Pivot Levels for Nifty 50 Stocks
SCRIPS
S2
S1
PIVOT
R1
R2
SENSEX
17,003
17,180
17,281
17,459
17,560
NIFTY
5,176
5,233
5,265
5,322
5,355
BANKNIFTY
10,090
10,305
10,463
10,678
10,837
ACC
1,207
1,231
1,246
1,270
1,285
AMBUJACEM
153
158
160
164
167
AXISBANK
1,136
1,174
1,199
1,237
1,263
BAJAJ-AUTO
1,618
1,645
1,662
1,690
1,707
BHARTIARTL
312
317
320
326
329
BHEL
255
259
262
266
270
BPCL
668
678
683
693
699
CAIRN
328
334
340
346
352
CIPLA
311
313
315
316
318
COALINDIA
339
345
349
354
358
DLF
194
200
203
208
211
DRREDDY
1,708
1,734
1,766
1,793
1,825
GAIL
343
354
362
373
381
HCLTECH
468
474
486
493
504
HDFC
665
674
681
691
698
HDFCBANK
514
522
529
537
544
HEROMOTOCO
2,026
2,075
2,105
2,155
2,185
HINDALCO
122
125
127
130
131
HINDUNILVR
416
419
422
425
428
ICICIBANK
837
861
877
901
917
IDFC
127
131
133
136
138
INFY
2,309
2,345
2,372
2,408
2,435
ITC
236
241
244
249
252
JINDALSTEL
488
498
505
515
522
JPASSOCIAT
76
80
81
84
86
KOTAKBANK
563
572
582
592
601
LT
1,274
1,303
1,320
1,350
1,367
M&M
672
678
685
691
698
MARUTI
1,286
1,314
1,354
1,383
1,423
NTPC
163
165
167
169
171
ONGC
252
261
266
274
279
PNB
891
910
925
944
960
POWERGRID
110
112
113
115
116
RANBAXY
496
502
508
514
520
RCOM
82
86
88
91
93
RELIANCE
733
740
747
754
762
RELINFRA
534
560
574
599
613
RPOWER
112
116
118
121
123
SAIL
93
95
96
97
98
SBIN
2,163
2,234
2,292
2,362
2,420
SESAGOA
183
186
189
192
195
SIEMENS
782
798
808
824
834
STER
105
107
108
109
110
SUNPHARMA
565
575
583
593
601
SUZLON
24
24
24
25
25
TATAMOTORS
293
297
301
305
309
TATAPOWER
102
103
104
105
106
TATASTEEL
446
454
459
467
473
TCS
1,065
1,078
1,087
1,099
1,108
WIPRO
417
419
422
424
427
Technical Research Team
For Private Circulation Only |
4
Technical Report
RESEARCH TEAM
Shardul Kulkarni
Head - Technicals
Sameet Chavan
Technical Analyst
Sacchitanand Uttekar
Technical Analyst
Mehul Kothari
Technical Analyst
Ankur Lakhotia
Technical Analyst
Research Team: 022-3952 6600
DISCLAIMER: This document is not for public distribution and has been furnished to you solely for your information and must not
be reproduced or redistributed to any other person. Persons into whose possession this document may come are required to observe
these restrictions.
Opinion expressed is our current opinion as of the date appearing on this material only. While we endeavor to update on a
reasonable basis the information discussed in this material, there may be regulatory, compliance, or other reasons that prevent us
from doing so. Prospective investors and others are cautioned that any forward-looking statements are not predictions and may be
subject to change without notice. Our proprietary trading and investment businesses may make investment decisions that are
inconsistent with the recommendations expressed herein.
The information in this document has been printed on the basis of publicly available information, internal data and other reliable
sources believed to be true and are for general guidance only. While every effort is made to ensure the accuracy and completeness of
information contained, the company takes no guarantee and assumes no liability for any errors or omissions of the information. No
one can use the information as the basis for any claim, demand or cause of action.
Recipients of this material should rely on their own investigations and take their own professional advice. Each recipient of this
document should make such investigations as it deems necessary to arrive at an independent evaluation of an investment in the
securities of companies referred to in this document (including the merits and risks involved), and should consult their own advisors to
determine the merits and risks of such an investment. Price and value of the investments referred to in this material may go up or
down. Past performance is not a guide for future performance. Certain transactions - futures, options and other derivatives as well as
non-investment grade securities - involve substantial risks and are not suitable for all investors. Reports based on technical analysis
centers on studying charts of a stock's price movement and trading volume, as opposed to focusing on a company's fundamentals
and as such, may not match with a report on a company's fundamentals.
We do not undertake to advise you as to any change of our views expressed in this document. While we would endeavor to update
the information herein on a reasonable basis, Angel Broking, its subsidiaries and associated companies, their directors and
employees are under no obligation to update or keep the information current. Also there may be regulatory, compliance, or other
reasons that may prevent Angel Broking and affiliates from doing so. Prospective investors and others are cautioned that any
forward-looking statements are not predictions and may be subject to change without notice.
Angel Broking Limited and affiliates, including the analyst who has issued this report, may, on the date of this report, and from time
to time, have long or short positions in, and buy or sell the securities of the companies mentioned herein or engage in any other
transaction involving such securities and earn brokerage or compensation or act as advisor or have other potential conflict of interest
with respect to company/ies mentioned herein or inconsistent with any recommendation and related information and opinions.
Angel Broking Limited and affiliates may seek to provide or have engaged in providing corporate finance, investment banking or
other advisory services in a merger or specific transaction to the companies referred to in this report, as on the date of this report or
in the past.
Sebi Registration No: INB 010996539
For Private Circulation Only |