Technical Research | January 18, 2012
Daily Technical Report
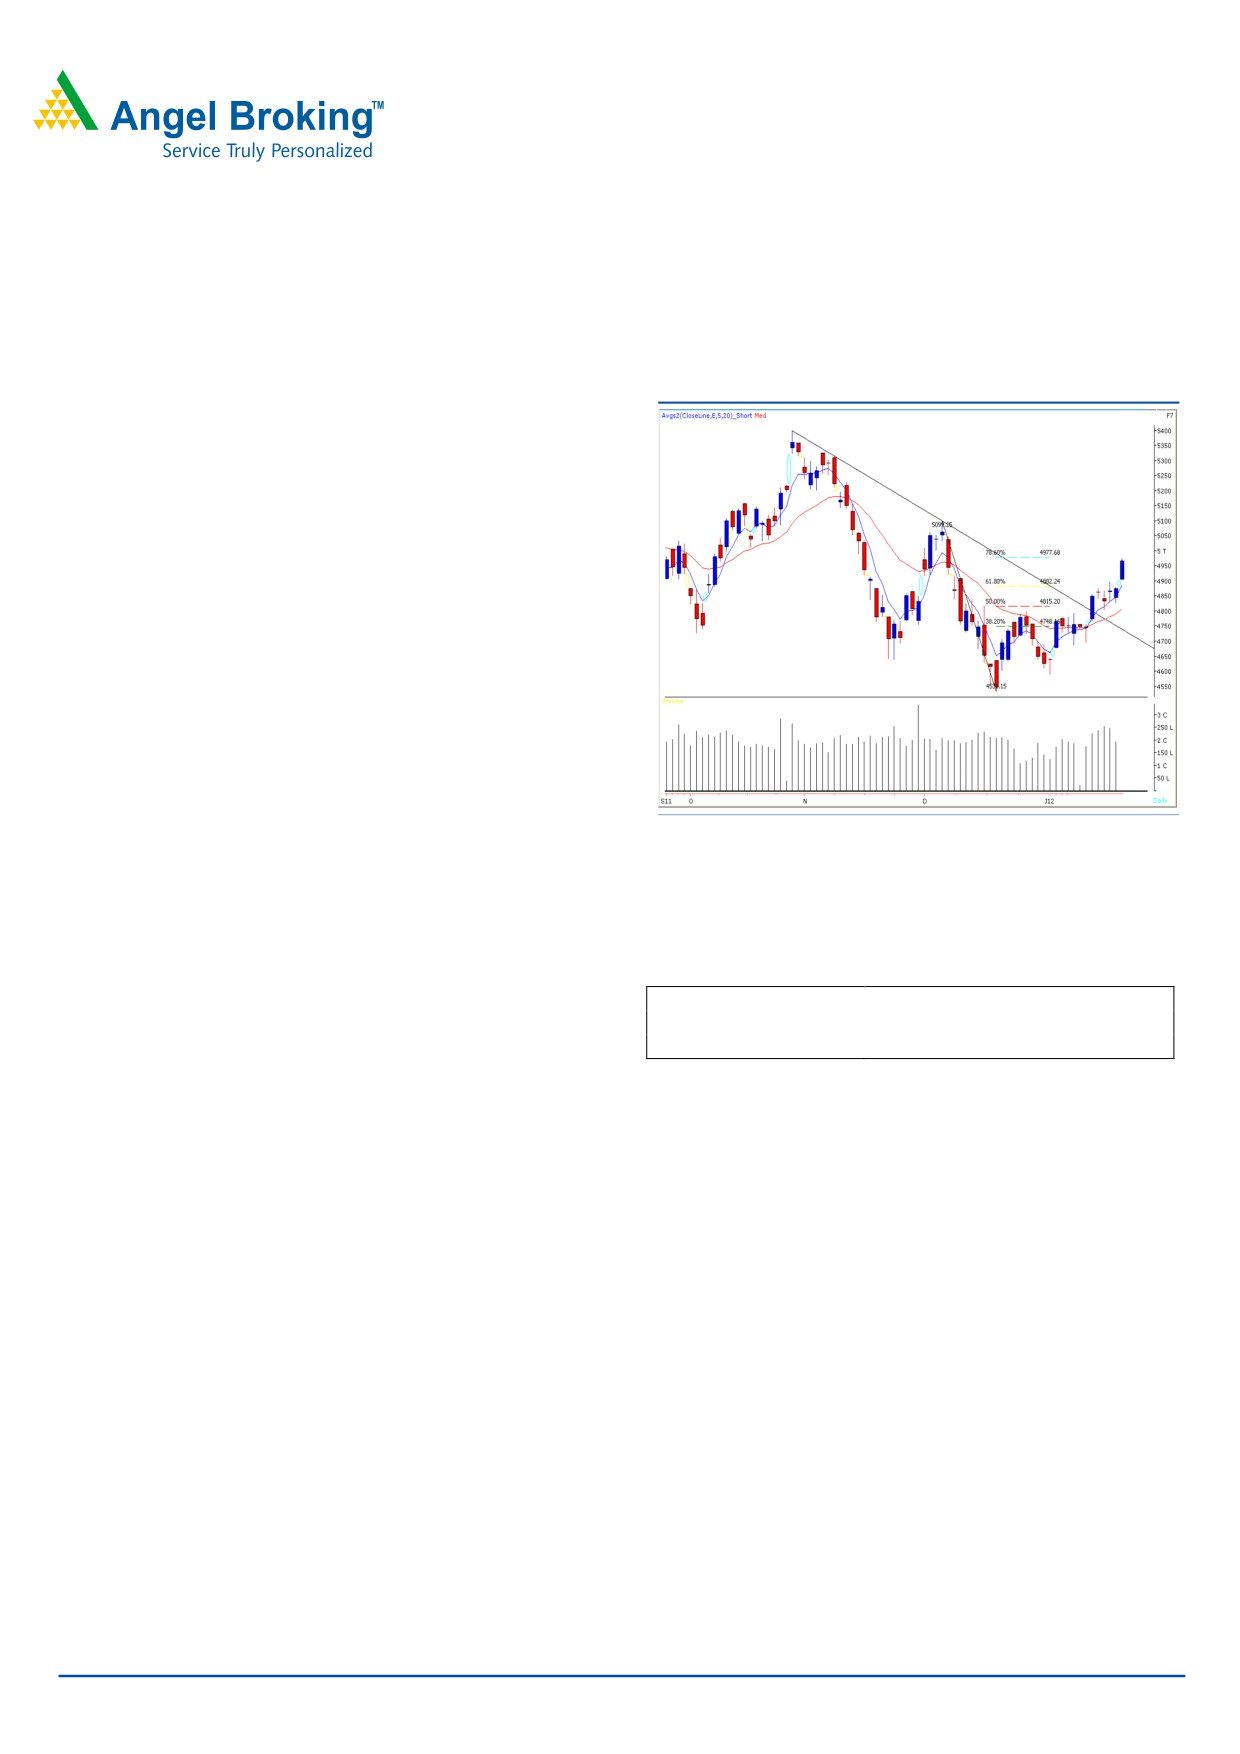
Sensex (16466) / NIFTY (4967)
Exhibit 1: Nifty Daily Chart
Yesterday, markets opened on a cheerful note in-line with
positive cues from other Asian indices. The positive
momentum increased as the day progressed, which led
indices to close almost at day’s high. On the sectoral front,
Capital Goods, Metal, Realty and Oil & Gas sectors were
among the major gainers. There was no sector in the
negative territory. The advance to decline ratio was strongly
in favor of advancing counters. (A=1898 D=980) (Source -
Formation:
• The 20-day EMA (Exponential Moving Average) has
now shifted to the 15940 / 4780 level.
Source: Falcon
• The 78.6% Fibonacci retracement level of the fall from
17004 to 15135 / 5100 to 4531 is at 16600 / 4978.
Actionable points:
Trading strategy:
View
Neutral
Markets opened with a decent upside gap mainly due to
Resistance levels
4976- 5050
rupee appreciation and positive global cues. This positive
Support levels
4898 - 4827
momentum then pushed indices substantially higher to test
expected resistance level of 16600 / 4976 and finally
closed marginally below it. This level coincides with the
78.6% Fibonacci retracement level of the fall from 17004 to
15135 / 5100 to 4531. Going forward, this level is likely to
act as an important resistance. A sustainable move beyond
this may lead to further up move to test 16848 - 17004 /
5050 - 5100 levels. On the downside, the decent support is
seen around 16257 - 16037 / 4898 - 4827 levels.
For Private Circulation Only |
1
Technical Research | January 18, 2012
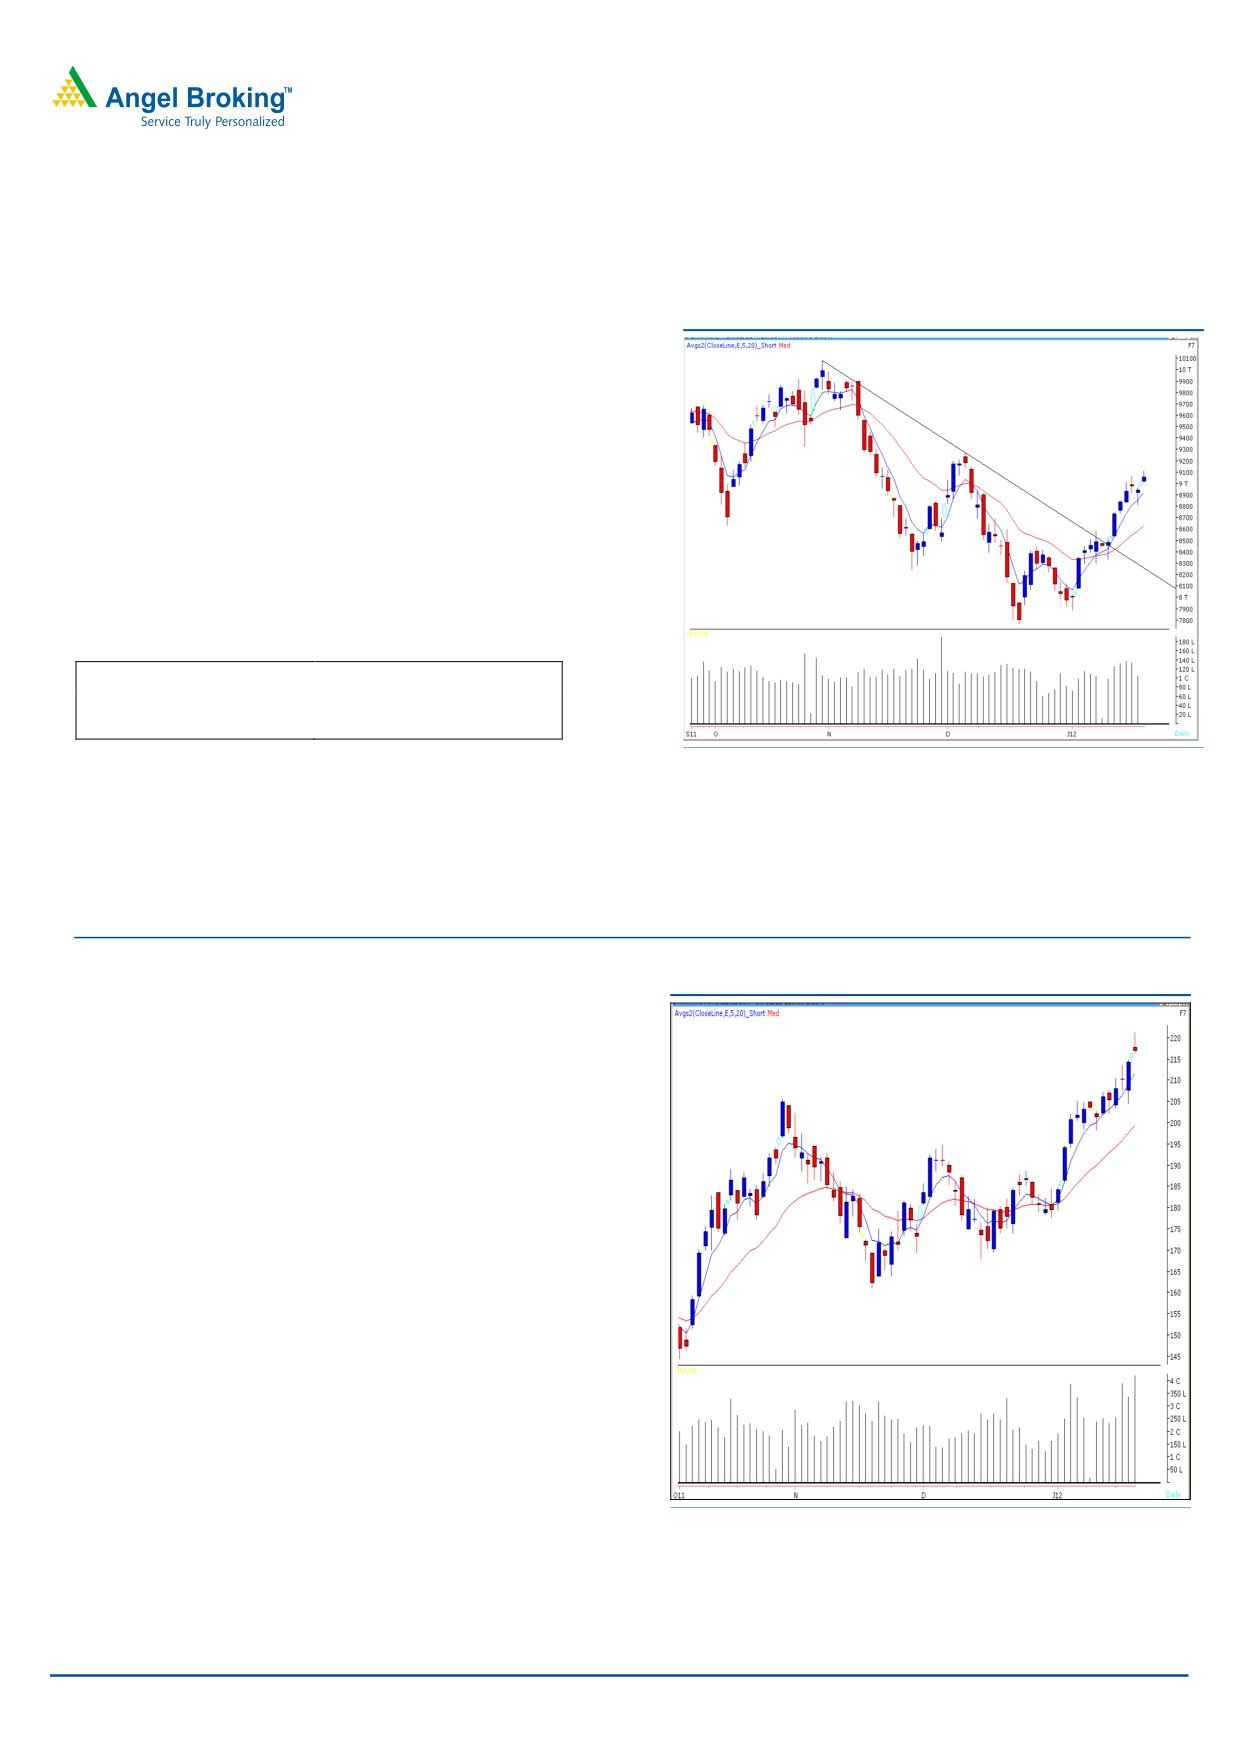
Bank Nifty Outlook - (9057)
Exhibit 2: Bank Nifty Daily Chart
Yesterday, Bank Nifty opened with an upside gap, faced
resistance near our mentioned resistance level of 9110 and
traded in a narrow range throughout the session. The
momentum oscillator “Stochastic” is placed in an overbought
zone; hence we may witness minor correction or
consolidation. On the downside, if Bank Nifty sustains below
yesterday’s low of 9011 then it is likely to test 8922 - 8848
levels. Only a sustainable move above yesterday’s high of
9115 would lead the index higher to test 9273 level.
Actionable points:
View
Neutral
Resistance levels
9115 - 9273
Support Levels
8922 - 8848
Source: Falcon
Stock Recommendations:
Exhibit 3: TATA MOTORS (JAN FUT)
Stock - TATA MOTORS (JAN FUT)
Action - SELL
Last close
` 216.70
Selling Below
` 216.25
Stop Loss
` 221.35
Target
` 204
Justification - On the Daily chart, after a continuous rise
from ` 177 to ` 221, we are now witnessing a bearish
candlestick pattern which resembles a “Shooting Star”. Also,
the momentum oscillators are in an overbought zone. The
above technical evidences suggest that some profit booking
might be on the cards. Hence, we advise selling the stock,
ONLY below ` 216.25 for a target of ` 204 in coming 3 -
5 trading sessions.
Source: Falcon
For Private Circulation Only |
2
Technical Research | January 18, 2012
Positive Bias:
Expected
Stock Name
CMP
5 Day EMA
20 Day EMA
Remarks
Target
Jain Irrigation
100.7
96.9
94.5
112
View will change below 93.5
NMDC
180.6
174.9
169.6
195
View will change below 171
Negative Bias:
Expected
Stock Name
CMP
5 Day EMA
20 Day EMA
Remarks
Target
Chambal Fert
78.45
80.6
80.6
74
View will change above 84.7
Biocon
257.7
263.8
272.7
241
View will change above 268.5
For Private Circulation Only |
3
Technical Research | January 18, 2012
Daily Pivot Levels for Nifty 50 Stocks
SCRIPS
S2
S1
PIVOT
R1
R2
SENSEX
16,182
16,324
16,413
16,555
16,643
NIFTY
4,877
4,922
4,949
4,994
5,021
BANKNIFTY
8,958
9,008
9,061
9,110
9,164
ACC
1,101
1,120
1,133
1,152
1,164
AMBUJACEM
150
154
156
160
162
AXISBANK
925
944
962
980
999
BAJAJ-AUTO
1,412
1,432
1,447
1,467
1,482
BHARTIARTL
337
341
344
348
351
BHEL
274
277
281
285
289
BPCL
496
511
520
534
544
CAIRN
335
340
344
349
353
CIPLA
328
333
337
342
346
DLF
190
194
198
202
207
DRREDDY
1,609
1,627
1,640
1,658
1,672
GAIL
365
368
371
374
377
HCLTECH
406
416
424
434
442
HDFC
667
671
676
680
684
HDFCBANK
461
465
467
471
473
HEROMOTOCO
1,789
1,808
1,824
1,843
1,859
HINDALCO
130
135
139
144
148
HINDUNILVR
381
389
394
403
407
ICICIBANK
770
778
791
799
812
IDFC
110
113
115
119
121
INFY
2,617
2,640
2,656
2,679
2,695
ITC
205
207
208
210
212
JINDALSTEL
495
503
510
518
525
JPASSOCIAT
60
62
63
65
66
KOTAKBANK
458
467
473
483
489
LT
1,186
1,227
1,251
1,292
1,316
M&M
683
694
702
713
721
MARUTI
982
1,045
1,082
1,146
1,183
NTPC
161
164
166
169
171
ONGC
252
257
260
265
269
PNB
879
898
910
929
941
POWERGRID
99
100
101
101
102
RANBAXY
454
459
466
471
477
RCOM
85
87
89
91
93
RELCAPITAL
296
304
311
319
325
RELIANCE
706
724
734
752
763
RELINFRA
403
416
425
438
447
RPOWER
86
87
89
90
92
SAIL
91
93
94
96
98
SBIN
1,813
1,829
1,850
1,866
1,888
SESAGOA
186
189
193
196
199
SIEMENS
711
731
743
763
775
STER
104
107
110
113
116
SUNPHARMA
499
507
513
522
528
SUZLON
22
23
23
23
24
TATAMOTORS
213
215
218
220
224
TATAPOWER
96
97
98
99
100
TATASTEEL
413
428
438
453
463
TCS
1,077
1,090
1,108
1,121
1,138
WIPRO
400
408
413
421
426
Technical Research Team
For Private Circulation Only |
4
Technical Report
RESEARCH TEAM
Shardul Kulkarni
Head - Technicals
Sameet Chavan
Technical Analyst
Sacchitanand Uttekar
Technical Analyst
Mehul Kothari
Technical Analyst
Ankur Lakhotia
Technical Analyst
Research Team: 022-3952 6600
DISCLAIMER: This document is not for public distribution and has been furnished to you solely for your information and must not
be reproduced or redistributed to any other person. Persons into whose possession this document may come are required to observe
these restrictions.
Opinion expressed is our current opinion as of the date appearing on this material only. While we endeavor to update on a
reasonable basis the information discussed in this material, there may be regulatory, compliance, or other reasons that prevent us
from doing so. Prospective investors and others are cautioned that any forward-looking statements are not predictions and may be
subject to change without notice. Our proprietary trading and investment businesses may make investment decisions that are
inconsistent with the recommendations expressed herein.
The information in this document has been printed on the basis of publicly available information, internal data and other reliable
sources believed to be true and are for general guidance only. While every effort is made to ensure the accuracy and completeness of
information contained, the company takes no guarantee and assumes no liability for any errors or omissions of the information. No
one can use the information as the basis for any claim, demand or cause of action.
Recipients of this material should rely on their own investigations and take their own professional advice. Each recipient of this
document should make such investigations as it deems necessary to arrive at an independent evaluation of an investment in the
securities of companies referred to in this document (including the merits and risks involved), and should consult their own advisors to
determine the merits and risks of such an investment. Price and value of the investments referred to in this material may go up or
down. Past performance is not a guide for future performance. Certain transactions - futures, options and other derivatives as well as
non-investment grade securities - involve substantial risks and are not suitable for all investors. Reports based on technical analysis
centers on studying charts of a stock's price movement and trading volume, as opposed to focusing on a company's fundamentals
and as such, may not match with a report on a company's fundamentals.
We do not undertake to advise you as to any change of our views expressed in this document. While we would endeavor to update
the information herein on a reasonable basis, Angel Broking, its subsidiaries and associated companies, their directors and
employees are under no obligation to update or keep the information current. Also there may be regulatory, compliance, or other
reasons that may prevent Angel Broking and affiliates from doing so. Prospective investors and others are cautioned that any
forward-looking statements are not predictions and may be subject to change without notice.
Angel Broking Limited and affiliates, including the analyst who has issued this report, may, on the date of this report, and from time
to time, have long or short positions in, and buy or sell the securities of the companies mentioned herein or engage in any other
transaction involving such securities and earn brokerage or compensation or act as advisor or have other potential conflict of interest
with respect to company/ies mentioned herein or inconsistent with any recommendation and related information and opinions.
Angel Broking Limited and affiliates may seek to provide or have engaged in providing corporate finance, investment banking or
other advisory services in a merger or specific transaction to the companies referred to in this report, as on the date of this report or
in the past.
Sebi Registration No : INB 010996539
For Private Circulation Only |