Technical Research | November 17, 2011
Daily Technical Report
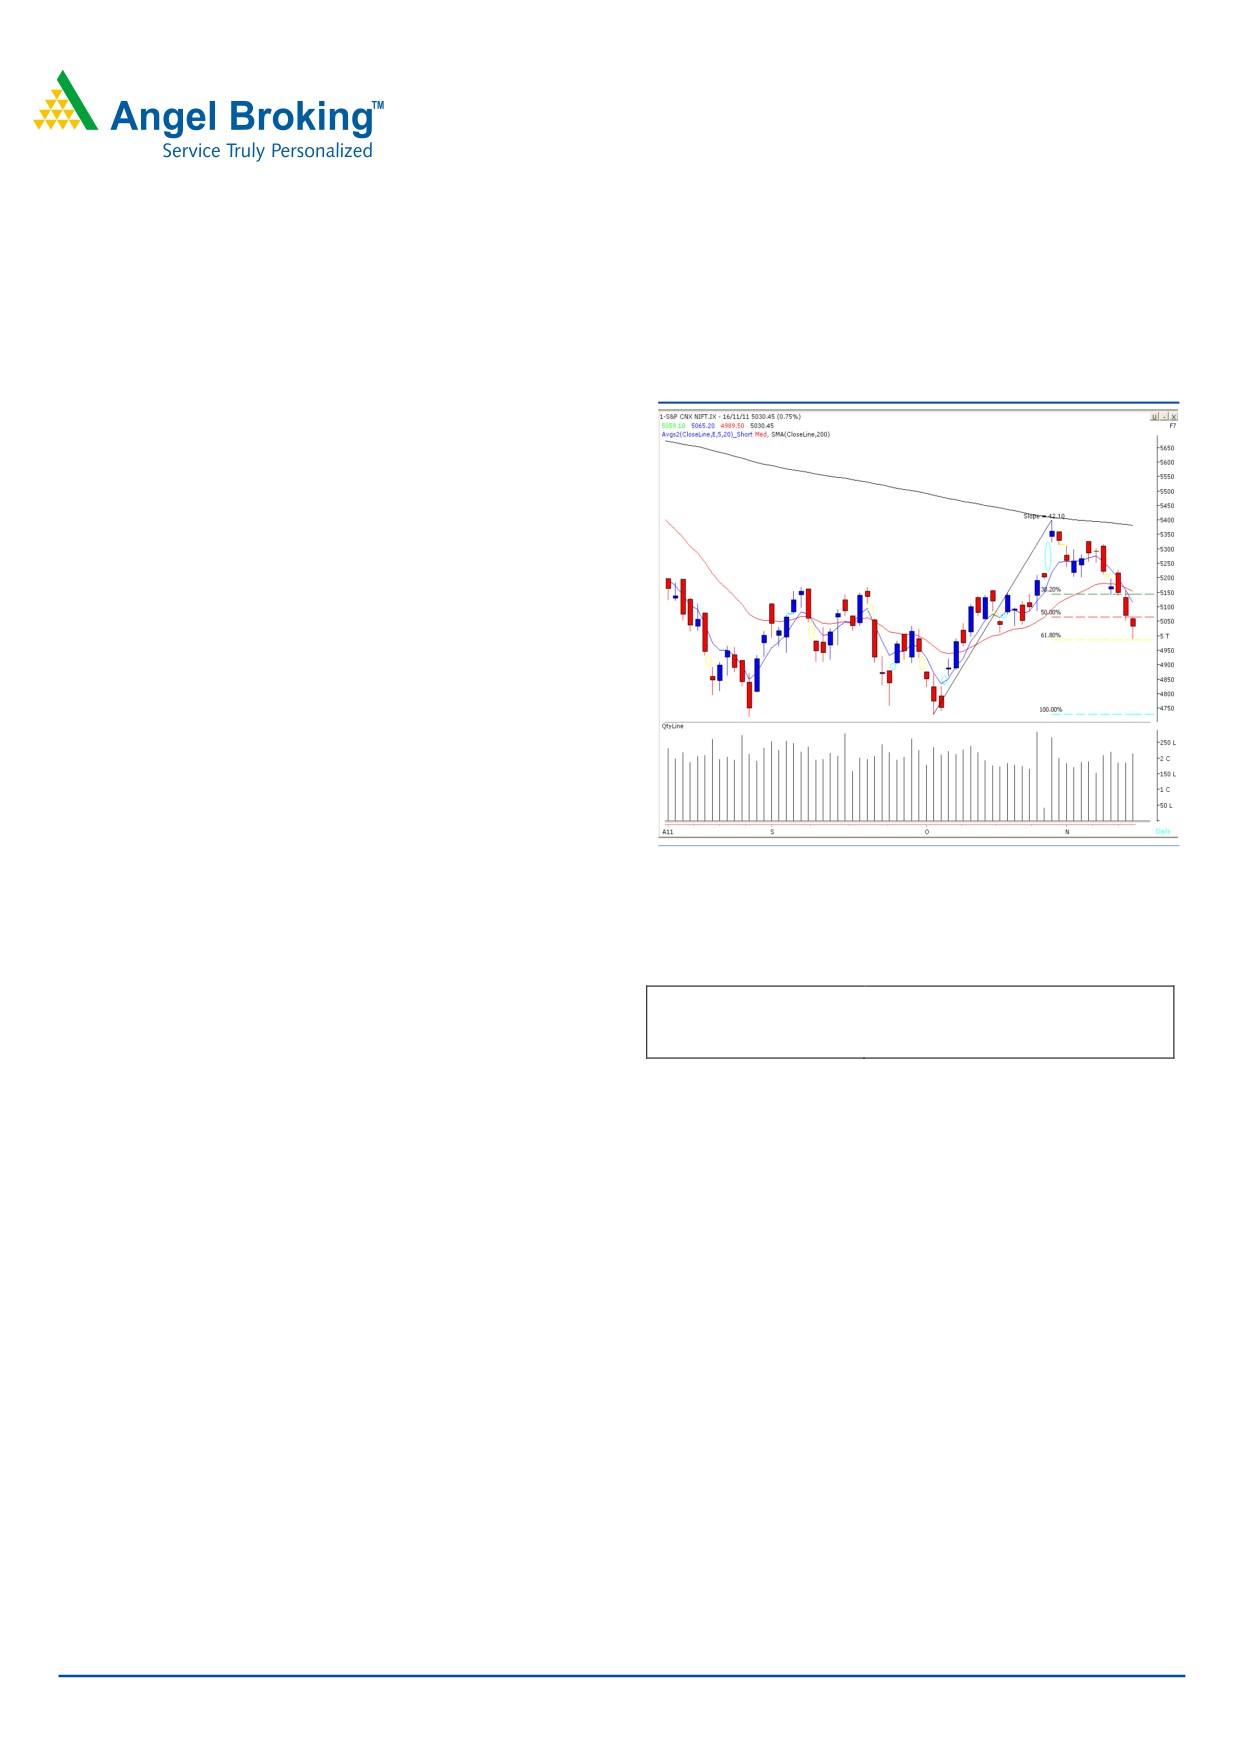
Sensex (16776) / NIFTY (5030)
Exhibit 1: Nifty Daily Chart
Yesterday, we witnessed a gap down opening for a second
consecutive trading session and relentless selling pressure
dragged indices below the psychological level of 16700 /
5000. However, strong bounce back in the latter part of the
session led indices to close above this level. On the sectoral
front Capital Goods, Power and Oil & Gas counters were
among the major losers, whereas the Consumer Durables
and FMCG ended marginally on gaining side. The advance
decline ratio was strongly in favor of declining counters
Formation
• We are observing a negative crossover in Daily “5 & 20
EMA”.
• The Daily chart depicts a Japanese candlestick pattern
Source: Falcon
which resembles a “Bullish Hammer”. This pattern needs a
confirmation.
Actionable points:
Trading strategy:
After a gap down opening indices corrected sharply below
View
Neutral
16700 / 5000 mark. However, a sharp bounce towards the
Resistance levels
5065 - 5085
Support levels
4989 - 4944
end pushed indices higher to close above this level. We are
now observing a “Bullish Hammer” on the daily chart at
61.8% Fibonacci Retracement level of the rise from 15745
to 17908 / 4728 to 5400. The pattern will be confirmed
only if indices manage to break and sustain above the
yesterday’s high of 16878 / 5065. In this case indices may
rally towards 16950 - 17034 / 5085 - 5120 levels. On the
downside, selling pressure may intensify on the violation of
yesterday’s low of 16641 / 4989. As a result, indices may
then test support levels of 16460 - 16300 / 4944 - 4890.
For Private Circulation Only |
1
Technical Research | November 17, 2011
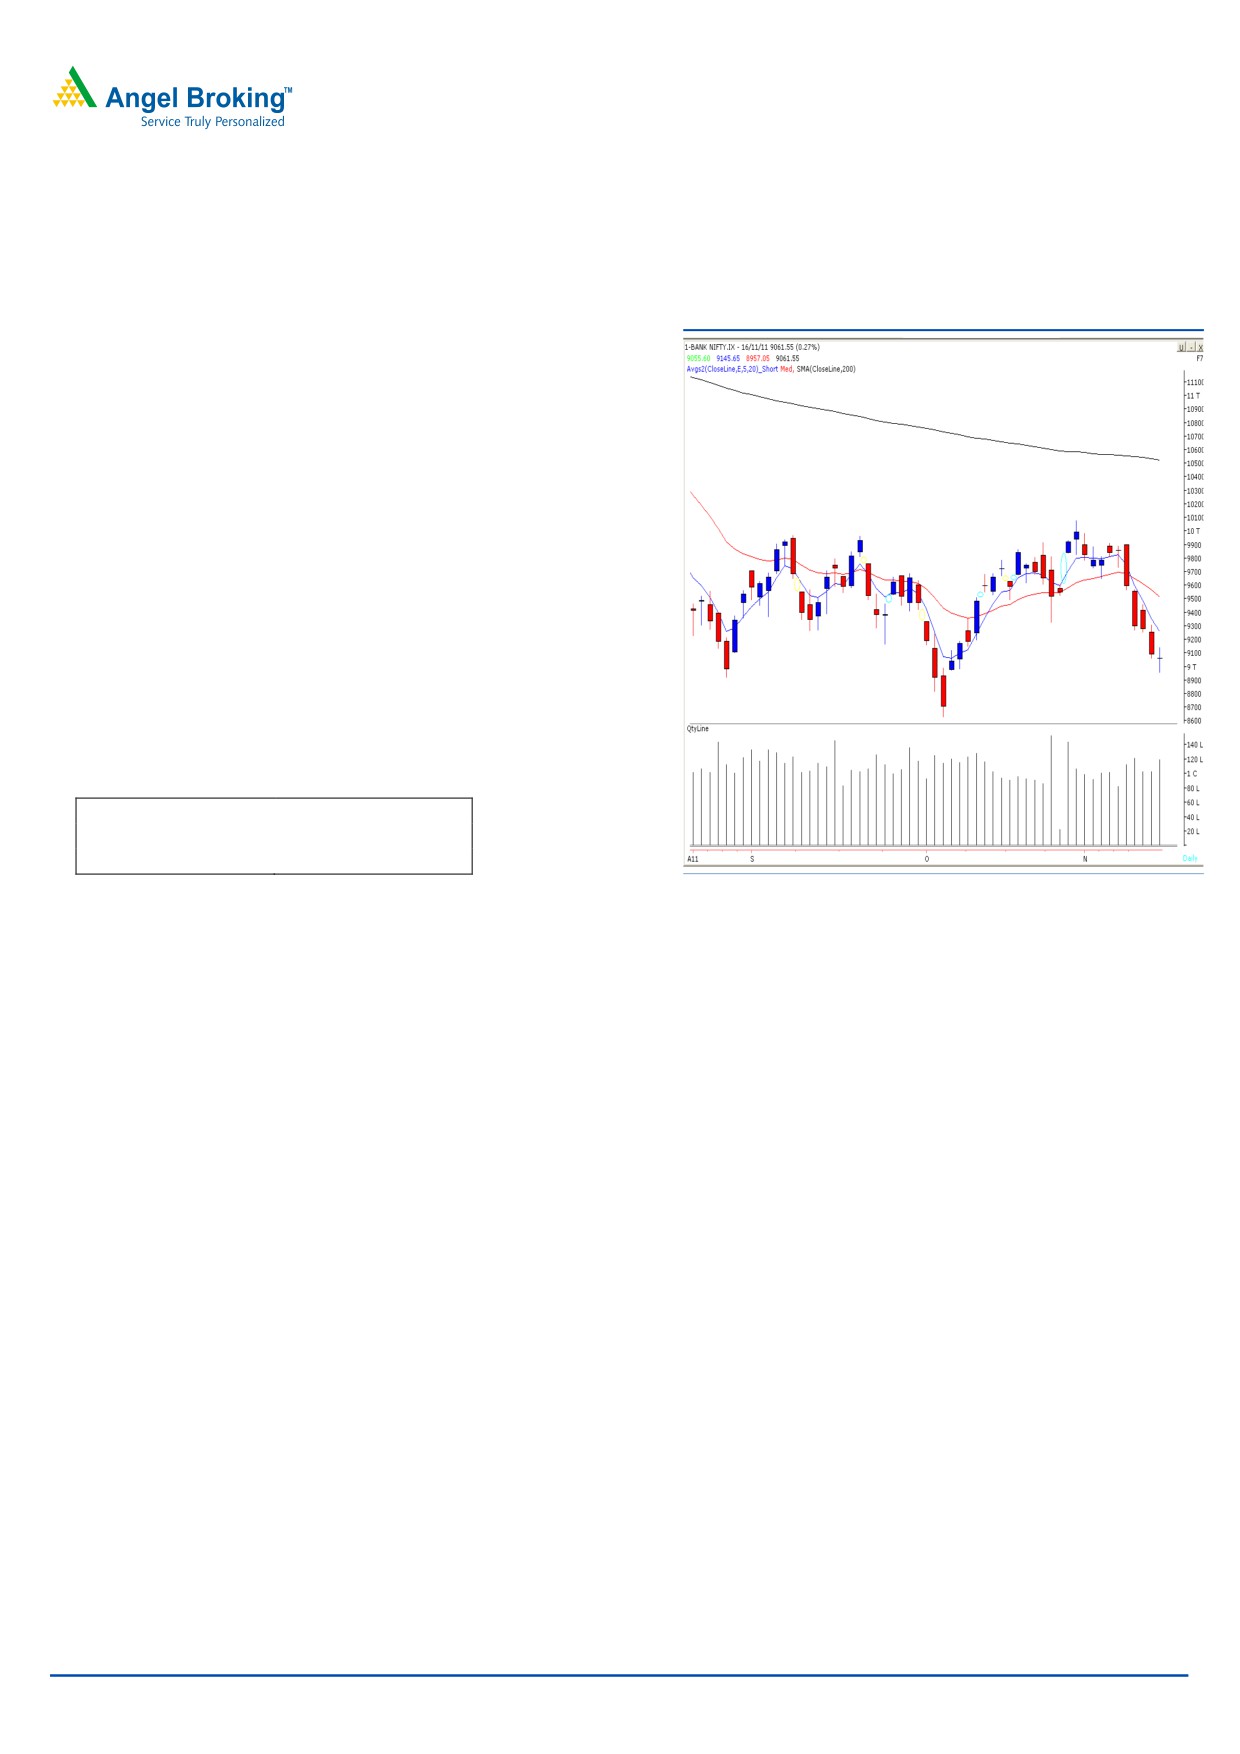
Bank Nifty Outlook - (9062)
Exhibit 2: Bank Nifty Daily Chart
Bank nifty opened with a minor downside gap and has
taken a support near our mentioned support level of
8915. We witnessed extreme volatility throughout the
session, which led the index to close near the initial
opening level. We are observing a “Bullish Doji Star”
Japanese candlestick pattern on daily chart. The said
pattern is a reversal pattern and requires confirmation in
the form of a closing above the high of 9146. Thus going
forward if Bank Nifty sustains above yesterday’s high of
9146, then it is likely to test 9245 - 9410 levels.
On downside, a fall below 8957 may attract further
selling pressure and the bank nifty may then fall towards
the 8626 mark.
Actionable points:
View
Neutral
Resistance Levels
9245 - 9410
Support Levels
8957 - 8626
Source: Falcon
For Private Circulation Only |
2
Technical Research | November 17, 2011
Positive Bias:
Stock Name
5 Day EMA
20 Day EMA
Expected Target
Remarks
SBI
1790
1859
1859
View will change below 1718
Tata Motors
182.5
183.3
195
View will change below 172
Negative Bias:
Stock Name
5 Day EMA
20 Day EMA
Expected Target
Remarks
Grasim
2441.7
2434.3
2300
View will change above 2458
For Private Circulation Only |
3
Technical Research | November 17, 2011
Daily Pivot Levels for Nifty 50 Stocks
SCRIPS
S2
S1
PIVOT
R1
R2
SENSEX
16,529
16,652
16,765
16,889
17,002
NIFTY
4,953
4,992
5,028
5,067
5,104
BANKNIFTY
8,866
8,964
9,055
9,152
9,243
ACC
1,166
1,180
1,195
1,208
1,223
AMBUJACEM
154
156
158
160
163
AXISBANK
959
982
1,002
1,026
1,045
BAJAJ-AUTO
1,669
1,697
1,719
1,747
1,769
BHARTIARTL
387
394
403
410
419
BHEL
275
287
298
309
320
BPCL
492
504
517
529
541
CAIRN
300
305
309
314
318
CIPLA
301
306
310
314
318
DLF
199
205
210
216
221
DRREDDY
1,591
1,603
1,616
1,628
1,641
GAIL
367
379
393
406
420
HCLTECH
395
403
412
421
430
HDFC
612
629
643
660
675
HDFCBANK
454
460
466
472
478
HEROMOTOCO
2,045
2,074
2,117
2,146
2,189
HINDALCO
118
121
124
127
130
HINDUNILVR
384
388
391
395
398
ICICIBANK
760
775
788
802
815
IDFC
108
110
113
115
118
INFY
2,735
2,756
2,780
2,802
2,826
ITC
206
209
212
215
217
JINDALSTEL
509
530
542
563
575
JPASSOCIAT
63
65
67
69
71
KOTAKBANK
474
483
490
499
507
LT
1,193
1,215
1,246
1,268
1,299
M&M
745
760
770
786
796
MARUTI
966
979
994
1,006
1,021
NTPC
166
167
170
171
174
ONGC
253
258
262
266
270
PNB
877
886
900
910
924
POWERGRID
101
103
104
105
107
RANBAXY
455
465
472
481
489
RCOM
75
76
78
80
81
RELCAPITAL
307
314
321
328
335
RELIANCE
826
837
848
859
870
RELINFRA
396
404
413
421
429
RPOWER
90
92
94
97
99
SAIL
89
91
95
97
101
SBIN
1,693
1,729
1,755
1,791
1,817
SESAGOA
192
197
200
205
208
SIEMENS
713
731
759
777
805
STER
109
111
113
115
117
SUNPHARMA
477
483
493
500
510
SUZLON
27
28
30
31
33
TATAMOTORS
175
179
181
185
187
TATAPOWER
95
97
98
99
101
TATASTEEL
382
394
406
418
429
TCS
1,091
1,104
1,118
1,132
1,146
WIPRO
360
367
376
383
391
Technical Research Team
For Private Circulation Only |
4
Technical Report
RESEARCH TEAM
Shardul Kulkarni
Head - Technicals
Sameet Chavan
Technical Analyst
Sacchitanand Uttekar
Technical Analyst
Mehul Kothari
Technical Analyst
Ankur Lakhotia
Technical Analyst
Research Team: 022-3952 6600
DISCLAIMER: This document is not for public distribution and has been furnished to you solely for your information and must not
be reproduced or redistributed to any other person. Persons into whose possession this document may come are required to observe
these restrictions.
Opinion expressed is our current opinion as of the date appearing on this material only. While we endeavor to update on a
reasonable basis the information discussed in this material, there may be regulatory, compliance, or other reasons that prevent us
from doing so. Prospective investors and others are cautioned that any forward-looking statements are not predictions and may be
subject to change without notice. Our proprietary trading and investment businesses may make investment decisions that are
inconsistent with the recommendations expressed herein.
The information in this document has been printed on the basis of publicly available information, internal data and other reliable
sources believed to be true and are for general guidance only. While every effort is made to ensure the accuracy and completeness of
information contained, the company takes no guarantee and assumes no liability for any errors or omissions of the information. No
one can use the information as the basis for any claim, demand or cause of action.
Recipients of this material should rely on their own investigations and take their own professional advice. Each recipient of this
document should make such investigations as it deems necessary to arrive at an independent evaluation of an investment in the
securities of companies referred to in this document (including the merits and risks involved), and should consult their own advisors to
determine the merits and risks of such an investment. Price and value of the investments referred to in this material may go up or
down. Past performance is not a guide for future performance. Certain transactions - futures, options and other derivatives as well as
non-investment grade securities - involve substantial risks and are not suitable for all investors. Reports based on technical analysis
centers on studying charts of a stock's price movement and trading volume, as opposed to focusing on a company's fundamentals
and as such, may not match with a report on a company's fundamentals.
We do not undertake to advise you as to any change of our views expressed in this document. While we would endeavor to update
the information herein on a reasonable basis, Angel Broking, its subsidiaries and associated companies, their directors and
employees are under no obligation to update or keep the information current. Also there may be regulatory, compliance, or other
reasons that may prevent Angel Broking and affiliates from doing so. Prospective investors and others are cautioned that any
forward-looking statements are not predictions and may be subject to change without notice.
Angel Broking Limited and affiliates, including the analyst who has issued this report, may, on the date of this report, and from time
to time, have long or short positions in, and buy or sell the securities of the companies mentioned herein or engage in any other
transaction involving such securities and earn brokerage or compensation or act as advisor or have other potential conflict of interest
with respect to company/ies mentioned herein or inconsistent with any recommendation and related information and opinions.
Angel Broking Limited and affiliates may seek to provide or have engaged in providing corporate finance, investment banking or
other advisory services in a merger or specific transaction to the companies referred to in this report, as on the date of this report or
in the past.
Sebi Registration No: INB 010996539
For Private Circulation Only |