Daily Technical Report
May 17, 2012
Sensex (16030) / NIFTY (4858)
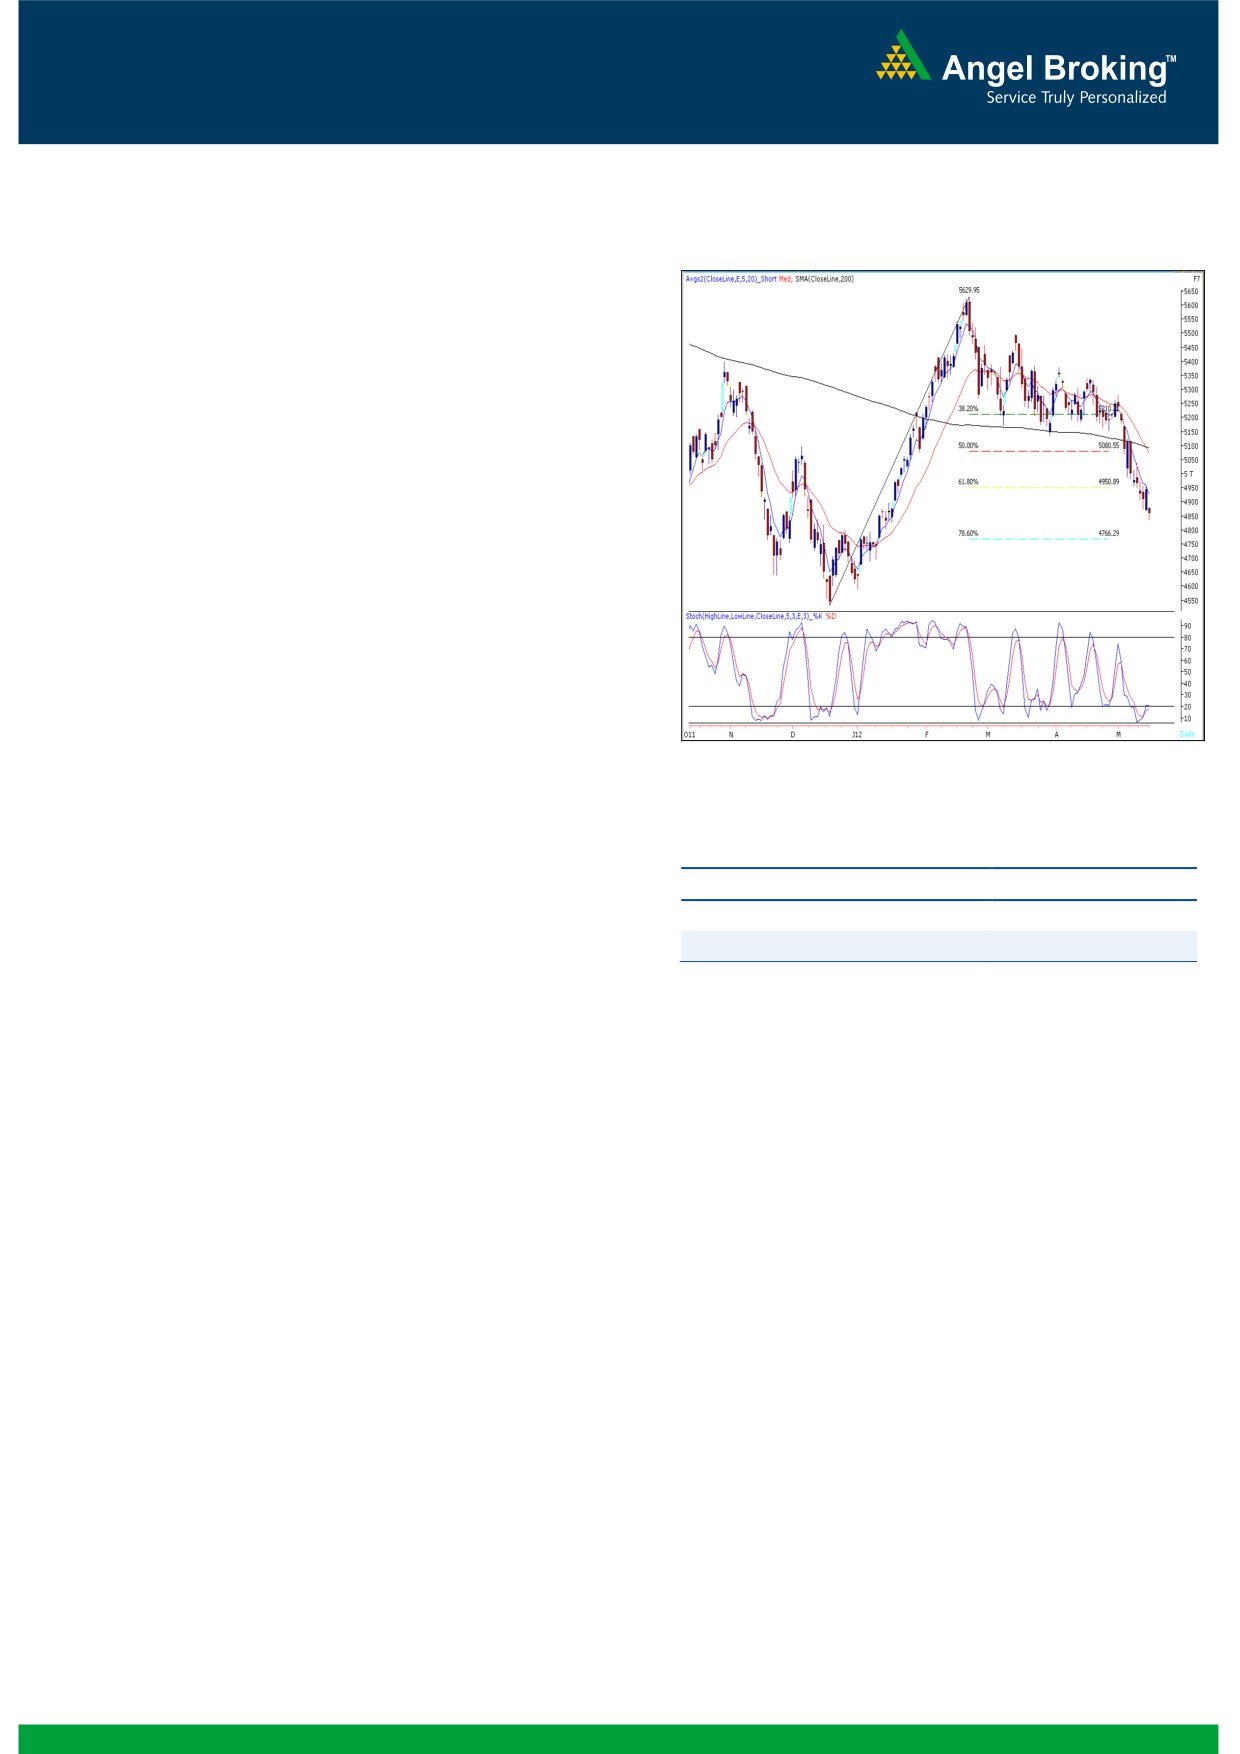
Exhibit 1: Nifty Daily Chart
Yesterday, we witnessed a very pessimistic start for the
markets as indices opened down with a significant,
1.5% downside gap. This negative momentum
continued for the almost the entire day and a minor
recovery in the end led indices to close marginally
above 4850 mark. On the sectoral front Metal, Auto
and Consumer Durable counters contributed heavily
in yesterday’s fall. None of the sectors ended in
positive territory. The advance to decline ratio was
strongly in favor of declining counters (A=983
Formation
The 200-day SMA (Simple Moving Average) and
20-day EMA (Exponential Moving Average) have
now shifted to 16920 / 5092 and 16940 /
Source: Falcon
5072, respectively.
The daily ‘Stochastic’ momentum oscillator is
signaling a positive crossover.
Actionable points:
Indices have now tested 16430 / 4950 level,
View
Neutral
which is the 61.8 % Fibonacci Retracement level
Resistance Levels
4910 - 4957
of the rise from
15135
/
4531 (Low on
Support Levels
4837 - 4800
December 23, 2011) to 18524 / 5630 (High on
February 22, 2012).
Trading strategy:
We witnessed a massive gap down opening during
yesterday's session on the back of extreme pessimism
across all Asian bourses (mainly observed in Hang
Seng Index) and Rupee closing at an all time low. As
mentioned, the oversold condition of momentum
oscillators does not indicate an immediate reversal.
Thus, only a move beyond 16220 / 4910 would
confirm the beginning of a pullback in the strong
downward slide of the index and we may witness a
rally up to 16390 - 16447/ 4957 - 4976 levels.
Conversely, the support levels are seen around the
15974 - 15860 / 4837 - 4800 mark.
1
Daily Technical Report
May 17, 2012
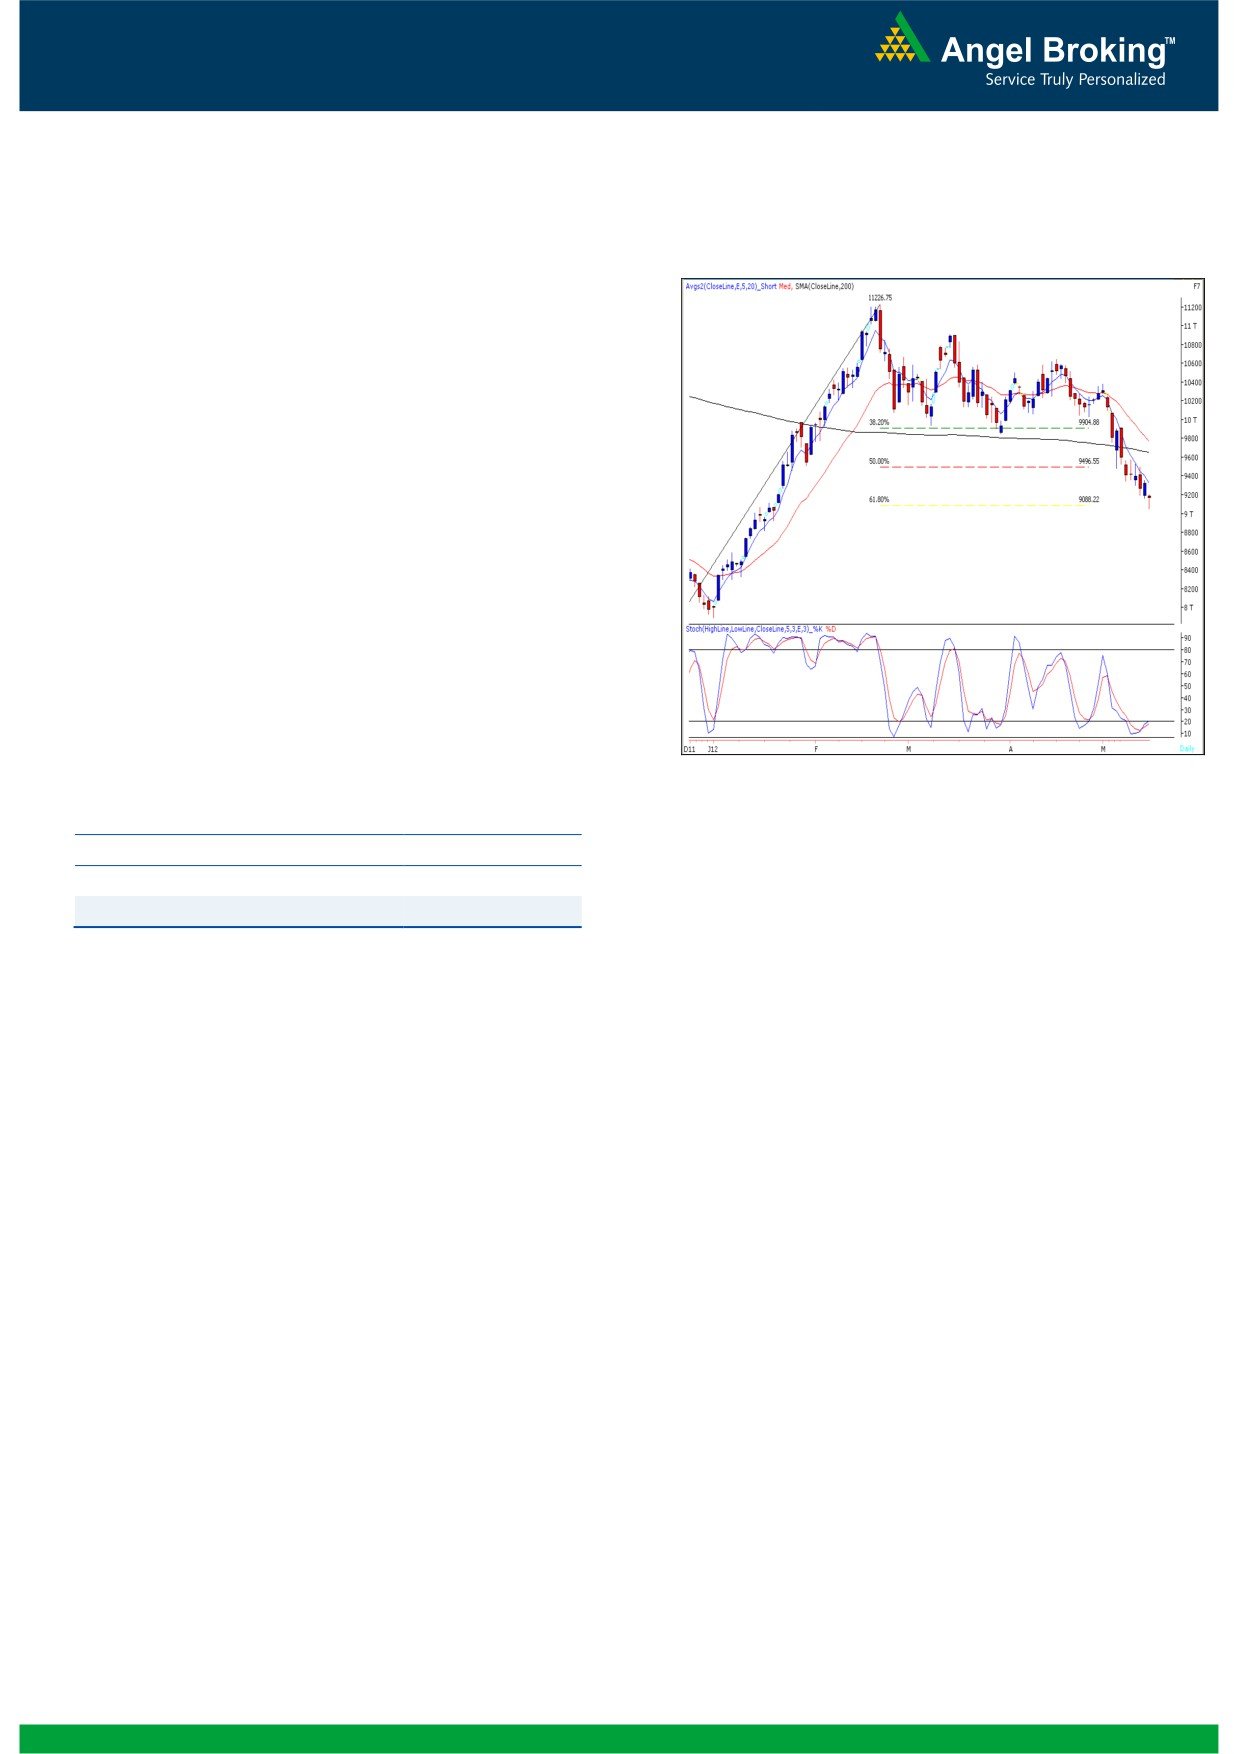
Bank Nifty Outlook - (9164)
Yesterday, Bank Nifty opened on a pessimistic note in
Exhibit 2: Bank Nifty Daily Chart
line with our benchmark indices and managed to
close below the mentioned range of 9200 - 9700.
The index found support near the mentioned level of
9060 which coincides with
61.8% Fibonacci
retracement of the rise from December 20, 2011 -
February
26,
2012 and bounced back. The
momentum oscillators on the daily chart continue to
remain in oversold condition. We are now witnessing
“Hammer” candlestick pattern formation. The bullish
implication on the mentioned candlestick pattern will
only be seen if the index sustains above yesterday’s
high of 9208. In such a scenario the index is likely to
rally towards 9310 - 9360 levels. On the downside
9105 - 9047 levels are likely to act as support in
coming trading session. The mentioned pattern will be
negated only if the index manages to close below
9047 levels.
Source: Falcon
Actionable points:
View
Neutral
Resistance Levels
9208 - 9310 - 9360
Support Levels
9105 - 9047
2
Daily Technical Report
May 17, 2012
Research Team Tel: 022 - 39357800
DISCLAIMER
This document is solely for the personal information of the recipient, and must not be singularly used as the basis of any investment
decision. Nothing in this document should be construed as investment or financial advice. Each recipient of this document should make
such investigations as they deem necessary to arrive at an independent evaluation of an investment in the securities of the companies
referred to in this document (including the merits and risks involved), and should consult their own advisors to determine the merits and
risks of such an investment.
Angel Broking Limited, its affiliates, directors, its proprietary trading and investment businesses may, from time to time, make
investment decisions that are inconsistent with or contradictory to the recommendations expressed herein. The views contained in this
document are those of the analyst, and the company may or may not subscribe to all the views expressed within.
Reports based on technical and derivative analysis center on studying charts of a stock's price movement, outstanding positions and
trading volume, as opposed to focusing on a company's fundamentals and, as such, may not match with a report on a company's
fundamentals.
The information in this document has been printed on the basis of publicly available information, internal data and other reliable
sources believed to be true, but we do not represent that it is accurate or complete and it should not be relied on as such, as this
document is for general guidance only. Angel Broking Limited or any of its affiliates/ group companies shall not be in any way
responsible for any loss or damage that may arise to any person from any inadvertent error in the information contained in this report.
Angel Broking Limited has not independently verified all the information contained within this document. Accordingly, we cannot testify,
nor make any representation or warranty, express or implied, to the accuracy, contents or data contained within this document. While
Angel Broking Limited endeavours to update on a reasonable basis the information discussed in this material, there may be regulatory,
compliance, or other reasons that prevent us from doing so.
This document is being supplied to you solely for your information, and its contents, information or data may not be reproduced,
redistributed or passed on, directly or indirectly.
Angel Broking Limited and its affiliates may seek to provide or have engaged in providing corporate finance, investment banking or
other advisory services in a merger or specific transaction to the companies referred to in this report, as on the date of this report or in
the past.
Neither Angel Broking Limited, nor its directors, employees or affiliates shall be liable for any loss or damage that may arise from or in
connection with the use of this information.
Note: Please refer to the important `Stock Holding Disclosure' report on the Angel website (Research Section). Also, please refer to the
latest update on respective stocks for the disclosure status in respect of those stocks. Angel Broking Limited and its affiliates may have
investment positions in the stocks recommended in this report.
Research Team
Shardul Kulkarni
-
Head - Technicals
Sameet Chavan
-
Technical Analyst
Sacchitanand Uttekar
-
Technical Analyst
Mehul Kothari
-
Technical Analyst
Ankur Lakhotia
-
Technical Analyst
Angel Broking Pvt. Ltd.
Registered Office: G-1, Ackruti Trade Centre, Rd. No. 7, MIDC, Andheri (E), Mumbai - 400 093.
Corporate Office: 6th Floor, Ackruti Star, MIDC, Andheri (E), Mumbai - 400 093. Tel: (022) 3952 6600
Sebi Registration No: INB 010996539
4