Technical Research | April 17, 2012
Daily Technical Report
Sensex (17151) / NIFTY (5226)
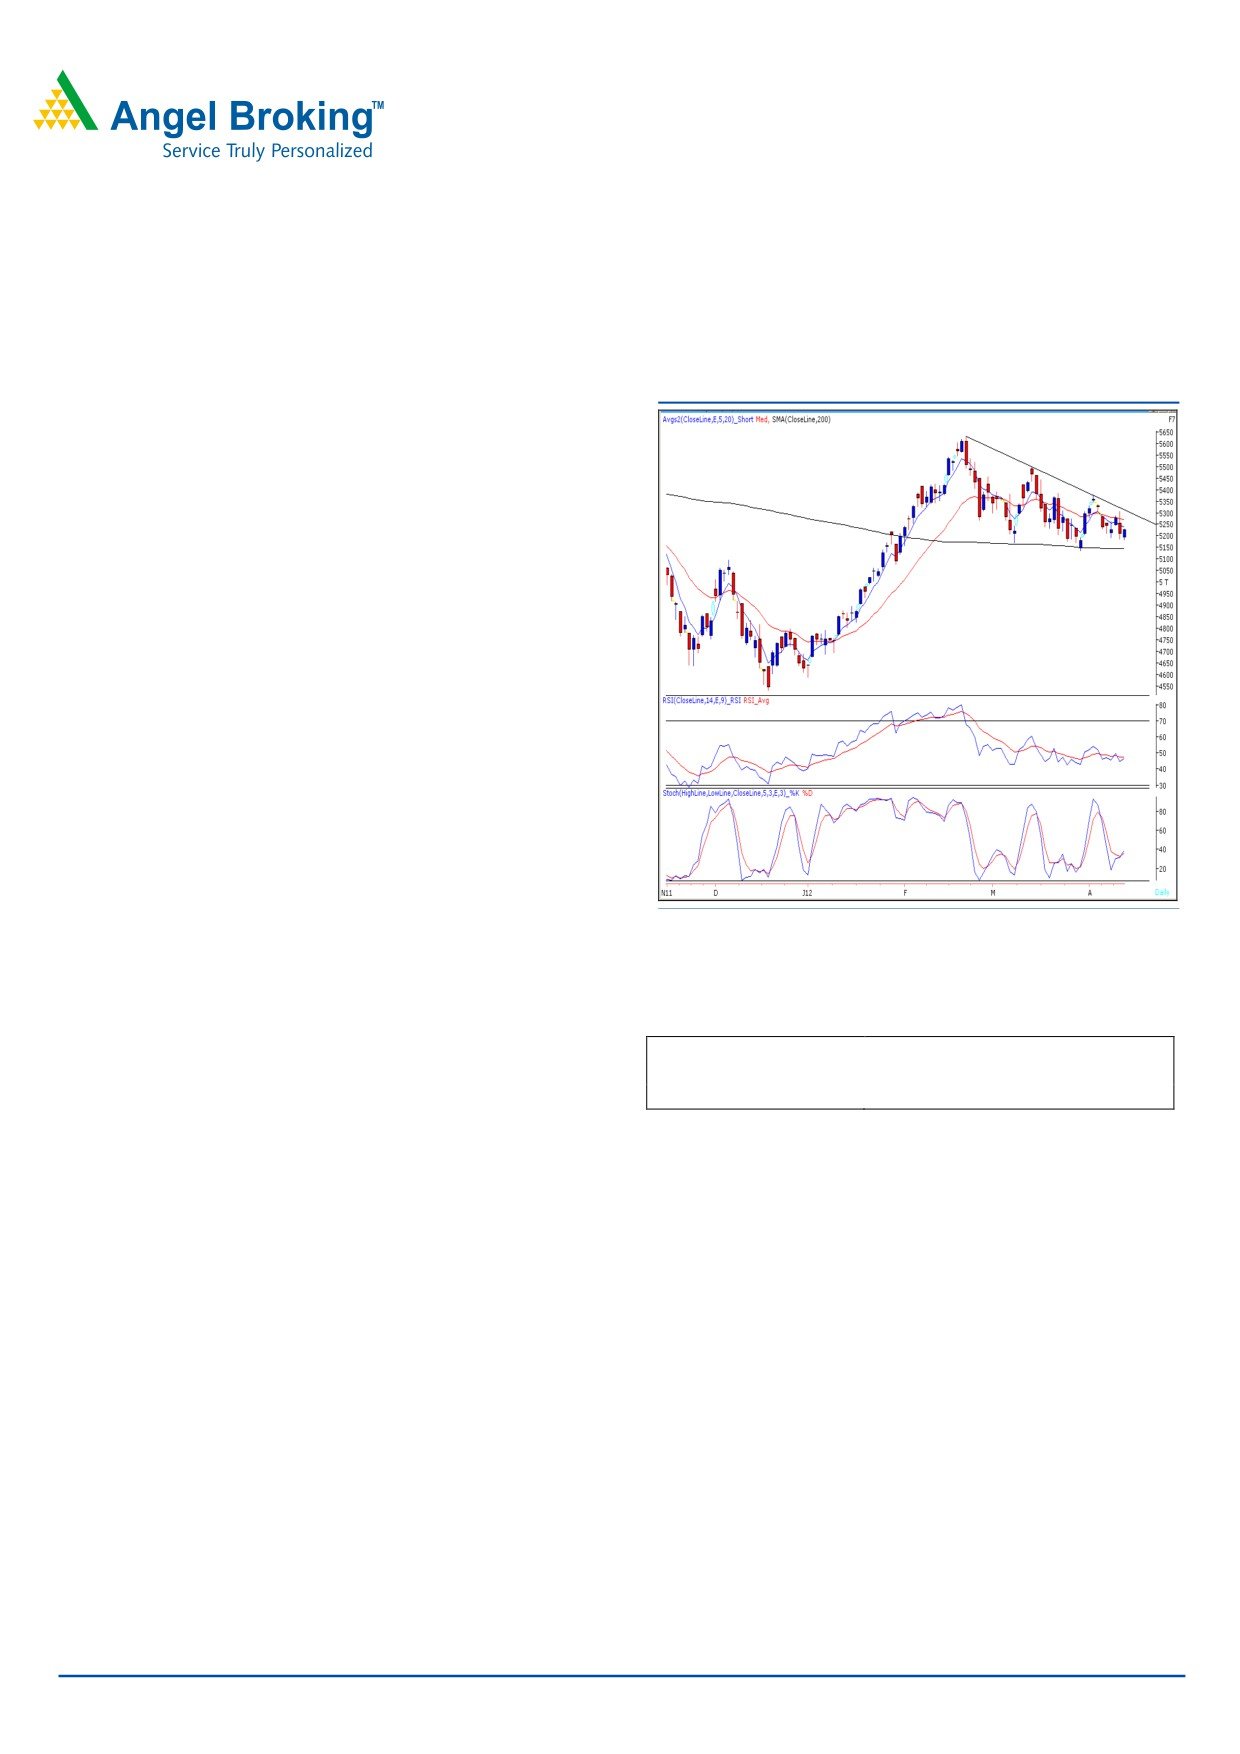
Exhibit 1: Nifty Daily Chart
The week began on flat note in-line with global cues.
Further, indices remained choppy and volumes were seen in
only selective counters as market participants were a little
reluctant to take positions across sectors, prior to the RBI
Monetary Policy. On sectoral front, Auto, Banking and
Capital Goods sectors were among the major gainers;
whereas Teck and IT stocks remained under pressure for yet
another trading session. The advance to decline ratio was in
favor of advancing counters (A=1551 D=1223) (Source -
Formation:
• The 200-day SMA (Simple Moving Average) and 20-
day EMA (Exponential Moving Average) have now shifted to
17100 / 5150 and 17400 / 5300, respectively.
• The ‘20-Week EMA’ is placed at 17200 / 5200 level.
Source: Falcon
• We are witnessing a ‘Downward Sloping Trend Line’
resistance around 17400 / 5300 level.
Actionable points:
View
Neutral
Trading strategy:
Resistance levels
5255 - 5307
Support Levels
5170 - 5135
Yesterday, markets opened on a flat note and remained in
a range throughout the session. As expected, Friday’s low of
The coming trading session is expected to trade with
17027 / 5185 acted as a decent support for the markets.
enhanced volatility on account of announcement of “RBI
There is hardly any change in the technical observations
Monetary Policy”. Hence, we advise traders to stay light on
and thus we would reiterate our previous view that if indices
positions and trade with strict stop losses.
sustain below swing low of 17010 / 5170, then we may
witness weakness and indices may drift towards the strong
support level of
16920
/
5135. Conversely, positive
momentum may be witnessed above 17173 / 5234 level. In
this case, indices are likely to move towards 17408 / 5307
level. Only a sustainable move, with strong volumes, above
the weekly high 17408 / 5307 will indicate resumption of a
strong uptrend. Indices then may rally towards 17664 -
18041 / 5379 - 5500 levels.
For Private Circulation Only |
1
Technical Research | April 17, 2012
Bank Nifty Outlook - (10433)
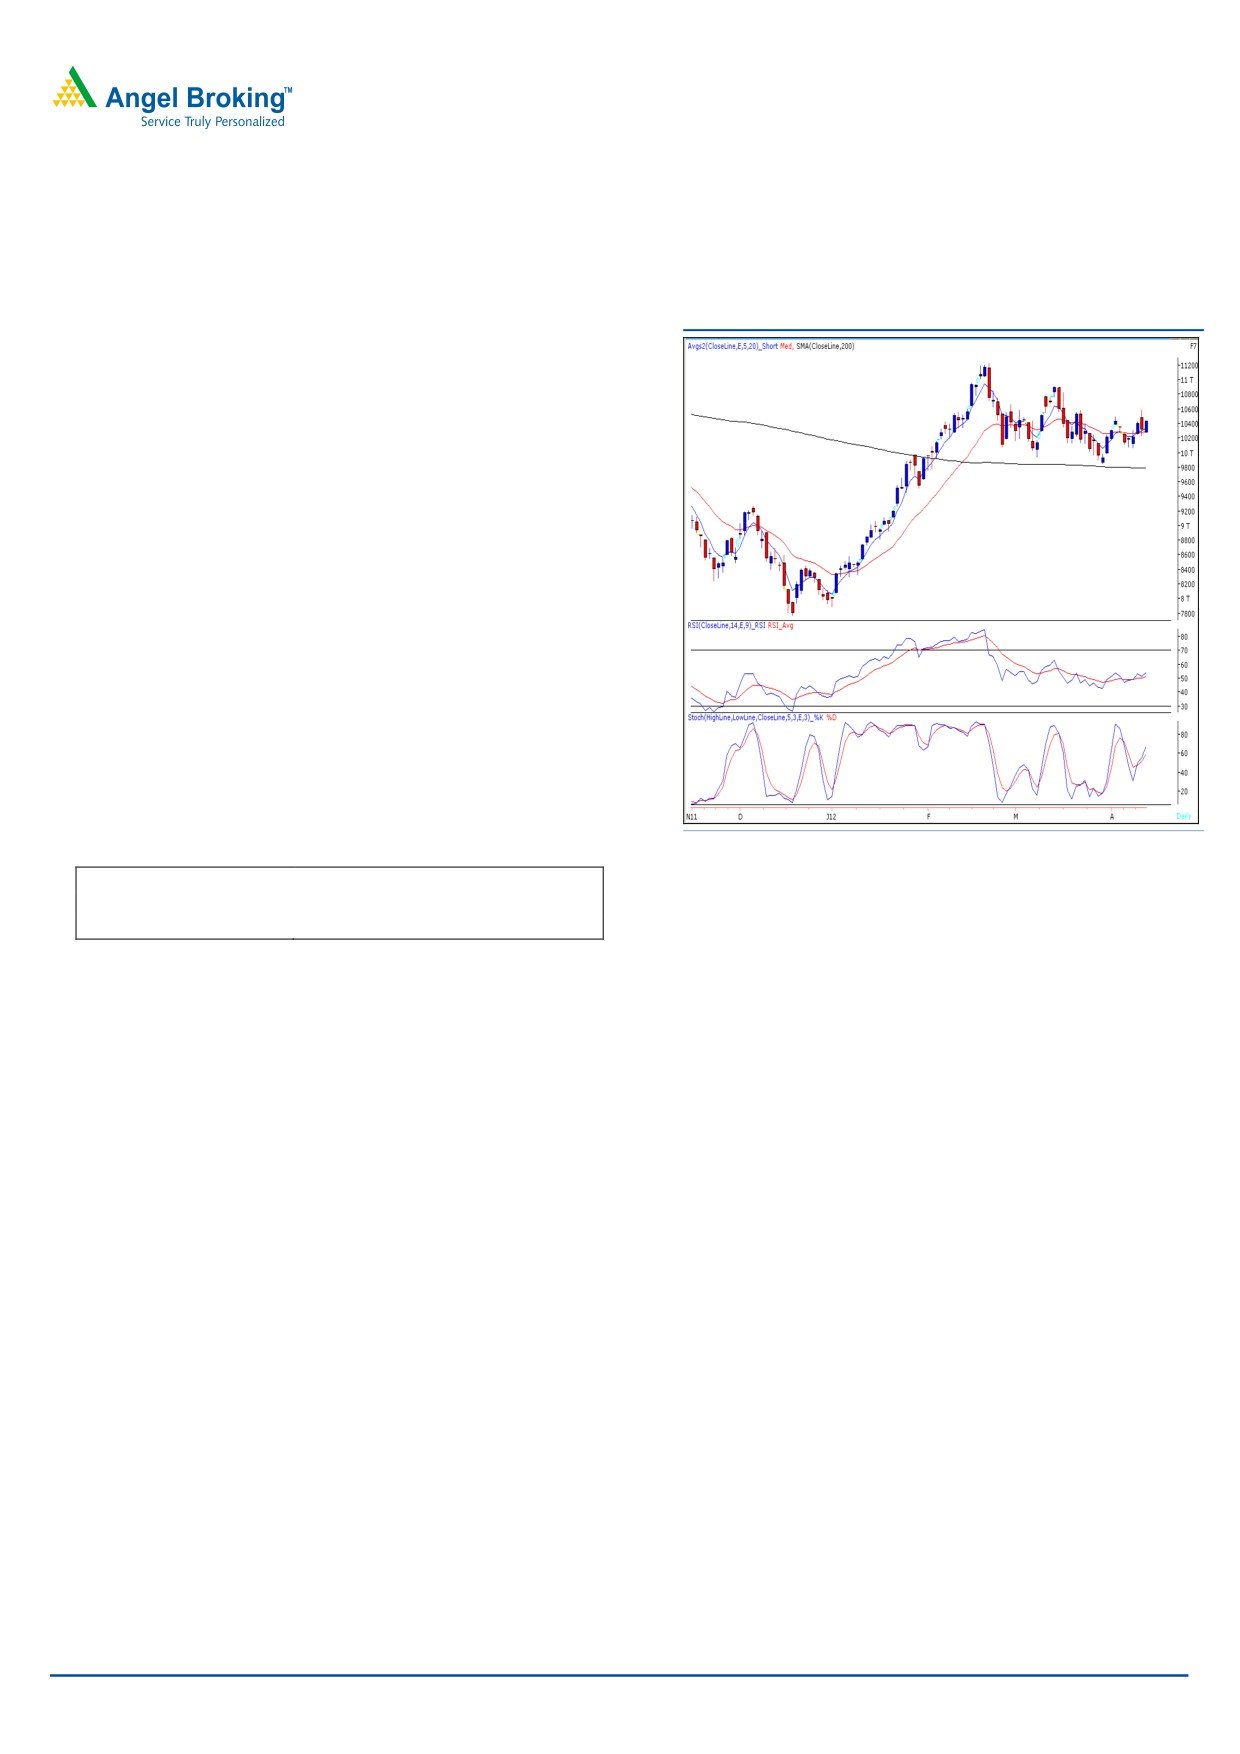
Exhibit 2: Bank Nifty Daily Chart
Yesterday, Bank Nifty opened on a flat note and traded
with extreme volatility throughout the session to close near
the highest point of the day. It was seen that market
participants are taking positions in anticipation of a
favorable RBI monetary policy. The positive crossover in
momentum oscillators on the daily chart is still intact;
however it does not imply much confidence. Broadly
speaking the index is currently in a sideways trading
range of 10600 - 10150. Only a move beyond the
mentioned trading range will dictate a clear direction of
the trend. Within this range, on the upside 10512 -
10588 - 10625 levels are likely to act as resistance and
10235 - 10150 levels are likely to act as support in
coming trading sessions. In view of RBI monetary policy
we expect Bank Nifty to be volatile in today’s session.
Actionable points:
Source: Falcon
View
Neutral
Resistance Levels
10512 - 10588 - 10625
Support Levels
10235 - 10150
For Private Circulation Only |
2
Technical Research | April 17, 2012
Positive Bias:
Positive
Expected
Stock Name
CMP
5 Day EMA
20 Day EMA
Remarks
Above
Target
Maruti
View will change below
1342.3
1317.5
1313.1
1353
1448
1300
Karnataka
95.7
94.7
95.5
98.5
114
View will change below 91
Bank
For Private Circulation Only |
3
Technical Research | April 17, 2012
Daily Pivot Levels for Nifty 50 Stocks
SCRIPS
S2
S1
PIVOT
R1
R2
SENSEX
16,948
17,050
17,111
17,213
17,274
NIFTY
5,164
5,195
5,214
5,245
5,264
BANKNIFTY
10,211
10,322
10,385
10,496
10,559
ACC
1,209
1,224
1,245
1,259
1,281
AMBUJACEM
155
157
160
162
164
AXISBANK
1,143
1,170
1,185
1,212
1,227
BAJAJ-AUTO
1,620
1,635
1,648
1,662
1,675
BHARTIARTL
310
314
318
321
325
BHEL
252
256
260
264
267
BPCL
666
672
678
684
690
CAIRN
335
340
343
347
350
CIPLA
308
310
314
316
320
COALINDIA
332
336
338
341
344
DLF
193
196
199
202
205
DRREDDY
1,701
1,730
1,747
1,776
1,793
GAIL
343
350
354
361
365
HCLTECH
464
475
481
492
498
HDFC
670
674
677
681
685
HDFCBANK
521
526
528
532
535
HEROMOTOCO
2,020
2,044
2,064
2,089
2,108
HINDALCO
122
123
124
125
126
HINDUNILVR
417
419
423
425
428
ICICIBANK
851
862
869
881
888
IDFC
129
131
132
135
136
INFY
2,281
2,323
2,375
2,416
2,468
ITC
232
236
239
244
247
JINDALSTEL
482
492
500
509
517
JPASSOCIAT
75
77
79
81
83
KOTAKBANK
574
579
584
589
594
LT
1,265
1,283
1,295
1,313
1,324
M&M
674
680
686
692
698
MARUTI
1,292
1,317
1,335
1,360
1,378
NTPC
163
164
165
167
168
ONGC
256
258
260
261
264
PNB
882
903
915
936
948
POWERGRID
110
111
112
113
113
RANBAXY
491
499
505
513
519
RCOM
82
83
85
86
88
RELIANCE
728
738
746
756
763
RELINFRA
531
541
548
558
565
RPOWER
112
113
115
116
117
SAIL
91
92
94
95
97
SBIN
2,174
2,220
2,246
2,292
2,318
SESAGOA
181
183
185
187
188
SIEMENS
771
787
798
814
825
STER
103
105
106
107
108
SUNPHARMA
568
573
581
586
594
SUZLON
24
24
24
24
25
TATAMOTORS
281
291
296
306
312
TATAPOWER
102
102
103
104
105
TATASTEEL
440
448
452
460
464
TCS
1,045
1,057
1,066
1,078
1,087
WIPRO
406
414
421
428
435
Technical Research Team
For Private Circulation Only |
4
Technical Report
RESEARCH TEAM
Shardul Kulkarni
Head - Technicals
Sameet Chavan
Technical Analyst
Sacchitanand Uttekar
Technical Analyst
Mehul Kothari
Technical Analyst
Ankur Lakhotia
Technical Analyst
Research Team: 022-3952 6600
DISCLAIMER: This document is not for public distribution and has been furnished to you solely for your information and must not
be reproduced or redistributed to any other person. Persons into whose possession this document may come are required to observe
these restrictions.
Opinion expressed is our current opinion as of the date appearing on this material only. While we endeavor to update on a
reasonable basis the information discussed in this material, there may be regulatory, compliance, or other reasons that prevent us
from doing so. Prospective investors and others are cautioned that any forward-looking statements are not predictions and may be
subject to change without notice. Our proprietary trading and investment businesses may make investment decisions that are
inconsistent with the recommendations expressed herein.
The information in this document has been printed on the basis of publicly available information, internal data and other reliable
sources believed to be true and are for general guidance only. While every effort is made to ensure the accuracy and completeness of
information contained, the company takes no guarantee and assumes no liability for any errors or omissions of the information. No
one can use the information as the basis for any claim, demand or cause of action.
Recipients of this material should rely on their own investigations and take their own professional advice. Each recipient of this
document should make such investigations as it deems necessary to arrive at an independent evaluation of an investment in the
securities of companies referred to in this document (including the merits and risks involved), and should consult their own advisors to
determine the merits and risks of such an investment. Price and value of the investments referred to in this material may go up or
down. Past performance is not a guide for future performance. Certain transactions - futures, options and other derivatives as well as
non-investment grade securities - involve substantial risks and are not suitable for all investors. Reports based on technical analysis
centers on studying charts of a stock's price movement and trading volume, as opposed to focusing on a company's fundamentals
and as such, may not match with a report on a company's fundamentals.
We do not undertake to advise you as to any change of our views expressed in this document. While we would endeavor to update
the information herein on a reasonable basis, Angel Broking, its subsidiaries and associated companies, their directors and
employees are under no obligation to update or keep the information current. Also there may be regulatory, compliance, or other
reasons that may prevent Angel Broking and affiliates from doing so. Prospective investors and others are cautioned that any
forward-looking statements are not predictions and may be subject to change without notice.
Angel Broking Limited and affiliates, including the analyst who has issued this report, may, on the date of this report, and from time
to time, have long or short positions in, and buy or sell the securities of the companies mentioned herein or engage in any other
transaction involving such securities and earn brokerage or compensation or act as advisor or have other potential conflict of interest
with respect to company/ies mentioned herein or inconsistent with any recommendation and related information and opinions.
Angel Broking Limited and affiliates may seek to provide or have engaged in providing corporate finance, investment banking or
other advisory services in a merger or specific transaction to the companies referred to in this report, as on the date of this report or
in the past.
Sebi Registration No: INB 010996539
For Private Circulation Only |