Technical Research | February 17, 2012
Daily Technical Report
Sensex (18154) / NIFTY (5522)
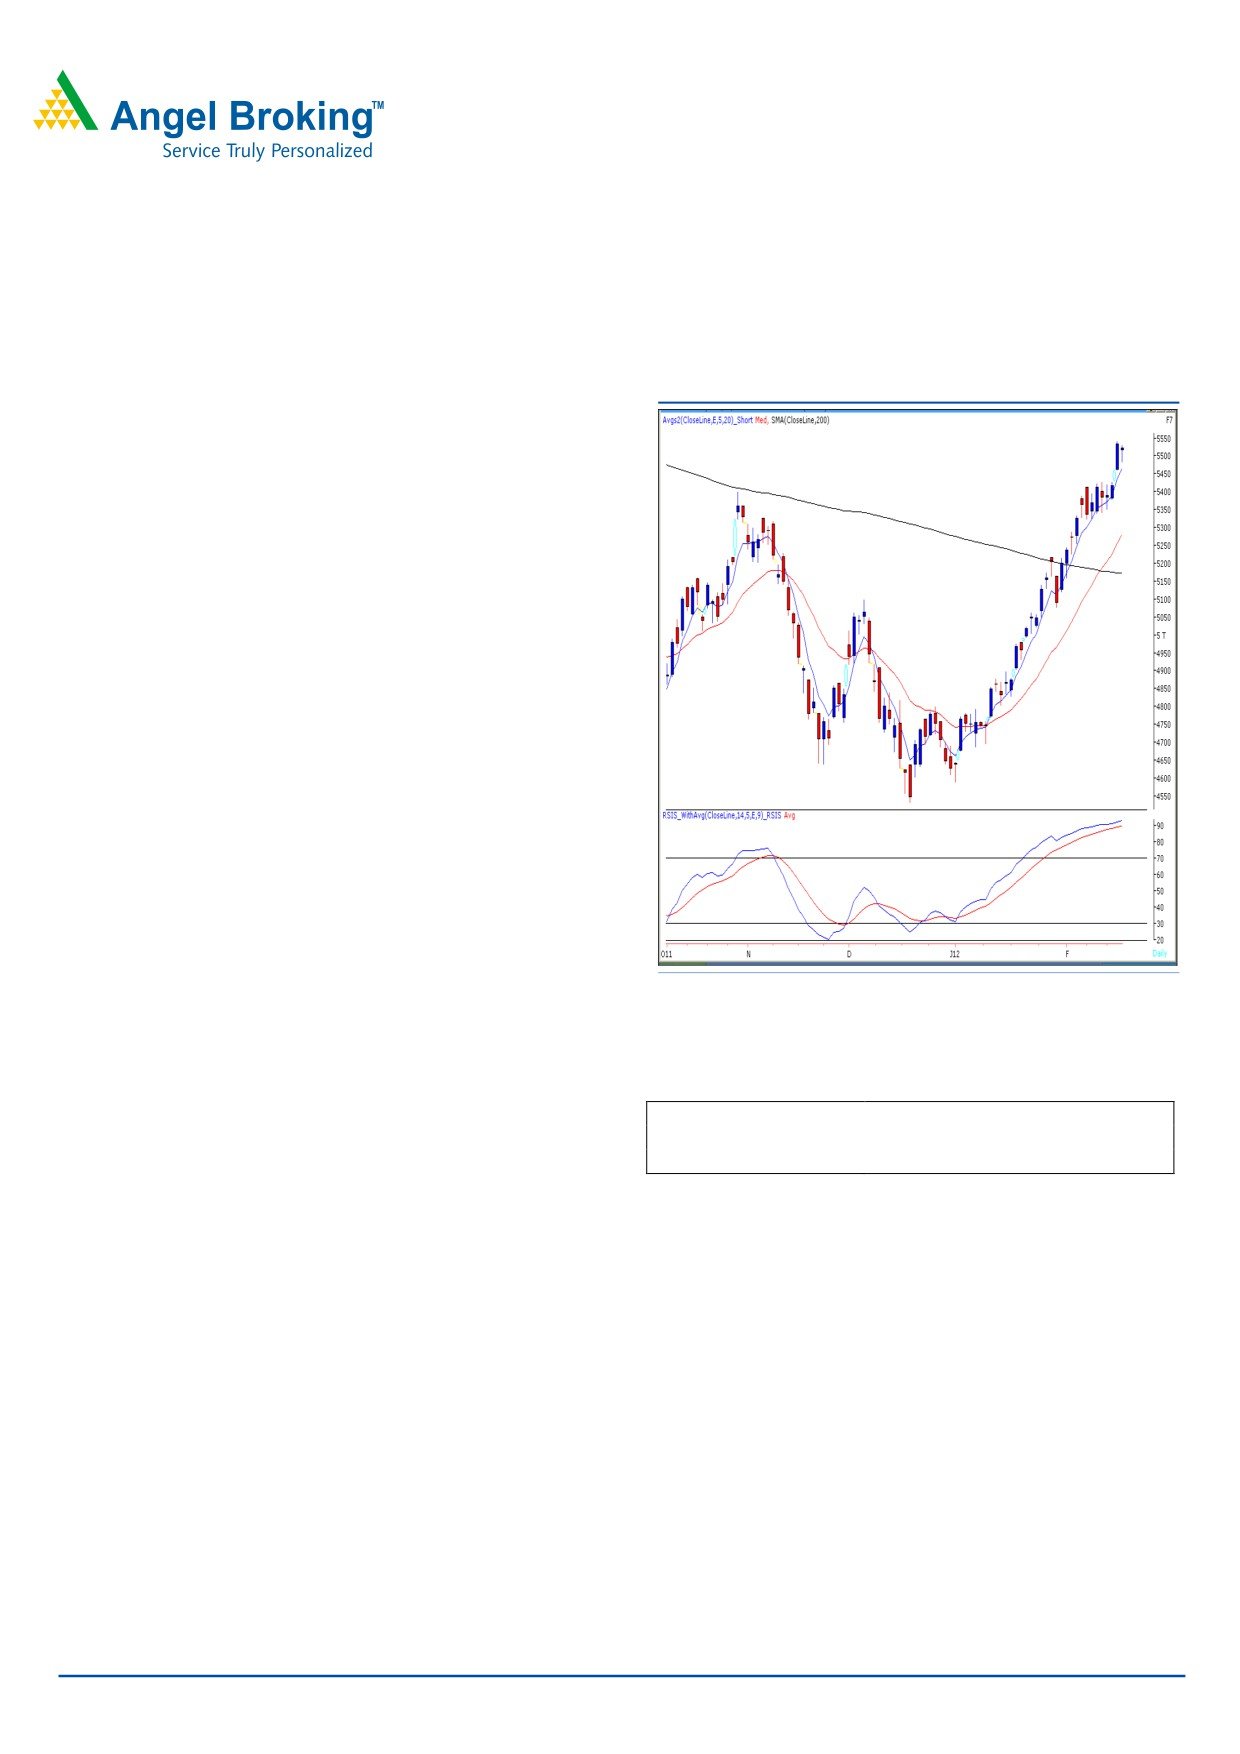
Exhibit 1: Nifty Daily Chart
After witnessing a strong upside rally on Wednesday,
Indices opened with a downside gap during yesterday’s
session. Subsequently, markets traded in a narrow range
throughout the day to close almost at the initial opening
level. On the sectoral front, Realty, Power and Capital
Goods counters were among the major gainers, whereas
Metal and Oil & Gas sectors ended on a losing side. The
advance to decline ratio was in favor of advancing
Formation:
• Indices have given a break out from the narrow range
of 17579 - 17890 / 5322 - 5428. The target of this
breakout is at 18440 - 18580 / 5550 - 5590.
• The “RSI-Smoothened” oscillator on the daily chart is
placed in extreme overbought territory.
• Yesterday’s price action can be called as “Inside Day”
Japanese candlestick formation.
Source: Falcon
Trading strategy:
Actionable points:
View
Positive Above 5542
Yesterday, after a downside opening indices traded in a
Expected Targets
5550 - 5590
narrow range throughout the day. Hence, yesterday’s price
Support levels
5460 - 5420
action called as an “Inside Day” formation. This candlestick
formation occurs when the entire daily price range for a
given security falls within the price range of the previous
day. An inside day is often used to signal indecision
because neither the bulls nor the bears are able to send the
price beyond the range of the previous day. Hence,
Wednesday’s high of 18231 / 5542 remains an immediate
resistance. A move beyond this level, on the back of
optimism in global markets, may push indices higher to test
18440 - 18580 / 5550 - 5590 levels. Conversely, if indices
trade below yesterday’s low of 18043 / 5483 level then
they are likely to slide towards the next support levels of
18000 - 17850 / 5460 - 5420.
For Private Circulation Only |
1
Technical Research | February 17, 2012
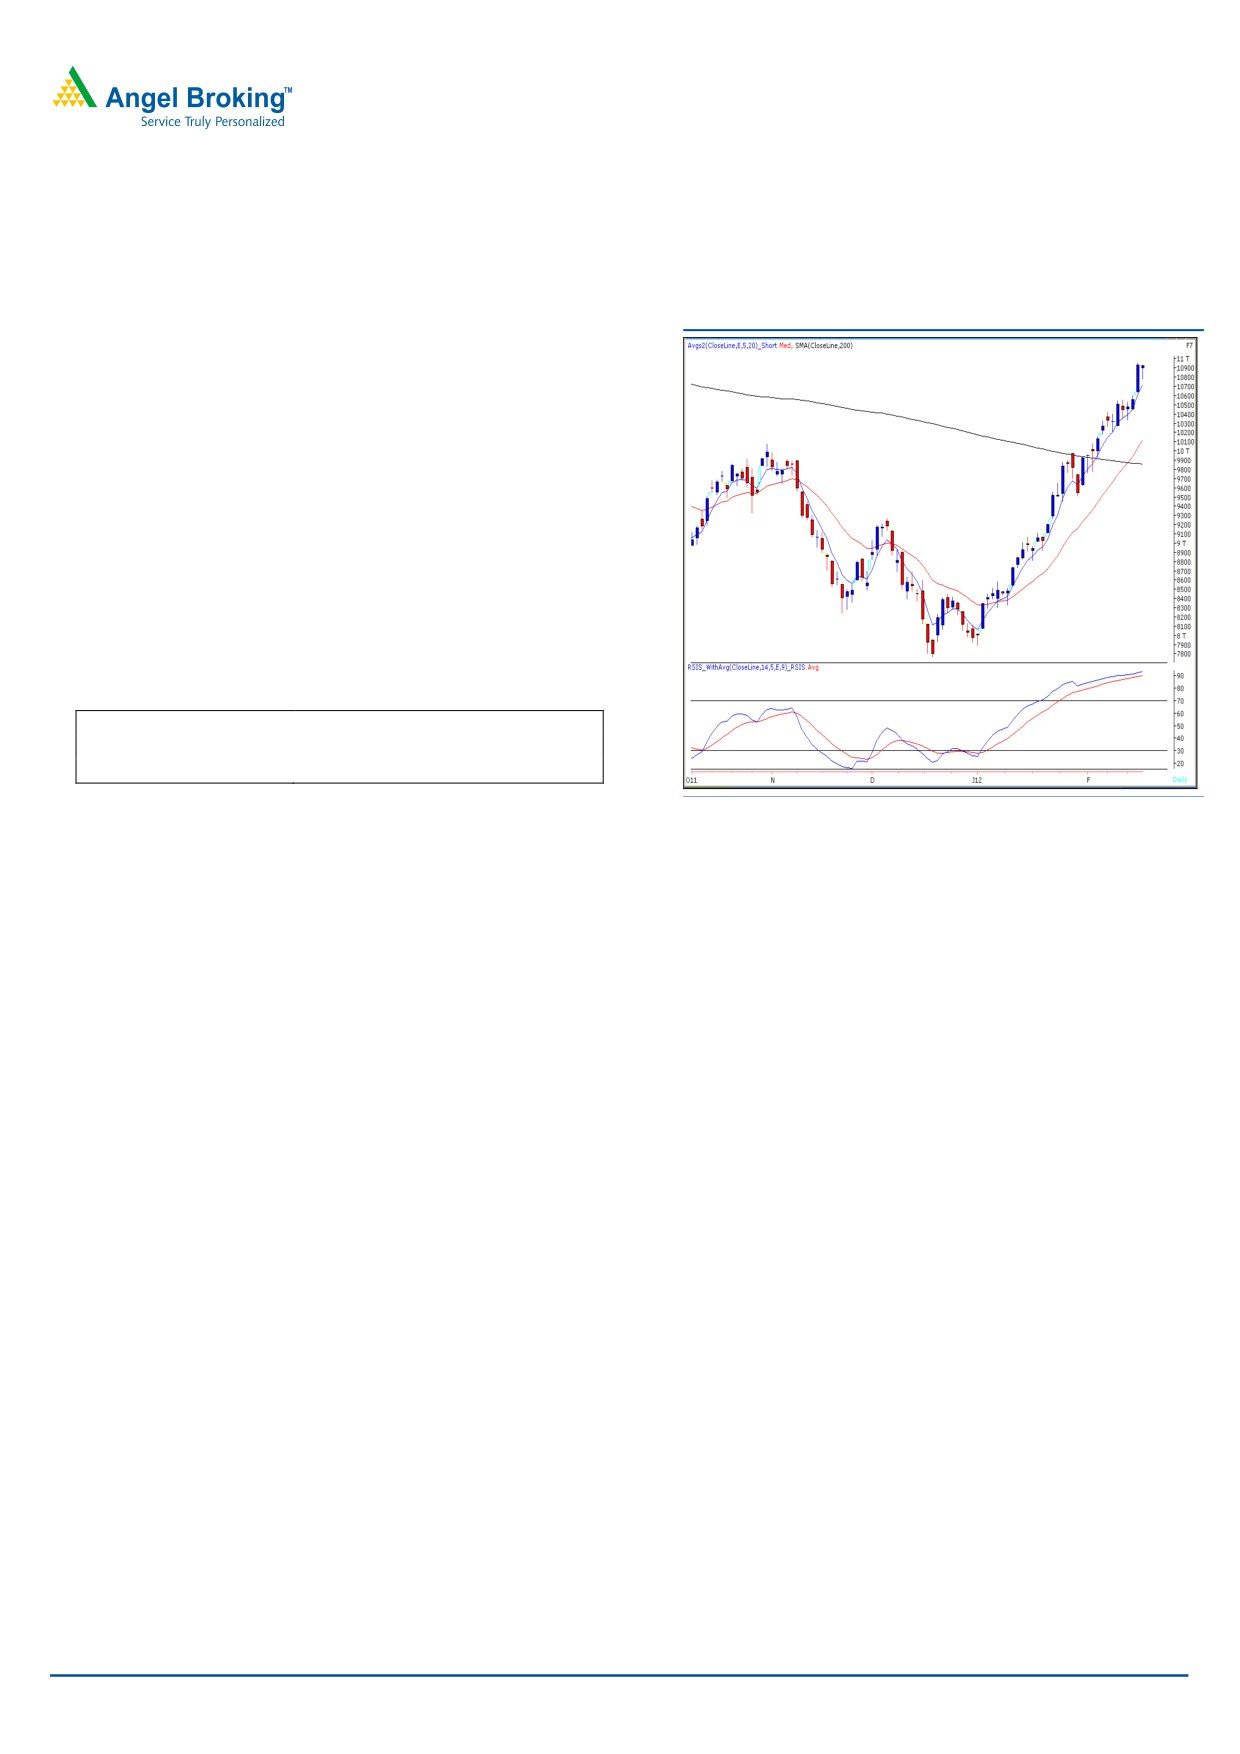
Bank Nifty Outlook - (10922)
In Yesterday’s session, Bank Nifty opened on a flat note
Exhibit 2: Bank Nifty Daily Chart
and traded in a narrow range throughout the session.
Similar to the benchmark indices, the Bank nifty too
shows an “Inside Day” candle stick pattern. On the
upside any move above the 10960 mark would push the
index higher to 11065 - 11232 levels. On the downside
10780 - 10630 levels are likely to act as support in
coming trading session. Considering the overbought
position in momentum oscillators, traders are advised to
exercise caution and place strict stop losses.
Actionable points:
View
Positive Above 10960
Expected Targets
11060 - 11232
Support Levels
10780 - 10630
Source: Falcon
For Private Circulation Only |
2
Technical Research | February 17, 2012
Positive Bias:
Expected
Stock Name
CMP
5 Day EMA
20 Day EMA
Remarks
Target
Escorts
91
87.4
82.8
97
View will change below 86
Indian Hotels
78
74.6
69.6
85
View will change below 71.8
For Private Circulation Only |
3
Technical Research | February 17, 2012
Daily Pivot Levels for Nifty 50 Stocks
SCRIPS
S2
S1
PIVOT
R1
R2
SENSEX
17,987
18,071
18,127
18,210
18,266
NIFTY
5,465
5,493
5,512
5,541
5,560
BANKNIFTY
10,720
10,821
10,881
10,982
11,042
ACC
1,315
1,330
1,349
1,365
1,384
AMBUJACEM
169
170
171
172
174
AXISBANK
1,178
1,201
1,218
1,241
1,258
BAJAJ-AUTO
1,675
1,743
1,788
1,856
1,901
BHARTIARTL
340
345
351
356
362
BHEL
272
278
285
292
299
BPCL
580
602
613
635
646
CAIRN
366
379
389
401
411
CIPLA
311
318
323
331
336
DLF
306
313
326
334
347
DRREDDY
240
245
250
255
260
GAIL
1,593
1,607
1,630
1,644
1,666
HCLTECH
373
379
390
396
407
HDFC
466
471
474
479
482
HDFCBANK
701
709
715
723
729
HEROMOTOCO
515
521
529
535
544
HINDALCO
1,931
2,060
2,132
2,261
2,333
HINDUNILVR
148
151
156
159
164
ICICIBANK
379
382
385
388
391
IDFC
950
959
971
980
991
INFY
139
143
145
148
151
ITC
2,839
2,874
2,896
2,931
2,953
JINDALSTEL
201
203
204
205
206
JPASSOCIAT
596
619
635
658
674
KOTAKBANK
81
83
84
87
88
LT
558
566
573
581
587
M&M
1,415
1,432
1,450
1,467
1,486
MARUTI
700
712
725
736
749
NTPC
1,242
1,301
1,338
1,397
1,434
ONGC
181
183
184
186
187
PNB
274
278
281
284
287
POWERGRID
1,026
1,041
1,052
1,068
1,079
RANBAXY
108
109
111
112
114
RCOM
438
444
449
455
459
RELCAPITAL
98
101
104
106
109
RELIANCE
790
801
816
827
842
RELINFRA
605
618
634
647
662
RPOWER
118
121
124
126
129
SAIL
109
110
111
113
114
SBIN
2,171
2,261
2,319
2,409
2,467
SESAGOA
238
245
251
258
264
SIEMENS
770
785
794
809
818
STER
124
127
130
132
136
SUNPHARMA
529
535
541
548
554
SUZLON
28
29
29
30
31
TATAMOTORS
268
272
278
282
288
TATAPOWER
107
111
114
117
120
TATASTEEL
464
471
482
490
501
TCS
1,204
1,215
1,228
1,239
1,252
WIPRO
430
435
438
442
445
Technical Research Team
For Private Circulation Only |
4
Technical Report
RESEARCH TEAM
Shardul Kulkarni
Head - Technicals
Sameet Chavan
Technical Analyst
Sacchitanand Uttekar
Technical Analyst
Mehul Kothari
Technical Analyst
Ankur Lakhotia
Technical Analyst
Research Team: 022-3952 6600
DISCLAIMER: This document is not for public distribution and has been furnished to you solely for your information and must not
be reproduced or redistributed to any other person. Persons into whose possession this document may come are required to observe
these restrictions.
Opinion expressed is our current opinion as of the date appearing on this material only. While we endeavor to update on a
reasonable basis the information discussed in this material, there may be regulatory, compliance, or other reasons that prevent us
from doing so. Prospective investors and others are cautioned that any forward-looking statements are not predictions and may be
subject to change without notice. Our proprietary trading and investment businesses may make investment decisions that are
inconsistent with the recommendations expressed herein.
The information in this document has been printed on the basis of publicly available information, internal data and other reliable
sources believed to be true and are for general guidance only. While every effort is made to ensure the accuracy and completeness of
information contained, the company takes no guarantee and assumes no liability for any errors or omissions of the information. No
one can use the information as the basis for any claim, demand or cause of action.
Recipients of this material should rely on their own investigations and take their own professional advice. Each recipient of this
document should make such investigations as it deems necessary to arrive at an independent evaluation of an investment in the
securities of companies referred to in this document (including the merits and risks involved), and should consult their own advisors to
determine the merits and risks of such an investment. Price and value of the investments referred to in this material may go up or
down. Past performance is not a guide for future performance. Certain transactions - futures, options and other derivatives as well as
non-investment grade securities - involve substantial risks and are not suitable for all investors. Reports based on technical analysis
centers on studying charts of a stock's price movement and trading volume, as opposed to focusing on a company's fundamentals
and as such, may not match with a report on a company's fundamentals.
We do not undertake to advise you as to any change of our views expressed in this document. While we would endeavor to update
the information herein on a reasonable basis, Angel Broking, its subsidiaries and associated companies, their directors and
employees are under no obligation to update or keep the information current. Also there may be regulatory, compliance, or other
reasons that may prevent Angel Broking and affiliates from doing so. Prospective investors and others are cautioned that any
forward-looking statements are not predictions and may be subject to change without notice.
Angel Broking Limited and affiliates, including the analyst who has issued this report, may, on the date of this report, and from time
to time, have long or short positions in, and buy or sell the securities of the companies mentioned herein or engage in any other
transaction involving such securities and earn brokerage or compensation or act as advisor or have other potential conflict of interest
with respect to company/ies mentioned herein or inconsistent with any recommendation and related information and opinions.
Angel Broking Limited and affiliates may seek to provide or have engaged in providing corporate finance, investment banking or
other advisory services in a merger or specific transaction to the companies referred to in this report, as on the date of this report or
in the past.
Sebi Registration No : INB 010996539
For Private Circulation Only |