Technical Research | January 17, 2012
Daily Technical Report
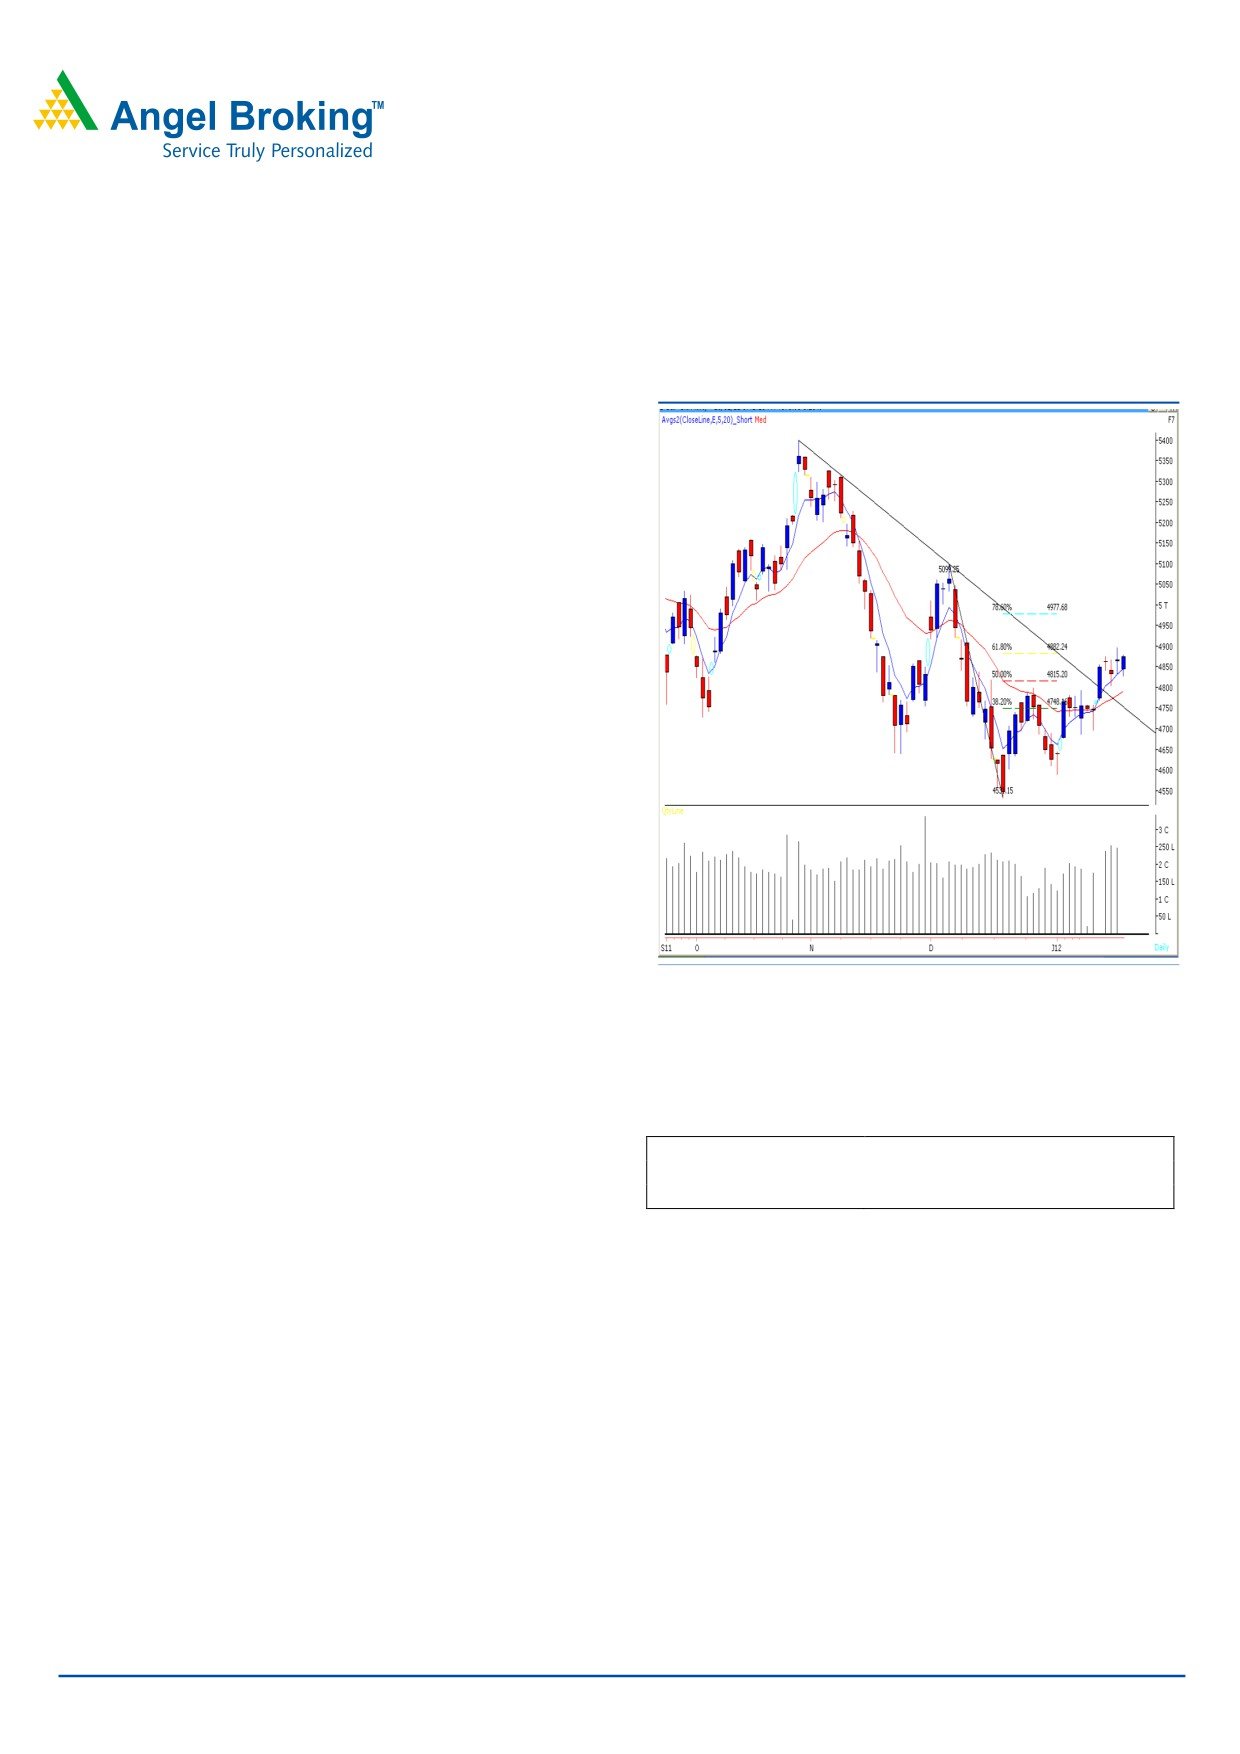
Sensex (16189) / NIFTY (4874)
Exhibit 1: Nifty Daily Chart
Yesterday, markets opened on a pessimistic note in-line
with global cues and traded in a narrow range throughout
the session to close marginally in the positive territory. On
the sectoral front, Capital Goods, IT and Teck sectors were
among the major gainers, whereas Oil & Gas and
Healthcare counters ended on a losing side. The advance to
decline ratio was marginally in favor of advancing counters.
Formation:
• The 20-day EMA (Exponential Moving Average) has
now shifted to the 15940 / 4780 level.
• The positive crossover in weekly momentum oscillators,
viz. the RSI and the Stochastic, is still intact.
• On the Daily chart, we witnessed a “Downward Sloping
Trend Line” breakout from the resistance level of 16070 /
4820.
Source: Falcon
• The 61.8% Fibonacci retracement level of the fall from
17004 to 15135 / 5100 to 4531 is at 16290 / 4881.
Actionable points:
Trading strategy:
View
Positive Above 4920
The week opened with a downside gap and then markets
Expected Targets
4976
drifted towards the immediate support level of 16070 /
Support levels
4834 - 4803
4820 during the initial first half of the session. However,
indices found decent support near day’s low and bounced
sharply to close almost at the highest point of the day.
Going forward, we continue to advise traders to trade with
On the downside, indices have a decent support near
positive bias as long as markets maintain “Higher Top
15962 - 15940 / 4803 - 4780 levels. A move below
Higher Bottom” formation. The consolidation that has been
15940
/
4780 level may result in loss of positive
taking place in the last 4 sessions indicates the possibility of
momentum and then indices are likely to slide towards the
an upward breakout in the coming sessions. Positive
16000 / 4686 level.
momentum is likely to increase further if indices manage to
sustain above the 16421 / 4920 level. In this case, markets
may head towards the next resistance levels of 16600 -
17004 / 4976 - 5100.
For Private Circulation Only |
1
Technical Research | January 17, 2012
Bank Nifty Outlook - (8940)
Exhibit 2: Bank Nifty Daily Chart
Yesterday, Bank Nifty opened below low of the “Doji” candle
pattern formed on Friday’s session. However the index took
support near our mentioned support level of 8810 and
bounced back to close near day’s high. We reiterate our
view, that the high of the “Doji” (9073) is an important
resistance for Bank Nifty. Only a sustainable move above
9073 level would lead the index to test 9110 - 9273 levels.
On the downside, 8810 - 8750 levels are likely to act as
support levels for the day.
Actionable points:
View
Positive Above 9073
Expected Target
9110 - 9275
Support Levels
8810 - 8750
Source: Falcon
Stock Recommendations:
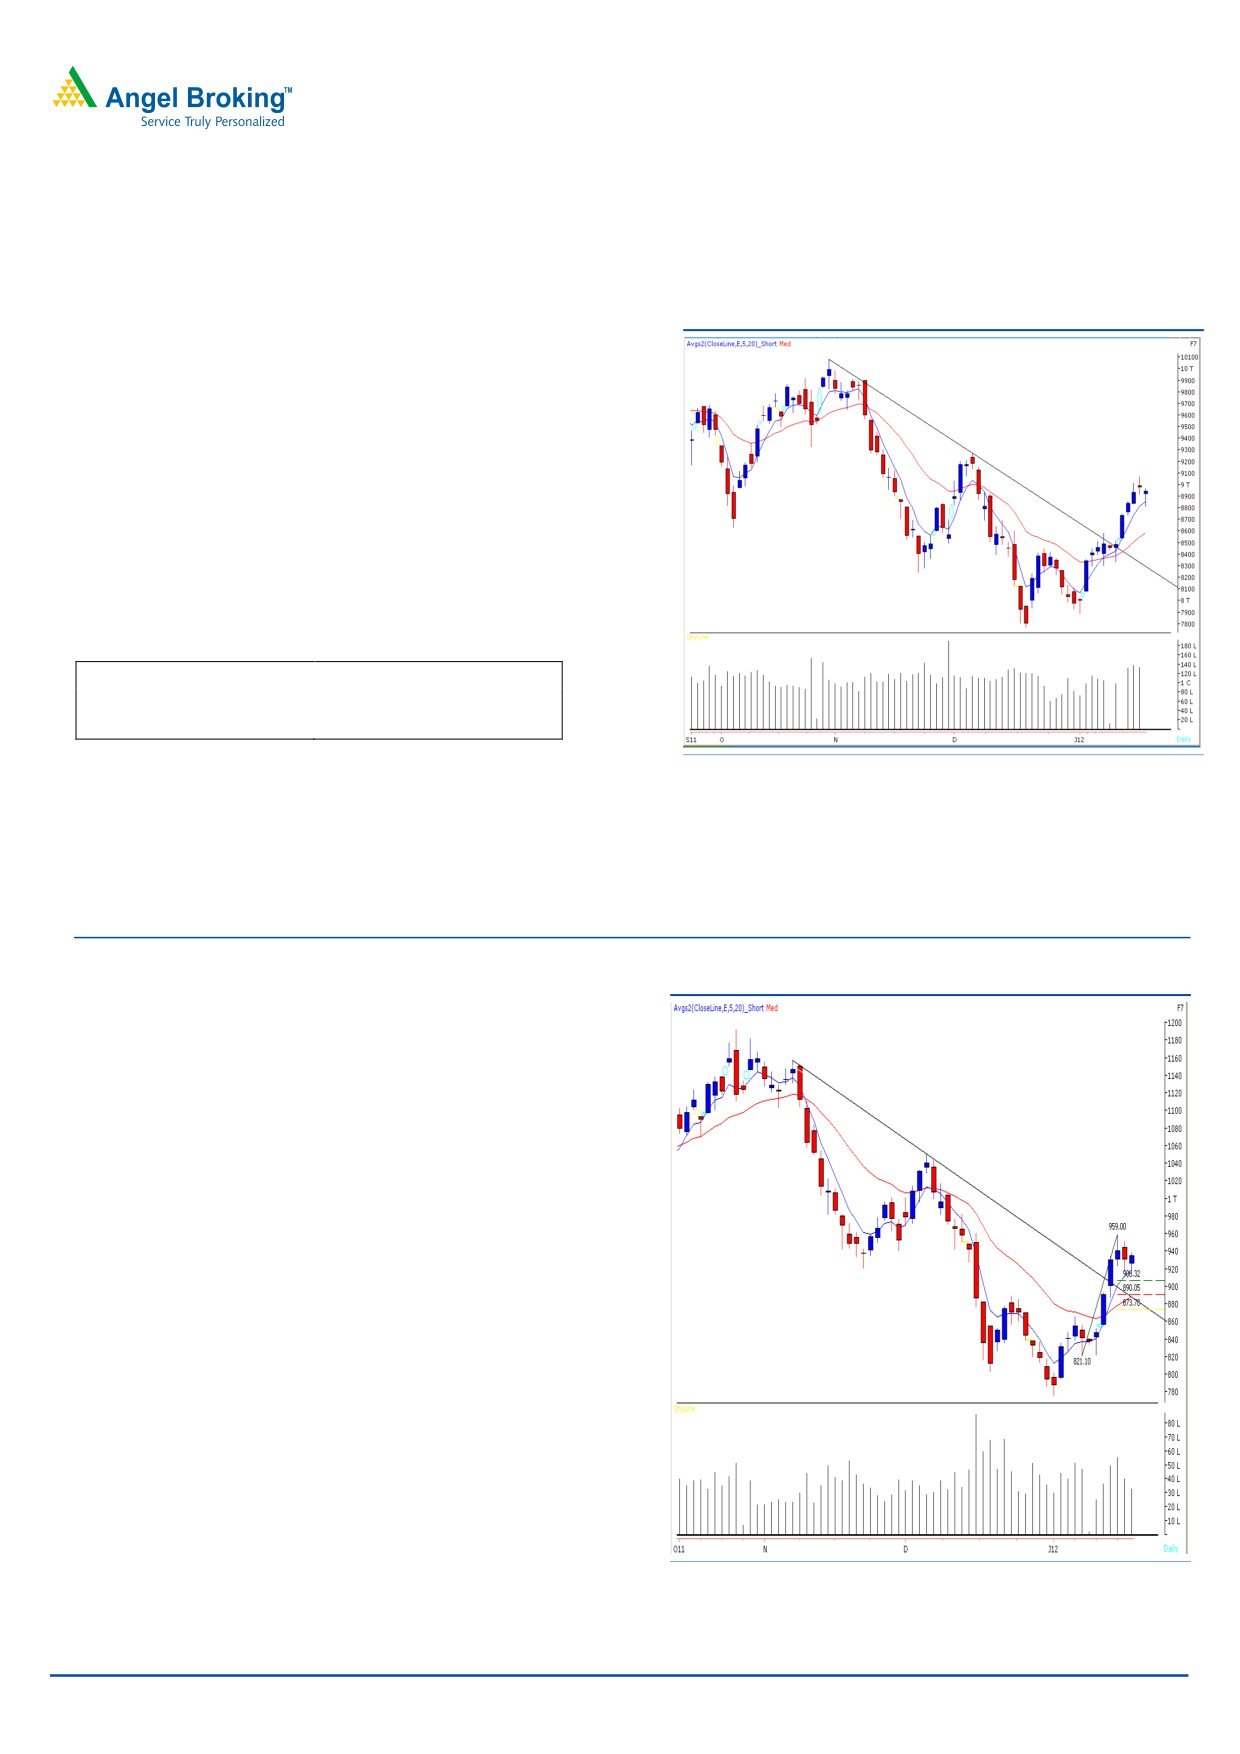
Exhibit 3: Axis Bank Ltd (JAN FUT)
Stock - Axis Bank Ltd (JAN FUT)
Action - Buy
Last close
` 935.10
Buying Range
` 935 - ` 930
Stop Loss
` 913.30
Target
` 995
Justification - On the Daily chart, we are observing that
after breaking out from the trend line resistance of ` 905
level, the stock has given a pull back towards “5 Day EMA”.
Moreover, the Daily chart depicts a candlestick pattern
which resembles a bullish “Hammer” near 38.2% Fibonacci
retracement level of the rise from ` 821 to ` 960 coupled
with the positive crossover in “RSI Smoothened” oscillator on
the Weekly chart. Hence, looking at above technical
evidences, we advise buying the stock in a range of ` 935 -
` 930 for a target of ` 995 in coming 6 - 7 trading
Source: Falcon
sessions.
For Private Circulation Only |
2
Technical Research | January 17, 2012
Positive Bias:
Expected
Stock Name
CMP
5 Day EMA
20 Day EMA
Remarks
Target
Maruti
1008
988.8
968.8
1060
View will change below 987
BHEL
277
267.3
257.6
295
View will change below 268.3
Negative Bias:
Expected
Stock Name
CMP
5 Day EMA
20 Day EMA
Remarks
Target
Oriental Bank
219.3
221.4
222.4
211
View will change above 230
ACC
1112.8
1116.5
1126.2
1082
View will change above 1132.5
For Private Circulation Only |
3
Technical Research | January 17, 2012
Daily Pivot Levels for Nifty 50 Stocks
SCRIPS
S2
S1
PIVOT
R1
R2
SENSEX
15,970
16,080
16,147
16,257
16,324
NIFTY
4,807
4,840
4,861
4,894
4,914
BANKNIFTY
8,753
8,847
8,907
9,001
9,061
ACC
1,093
1,103
1,115
1,125
1,137
AMBUJACEM
147
149
151
154
156
AXISBANK
909
922
930
944
952
BAJAJ-AUTO
1,388
1,406
1,425
1,443
1,462
BHARTIARTL
331
336
339
344
347
BHEL
258
267
273
283
289
BPCL
492
499
505
511
518
CAIRN
328
333
337
342
346
CIPLA
328
330
334
336
339
DLF
189
191
193
196
198
DRREDDY
1,618
1,631
1,640
1,653
1,662
GAIL
364
368
371
375
378
HCLTECH
390
398
403
411
416
HDFC
666
670
675
679
684
HDFCBANK
453
457
462
466
472
HEROMOTOCO
1,755
1,777
1,792
1,814
1,829
HINDALCO
129
131
132
134
135
HINDUNILVR
381
384
387
390
393
ICICIBANK
769
780
788
800
808
IDFC
105
108
110
113
115
INFY
2,556
2,598
2,621
2,663
2,686
ITC
205
207
208
210
212
JINDALSTEL
486
492
500
506
513
JPASSOCIAT
57
59
60
61
62
KOTAKBANK
446
454
464
472
482
LT
1,123
1,162
1,185
1,225
1,248
M&M
678
683
687
692
696
MARUTI
949
979
999
1,029
1,049
NTPC
159
160
163
165
167
ONGC
252
254
258
260
263
PNB
853
869
882
898
910
POWERGRID
98
99
101
101
103
RANBAXY
447
458
465
476
483
RCOM
83
85
86
88
89
RELCAPITAL
286
293
298
305
311
RELIANCE
699
706
718
725
737
RELINFRA
393
401
408
416
423
RPOWER
84
85
87
89
91
SAIL
89
90
91
93
94
SBIN
1,713
1,765
1,800
1,851
1,886
SESAGOA
176
183
187
195
199
SIEMENS
710
716
721
727
732
STER
100
103
105
108
110
SUNPHARMA
493
499
507
513
521
SUZLON
21
22
23
23
24
TATAMOTORS
200
207
211
218
221
TATAPOWER
94
96
97
99
101
TATASTEEL
399
410
420
431
441
TCS
1,066
1,088
1,101
1,123
1,136
WIPRO
393
400
405
412
416
Technical Research Team
For Private Circulation Only |
4
Technical Report
RESEARCH TEAM
Shardul Kulkarni
Head - Technicals
Sameet Chavan
Technical Analyst
Sacchitanand Uttekar
Technical Analyst
Mehul Kothari
Technical Analyst
Ankur Lakhotia
Technical Analyst
Research Team: 022-3952 6600
DISCLAIMER: This document is not for public distribution and has been furnished to you solely for your information and must not
be reproduced or redistributed to any other person. Persons into whose possession this document may come are required to observe
these restrictions.
Opinion expressed is our current opinion as of the date appearing on this material only. While we endeavor to update on a
reasonable basis the information discussed in this material, there may be regulatory, compliance, or other reasons that prevent us
from doing so. Prospective investors and others are cautioned that any forward-looking statements are not predictions and may be
subject to change without notice. Our proprietary trading and investment businesses may make investment decisions that are
inconsistent with the recommendations expressed herein.
The information in this document has been printed on the basis of publicly available information, internal data and other reliable
sources believed to be true and are for general guidance only. While every effort is made to ensure the accuracy and completeness of
information contained, the company takes no guarantee and assumes no liability for any errors or omissions of the information. No
one can use the information as the basis for any claim, demand or cause of action.
Recipients of this material should rely on their own investigations and take their own professional advice. Each recipient of this
document should make such investigations as it deems necessary to arrive at an independent evaluation of an investment in the
securities of companies referred to in this document (including the merits and risks involved), and should consult their own advisors to
determine the merits and risks of such an investment. Price and value of the investments referred to in this material may go up or
down. Past performance is not a guide for future performance. Certain transactions - futures, options and other derivatives as well as
non-investment grade securities - involve substantial risks and are not suitable for all investors. Reports based on technical analysis
centers on studying charts of a stock's price movement and trading volume, as opposed to focusing on a company's fundamentals
and as such, may not match with a report on a company's fundamentals.
We do not undertake to advise you as to any change of our views expressed in this document. While we would endeavor to update
the information herein on a reasonable basis, Angel Broking, its subsidiaries and associated companies, their directors and
employees are under no obligation to update or keep the information current. Also there may be regulatory, compliance, or other
reasons that may prevent Angel Broking and affiliates from doing so. Prospective investors and others are cautioned that any
forward-looking statements are not predictions and may be subject to change without notice.
Angel Broking Limited and affiliates, including the analyst who has issued this report, may, on the date of this report, and from time
to time, have long or short positions in, and buy or sell the securities of the companies mentioned herein or engage in any other
transaction involving such securities and earn brokerage or compensation or act as advisor or have other potential conflict of interest
with respect to company/ies mentioned herein or inconsistent with any recommendation and related information and opinions.
Angel Broking Limited and affiliates may seek to provide or have engaged in providing corporate finance, investment banking or
other advisory services in a merger or specific transaction to the companies referred to in this report, as on the date of this report or
in the past.
Sebi Registration No : INB 010996539
For Private Circulation Only |