Technical Research | October 17, 2011
Daily Technical Report
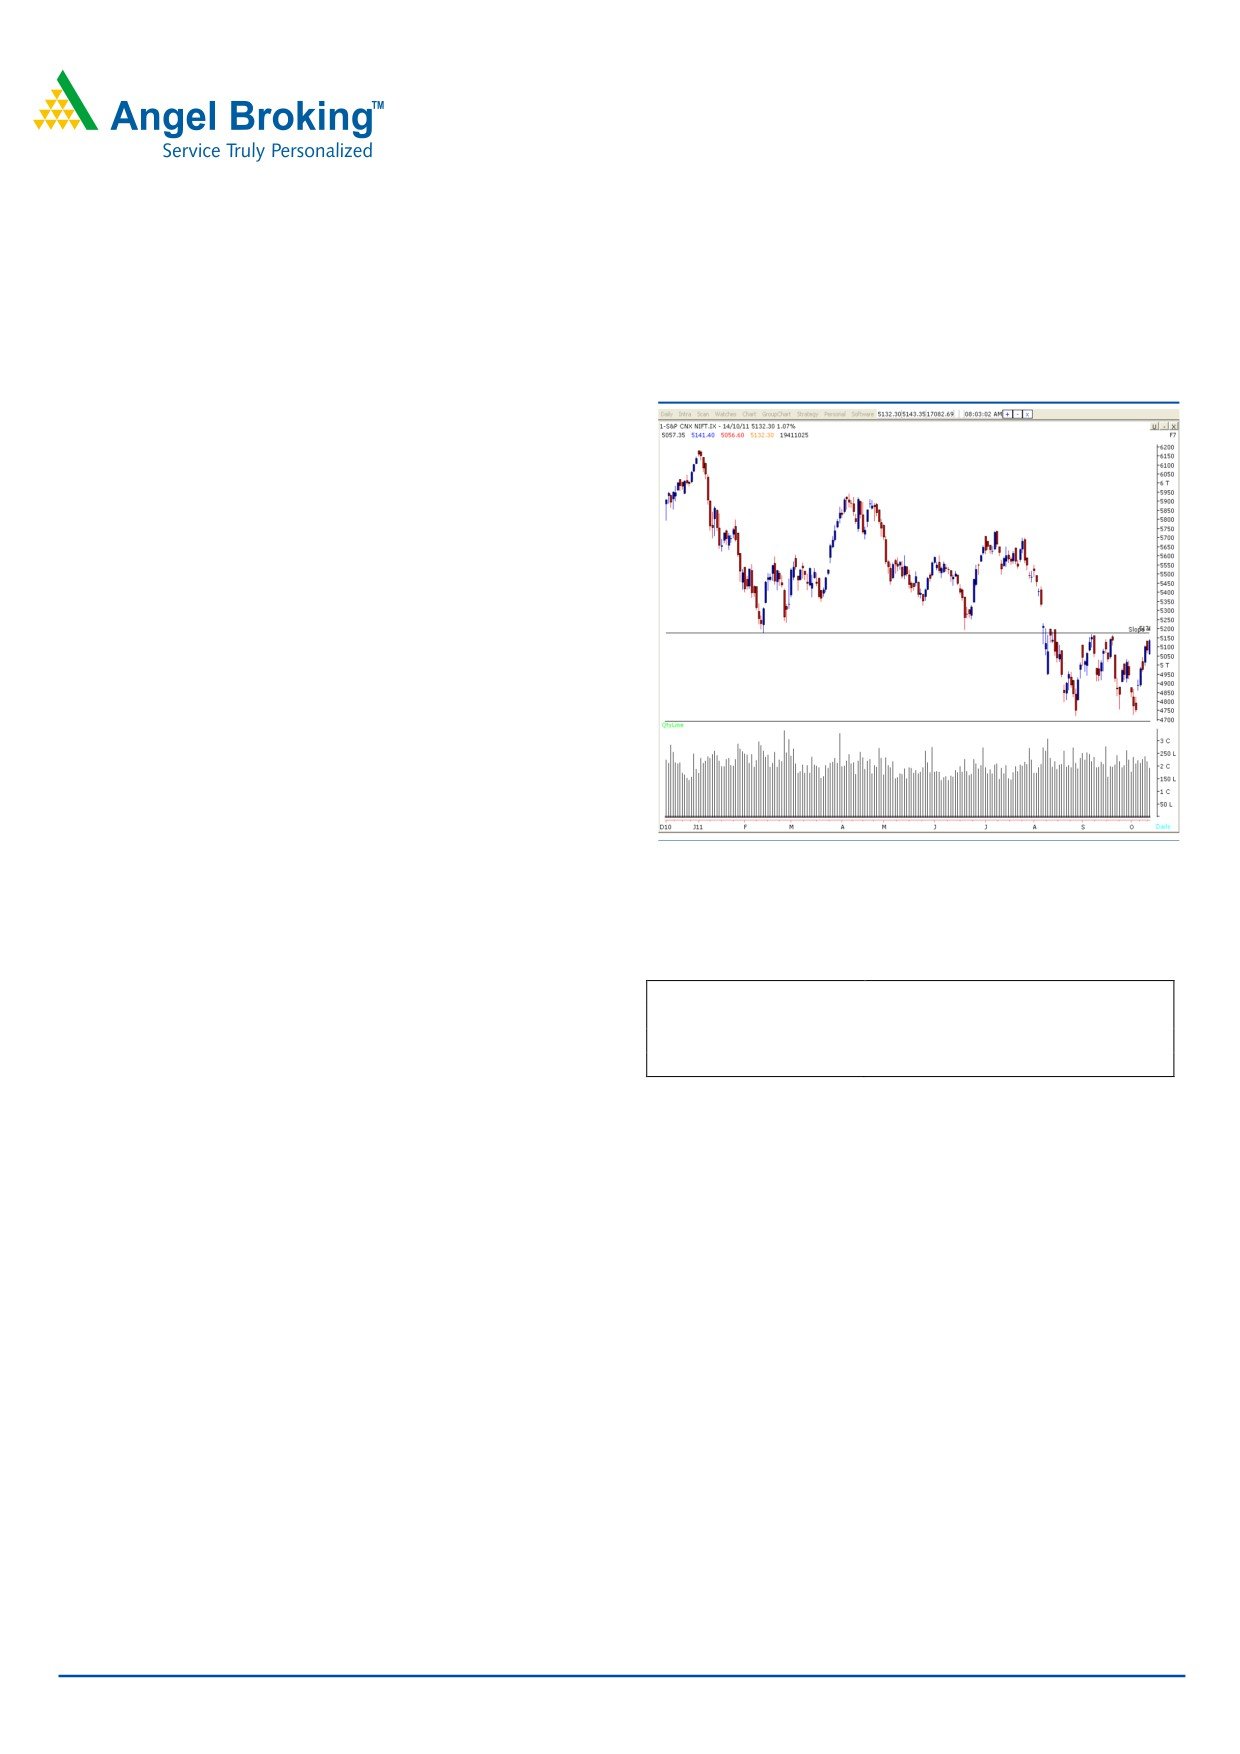
Sensex (17083) / NIFTY (5132)
On Friday’s session, our benchmark indices opened flat
Exhibit 1: Nifty Daily Chart
and traded with positive bias throughout the day to close
near days high. On the sector front, IT, Teck and Oil & Gas
counters were among the major gainers whereas Realty and
Metal ended on a losing side. The advance decline ratio
was in favor of advancing counters (A=1431 D=1331).
Formation
• We are observing a positive crossover in Weekly “RSI -
Smoothened” momentum oscillator.
• On the Weekly chart, there is a “Horizontal Trend Line”
resistance at 17256 / 5198 level.
• The “20 EMA” on the Weekly chart is placed at 17260 /
5177 level.
Source: Falcon
Actionable points:
Trading strategy:
On Friday’s session, markets surged significantly higher
View
Neutral
mainly due to strong positive momentum in IT and Oil &
Resistance Levels
5141 - 5198
Gas counters. Looking at the Weekly chart, it is observed
Support Levels
5057-5034
that indices are nearing the “Horizontal Trend Line”
resistance at 17256 / 5198 levels. This level coincides with
“20 EMA” on the Weekly chart and adds weight in favor of
the bears. Consequently, 17260 / 5198 levels may act as a
major hurdle for the bulls. However, on the other hand, we
are observing a positive crossover in the weekly “RSI -
Smoothened” oscillator, which indicates if indices manage
to cross and sustain above 17260 / 5198 levels, then the
current positive momentum may increase even further. In
such a case, indices may rally towards the gap area of
17358 - 17665 / 5230 - 5323 created on August 5, 2011.
On the downside, 16316 - 16510 / 5034 - 4964 levels
are likely to act as a support in the coming trading session.
Markets are nearing strong resistance levels; therefore, we
advise traders to stay light on positions and trade with strict
stop losses.
For Private Circulation Only |
1
Technical Research | October 17, 2011
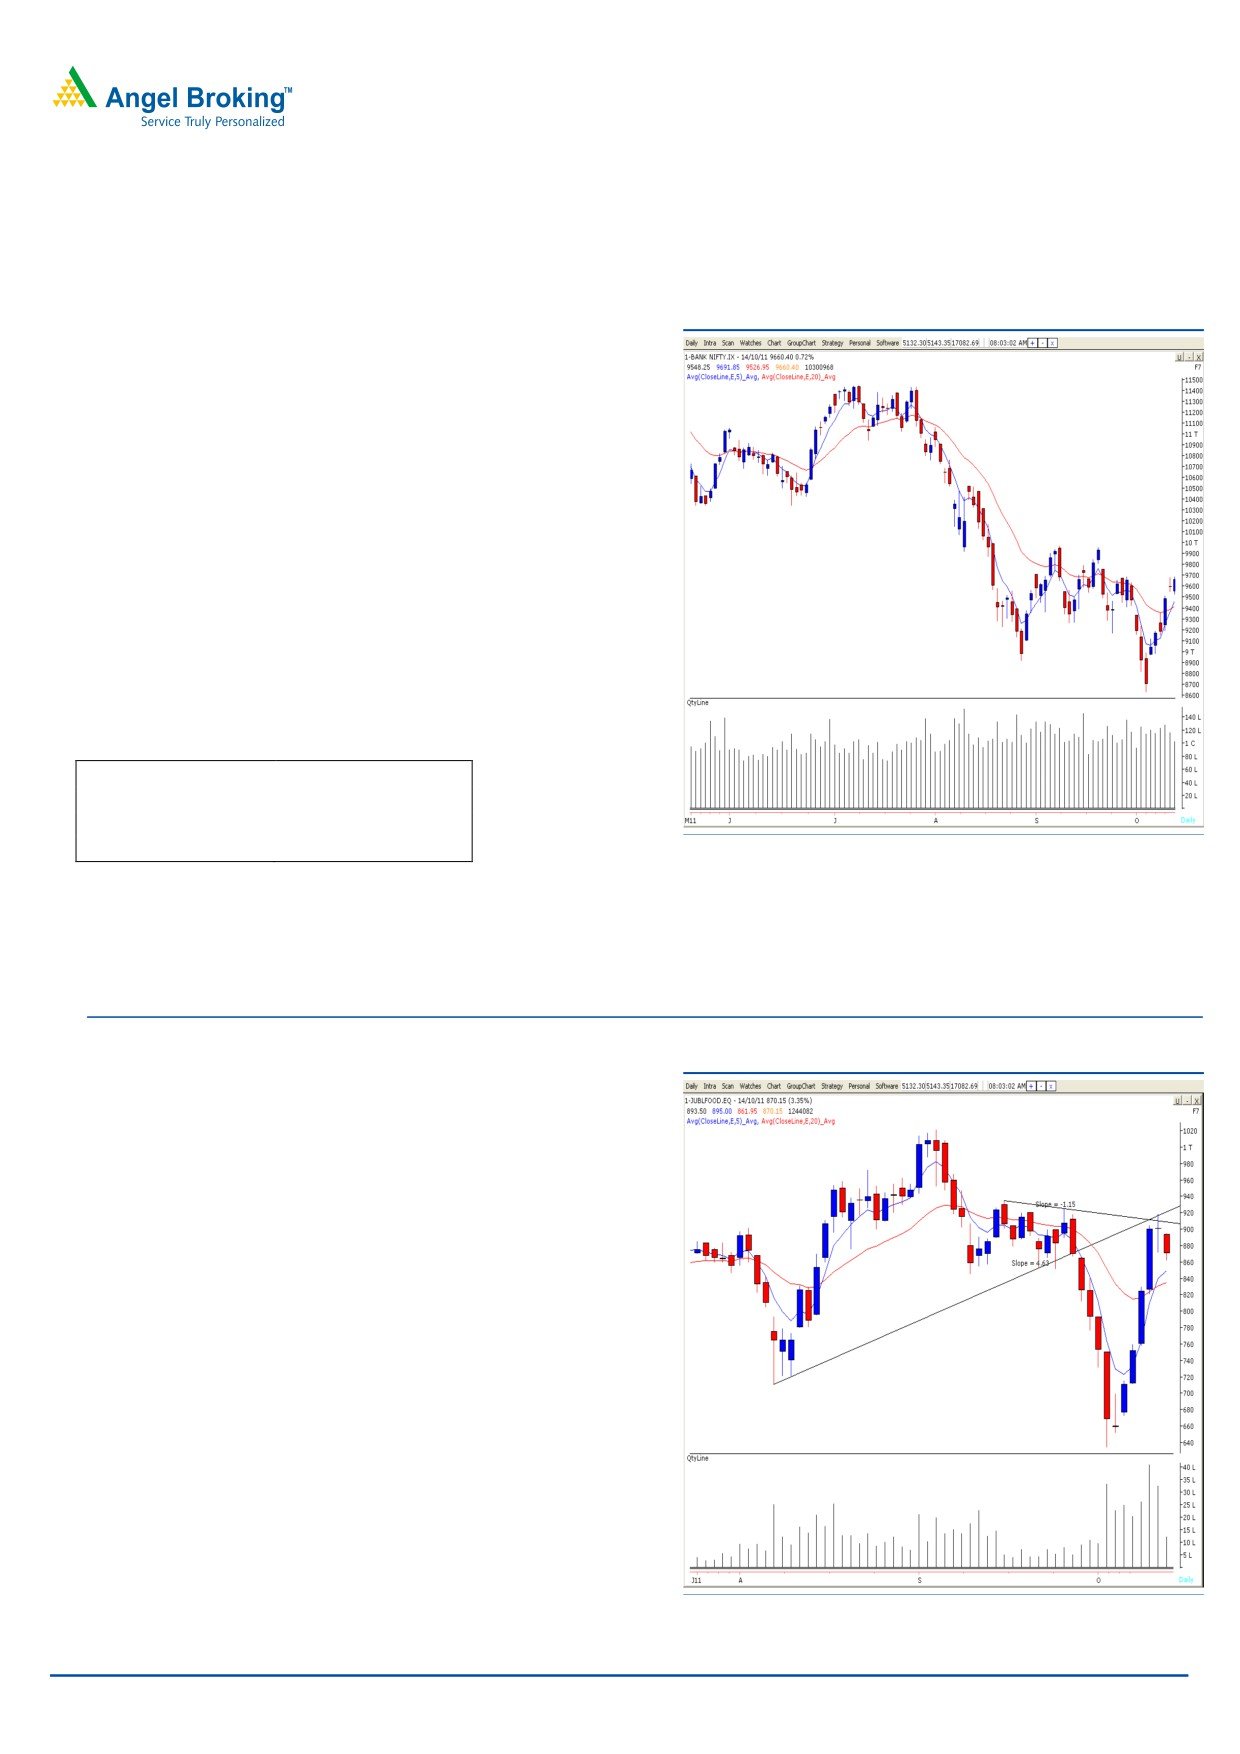
Bank Nifty Outlook - (9660)
Exhibit 2: Bank Nifty Daily Chart
As mentioned in our previous report 9685 proves to be stiff
resistance for bank nifty. Bearish implication of “Bearish Doji
Star” Japanese candle stick pattern on daily chart,
mentioned in our previous report still holds as bank nifty
failed to close above 9685 level. However, on the other
hand, we are observing positive crossover of “5 & 20 EMA”
on daily chart which indicates possibility of an upside if bank
nifty gives a close above 9685 level. Subsequently, index
may rally towards 9970 level which is a prior swing high.
On the downside, 9400-9280 level may act as support level
for the day.
Actionable points:
View
Neutral
Support Level
9400 - 9280
Resistance Level
9700 - 9970
Source: Falcon
Stock Recommendations:
Exhibit 3: Reliance Capital (Oct Fut) Daily chart
Stock - Jubilant Food Works (NSE Cash)
Action - Sell
Last close - ` 870.15
Level
- Below ` 857
Stop Loss - ` 880
Target
- ` 805
Justification - After a sharp rally from ` 635 to ` 920 the
stock is facing multiple resistance near ` 920 level. Also we
are witnessing “Evening star” Japanese candlestick pattern,
which is a price reversal pattern. Further, momentum
oscillators on the daily chart suggest weakness in coming
trading sessions. We advise selling the stock ONLY below `
857 for a target of ` 805 in coming 2-3 weeks.
Source: Falcon
For Private Circulation Only |
2
Technical Research | October 17, 2011
Positive Bias:
Stock Name
5 Day EMA
20 Day EMA
Expected Target
Remarks
Voltas
103.41
109.57
109.57
Support at 102.15
Bajaj Auto
1588.92
1560.80
1695
Support at 1580
Polaris
133.84
131.49
154.55
Support at 131.50
Negative Bias:
Stock Name
5 Day EMA
20 Day EMA
Expected Target
Remarks
Sterlite Ind
118
119.50
110
Resistance at 123.60
Jubilant Food
849.60
834.93
805
Resistance at 919
Lupin
458.88
465.68
430
Resistance at 464. Sell ONLY below
449
For Private Circulation Only |
3
Technical Research | October 17, 2011
Daily Pivot Levels for Nifty 50 Stocks
SCRIPS
S2
S1
PIVOT
R1
R2
SENSEX
16,724
16,903
17,008
17,187
17,292
NIFTY
5,025
5,079
5,110
5,164
5,195
BANKNIFTY
9,462
9,561
9,626
9,726
9,791
ACC
1,105
1,112
1,120
1,127
1,134
AMBUJACEM
146
147
149
150
152
AXISBANK
1,062
1,083
1,096
1,117
1,131
BAJAJ-AUTO
1,558
1,596
1,618
1,656
1,678
BHARTIARTL
361
372
379
390
396
BHEL
324
329
334
338
343
BPCL
643
649
655
662
668
CAIRN
273
281
285
292
296
CIPLA
279
283
287
291
295
DLF
225
228
232
235
239
DRREDDY
1,488
1,506
1,516
1,534
1,544
GAIL
407
411
416
420
425
HCLTECH
419
430
437
447
454
HDFC
655
661
665
671
675
HDFCBANK
461
467
472
478
483
HEROMOTOCO
1,949
1,971
1,991
2,013
2,033
HINDALCO
123
126
128
131
133
HINDUNILVR
323
327
331
335
338
ICICIBANK
860
875
888
903
915
IDFC
116
120
123
127
130
INFY
2,659
2,701
2,729
2,772
2,799
ITC
200
202
204
207
209
JINDALSTEL
479
502
515
538
551
JPASSOCIAT
72
73
73
74
75
KOTAKBANK
462
468
474
481
487
LT
1,382
1,395
1,412
1,425
1,442
M&M
787
796
803
812
818
MARUTI
1,004
1,016
1,033
1,045
1,063
NTPC
169
171
174
176
179
ONGC
261
264
266
269
271
PNB
959
966
975
981
990
POWERGRID
98
98
99
100
101
RANBAXY
490
496
502
509
515
RCOM
74
76
78
79
81
RELCAPITAL
333
341
347
356
362
RELIANCE
831
849
859
877
888
RELINFRA
405
414
422
432
440
RPOWER
83
85
86
88
89
SAIL
104
106
108
110
111
SBIN
1,850
1,868
1,887
1,905
1,924
SESAGOA
211
215
221
226
231
SIEMENS
826
836
845
854
864
STER
115
117
119
121
123
SUNPHARMA
464
472
479
487
495
SUZLON
37
38
38
38
39
TATAMOTORS
171
175
178
183
186
TATAPOWER
98
99
100
101
102
TATASTEEL
424
431
441
448
458
TCS
1,069
1,102
1,121
1,154
1,173
WIPRO
340
352
358
370
377
Technical Research Team
For Private Circulation Only |
4
Technical Report
RESEARCH TEAM
Shardul Kulkarni
Head - Technicals
Sameet Chavan
Technical Analyst
Sacchitanand Uttekar
Technical Analyst
Mehul Kothari
Technical Analyst
Ankur Lakhotia
Technical Analyst
Research Team: 022-3952 6600
DISCLAIMER: This document is not for public distribution and has been furnished to you solely for your information and must not
be reproduced or redistributed to any other person. Persons into whose possession this document may come are required to observe
these restrictions.
Opinion expressed is our current opinion as of the date appearing on this material only. While we endeavor to update on a
reasonable basis the information discussed in this material, there may be regulatory, compliance, or other reasons that prevent us
from doing so. Prospective investors and others are cautioned that any forward-looking statements are not predictions and may be
subject to change without notice. Our proprietary trading and investment businesses may make investment decisions that are
inconsistent with the recommendations expressed herein.
The information in this document has been printed on the basis of publicly available information, internal data and other reliable
sources believed to be true and are for general guidance only. While every effort is made to ensure the accuracy and completeness of
information contained, the company takes no guarantee and assumes no liability for any errors or omissions of the information. No
one can use the information as the basis for any claim, demand or cause of action.
Recipients of this material should rely on their own investigations and take their own professional advice. Each recipient of this
document should make such investigations as it deems necessary to arrive at an independent evaluation of an investment in the
securities of companies referred to in this document (including the merits and risks involved), and should consult their own advisors to
determine the merits and risks of such an investment. Price and value of the investments referred to in this material may go up or
down. Past performance is not a guide for future performance. Certain transactions - futures, options and other derivatives as well as
non-investment grade securities - involve substantial risks and are not suitable for all investors. Reports based on technical analysis
centers on studying charts of a stock's price movement and trading volume, as opposed to focusing on a company's fundamentals
and as such, may not match with a report on a company's fundamentals.
We do not undertake to advise you as to any change of our views expressed in this document. While we would endeavor to update
the information herein on a reasonable basis, Angel Broking, its subsidiaries and associated companies, their directors and
employees are under no obligation to update or keep the information current. Also there may be regulatory, compliance, or other
reasons that may prevent Angel Broking and affiliates from doing so. Prospective investors and others are cautioned that any
forward-looking statements are not predictions and may be subject to change without notice.
Angel Broking Limited and affiliates, including the analyst who has issued this report, may, on the date of this report, and from time
to time, have long or short positions in, and buy or sell the securities of the companies mentioned herein or engage in any other
transaction involving such securities and earn brokerage or compensation or act as advisor or have other potential conflict of interest
with respect to company/ies mentioned herein or inconsistent with any recommendation and related information and opinions.
Angel Broking Limited and affiliates may seek to provide or have engaged in providing corporate finance, investment banking or
other advisory services in a merger or specific transaction to the companies referred to in this report, as on the date of this report or
in the past.
Sebi Registration No : INB 010996539
For Private Circulation Only |