Technical Research | December 16, 2011
Daily Technical Report
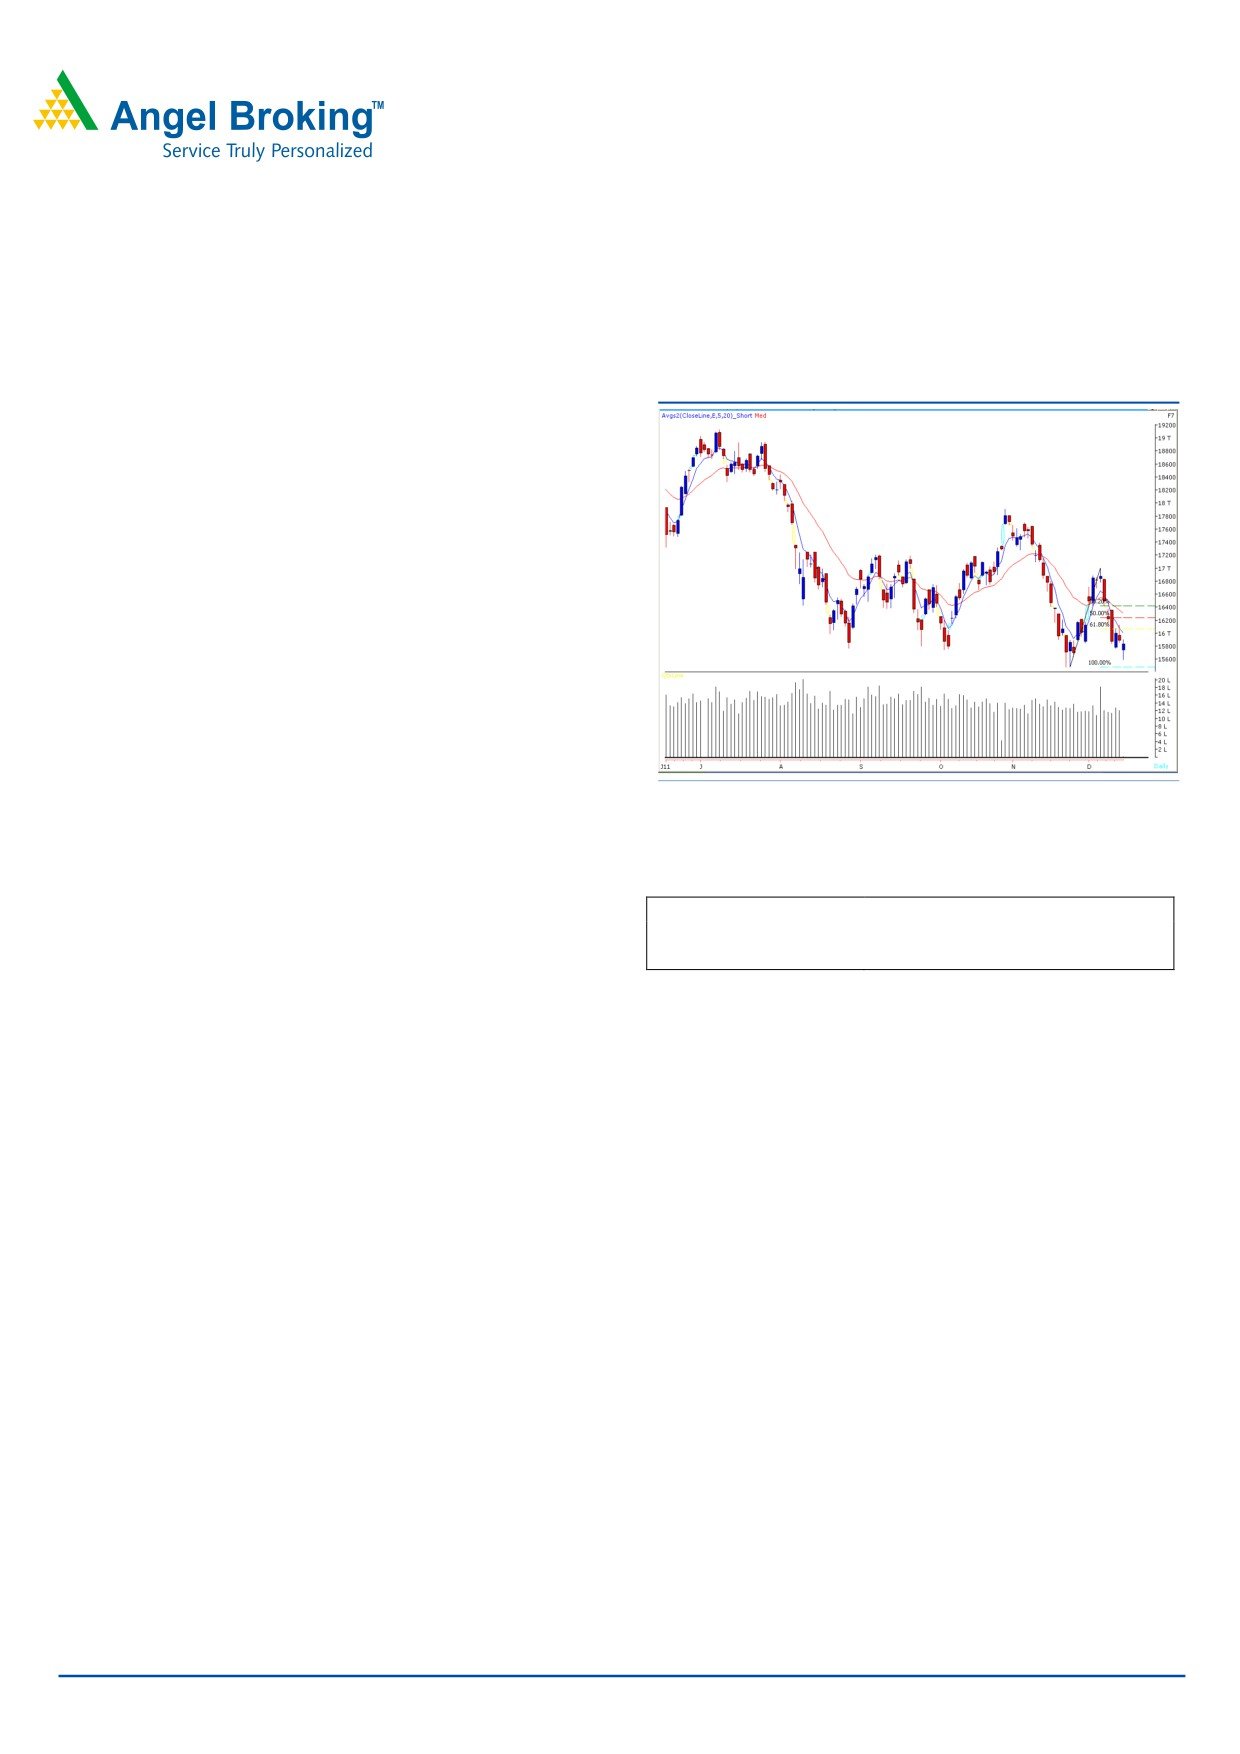
Sensex (15836) / NIFTY (4746)
Exhibit 1: Nifty Daily Chart
Markets opened on a pessimistic note in-line with negative
global sentiment but recovered from the lows to close above
the 4700 / 15800 mark. On the sectoral front, Capital
Goods, Consumer Durables and Auto counters were
among the major losers, whereas FMCG and Power sectors
ended with a marginal gain. The advance to decline ratio
was strongly in favor of declining counters. (A=896
Formation
• No specific formation is seen on the chart.
Source: Falcon
Trading strategy:
Actionable points:
Weakning currency and negative global cues continued to
hurt our markets in yesterday’s session. However, buying
View
Neutral
Resistance levels
4769 - 4841
interest near to crucial support level of 15700 / 4700
Support levels
4674 - 4639
helped indices to close marginally in negative territory.
Going forward, yesterday’s low of 15596 / 4674 would act
as support in coming trading sessions. A breach of this low
may intensify selling pressure and indices may slide to test
15478 / 4639 level. Conversely, yesterday’s high of 15908
/ 4769 may act as immediate resistance level. A move
above this level may take indices to test 16142 / 4841
level.
Traders are advised to trade with caution as the RBI
monetary policy would be declared during the session.
Volatility is expected to increase during the announcement
of the monetary policy.
For Private Circulation Only |
1
Technical Research | December 16, 2011
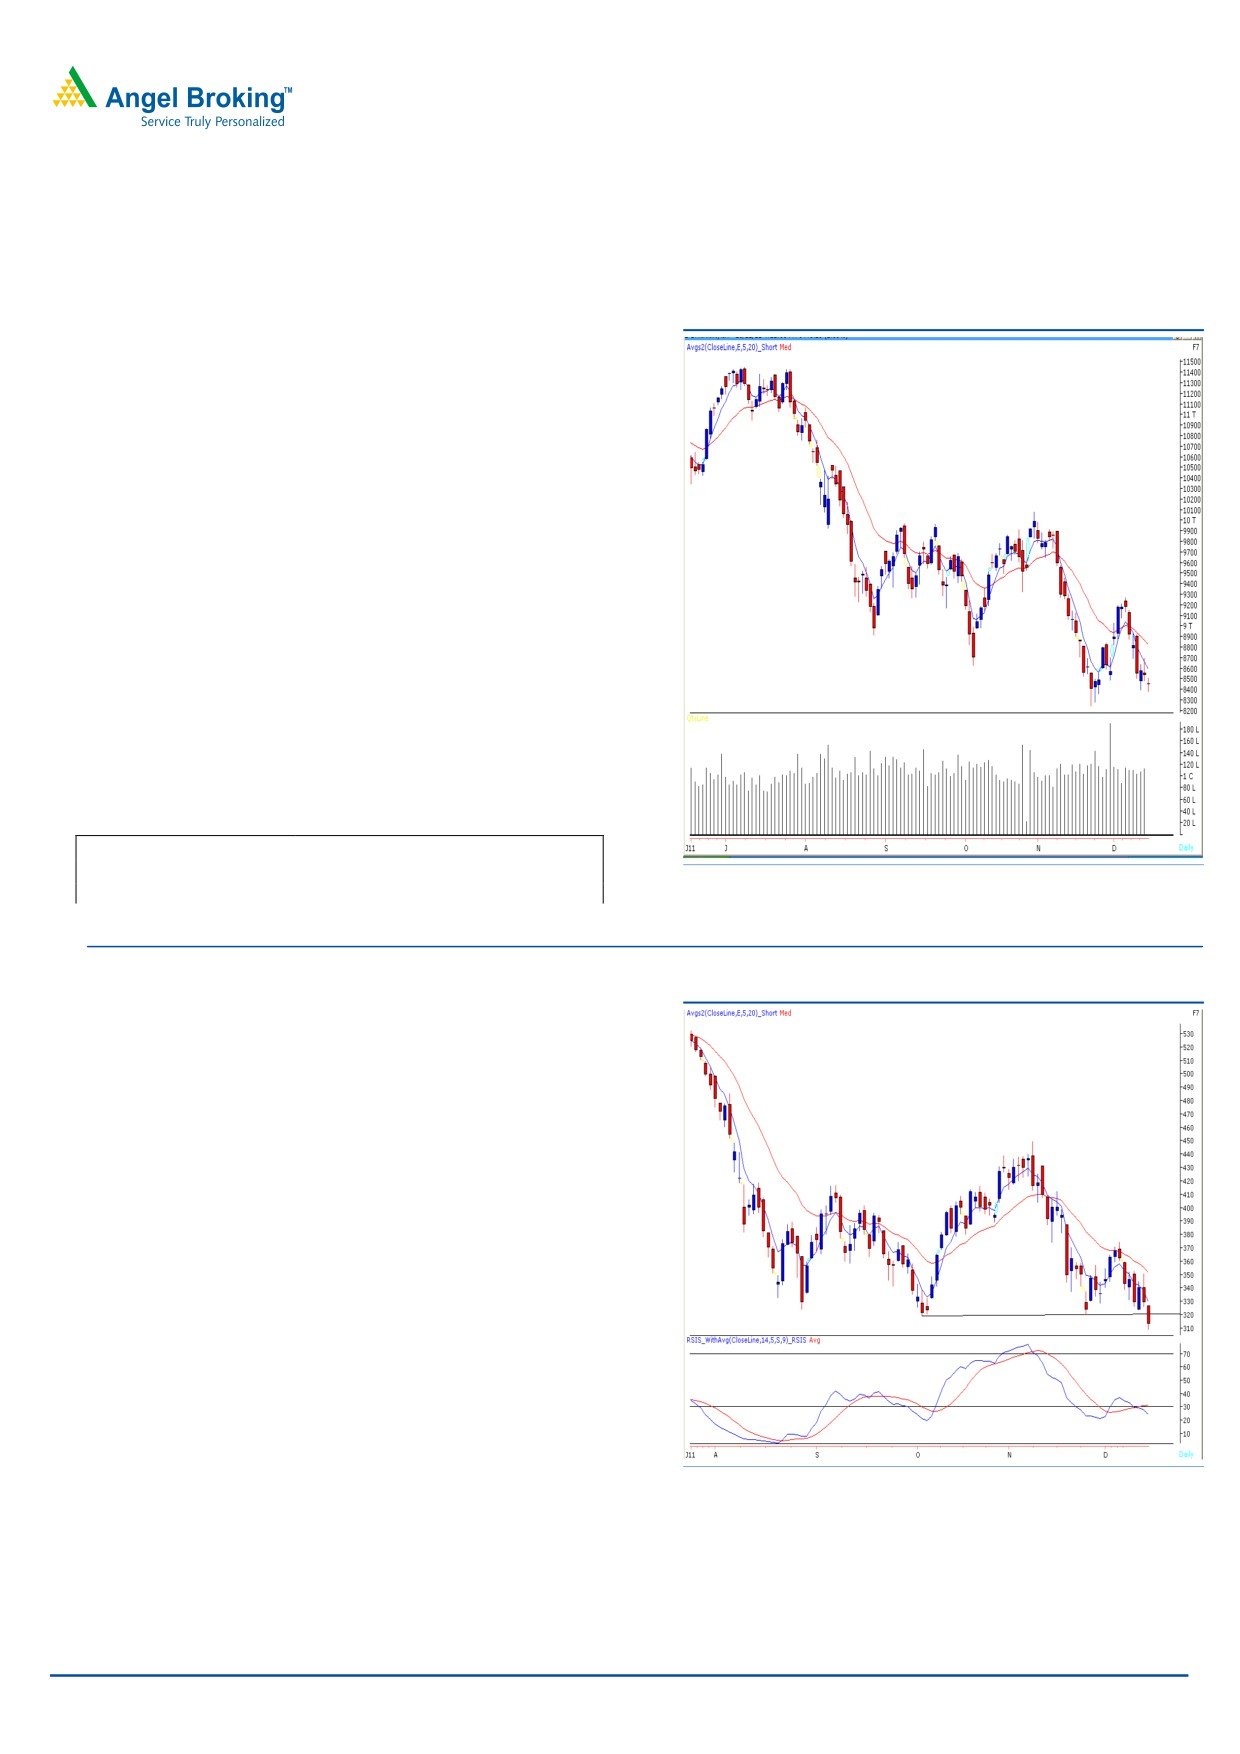
Bank Nifty Outlook - (8445)
Exhibit 2: Bank Nifty Daily Chart
Bank nifty opened with a minor downside gap and traded
in a narrow range throughout the session to close near
initial opening level. Once again, in today’s session the
index has formed a “Doji” candle pattern which is a sign of
indecisiveness prevailing at current level. The RBI monetary
policy is expected to have a significant impact on the Bank
Nifty and we expect clarity of trend for the further sessions.
From the past three sessions, the index is constantly taking
support near 78.6% retracement of the rise from 8240 -
9273. If the index sustains below yesterday’s low of 8376
then it is likely to test 8295 - 8240 levels. On the upside,
8536 - 8630 levels are likely to act as resistance in coming
trading session.
Actionable points:
View
Neutral
Resistance level
8536 - 8630
Source: Falcon
Support levels
8376 - 8295 - 8240
Stock Recommendations:
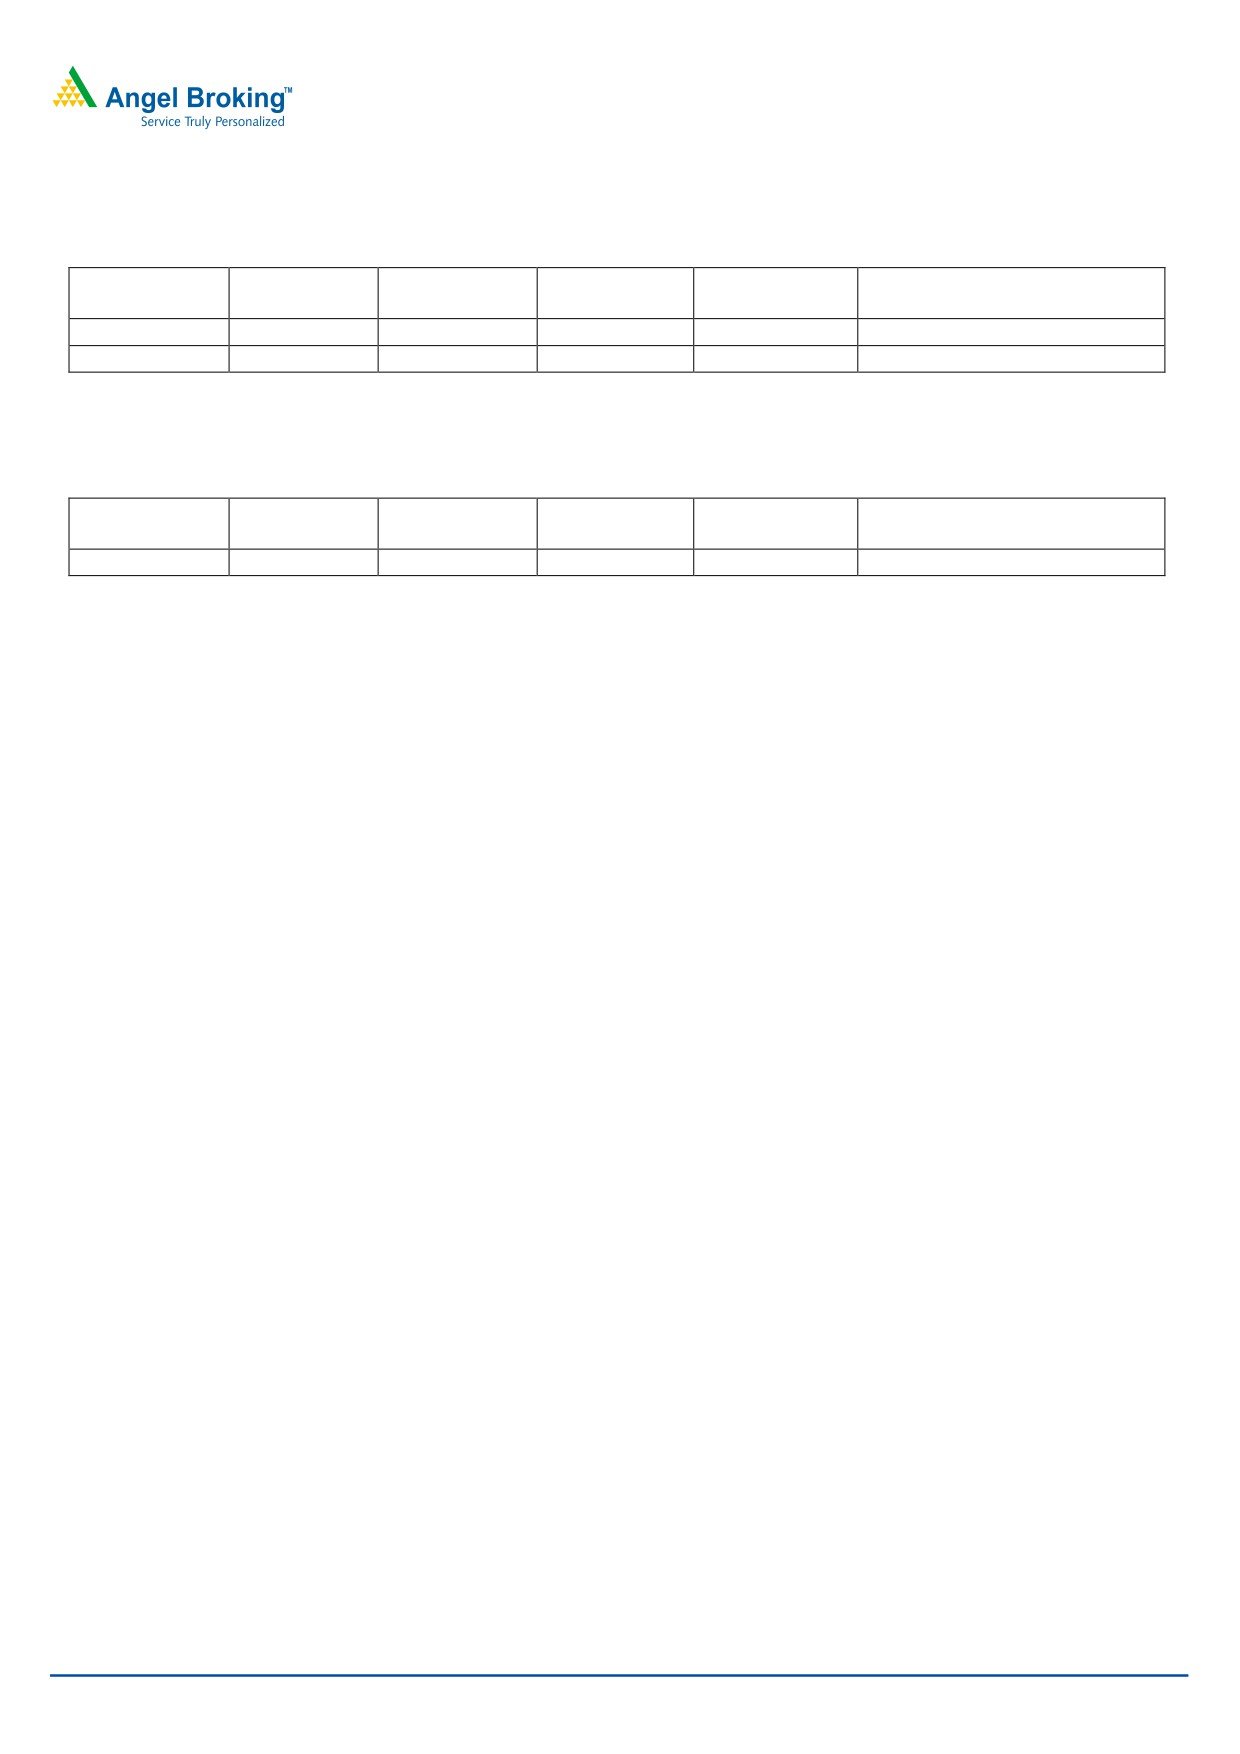
Exhibit 3: Aban Offshore (December Futures)
Stock - Aban Offshore (December Futures)
Action - Sell
Last close
` 313
Selling Range ` 314 - 318
Stop Loss
` 327
Target
` 290
Justification - On the daily chart, we are witnessing a
bearish “Cup and Handle” pattern breakdown at ` 320
with significant rise in volumes. Further, the momentum
oscillator “RSI Smoothend” on the Daily as well as Weekly
chart has given a negative crossover. Hence, we advise
selling this stock in a range of ` 314 to ` 318 for a target of
` 290 in coming 3 - 4 days.
Source: Falcon
For Private Circulation Only |
2
Technical Research | December 16, 2011
Positive Bias:
Expected
Stock Name
CMP
5 Day EMA
20 Day EMA
Remarks
Target
Welspun Corp
84.5
78.2
77.7
95
View will change below 76
BPCL
529.6
533.3
543.9
560
View will change below 505
Negative Bias:
Expected
Stock Name
CMP
5 Day EMA
20 Day EMA
Remarks
Target
PTC
45.3
46.7
50.5
40
View will change above 48
For Private Circulation Only |
3
Technical Research | December 16, 2011
Daily Pivot Levels for Nifty 50 Stocks
SCRIPS
S2
S1
PIVOT
R1
R2
SENSEX
15,468
15,652
15,780
15,964
16,092
NIFTY
4,635
4,691
4,730
4,785
4,824
BANKNIFTY
8,310
8,377
8,443
8,511
8,577
ACC
1,115
1,128
1,138
1,150
1,160
AMBUJACEM
146
150
152
156
158
AXISBANK
927
938
945
956
963
BAJAJ-AUTO
1,612
1,632
1,646
1,666
1,680
BHARTIARTL
327
332
337
342
347
BHEL
241
245
249
253
257
BPCL
511
520
528
537
544
CAIRN
288
294
299
306
310
CIPLA
318
324
327
333
336
DLF
193
198
201
206
209
DRREDDY
1,562
1,574
1,583
1,594
1,603
GAIL
361
366
371
376
380
HCLTECH
402
408
412
418
422
HDFC
613
625
634
645
654
HDFCBANK
422
427
431
436
440
HEROMOTOCO
1,888
1,922
1,944
1,978
2,000
HINDALCO
119
123
126
130
133
HINDUNILVR
377
386
392
400
406
ICICIBANK
681
690
698
707
715
IDFC
100
104
106
110
112
INFY
2,636
2,676
2,705
2,745
2,775
ITC
195
198
200
202
204
JINDALSTEL
498
513
523
537
548
JPASSOCIAT
58
60
61
63
64
KOTAKBANK
473
478
483
488
493
LT
1,090
1,112
1,134
1,156
1,178
M&M
651
658
666
673
682
MARUTI
899
915
928
944
956
NTPC
156
161
164
170
173
ONGC
245
248
251
254
257
PNB
853
861
873
881
893
POWERGRID
93
96
98
102
104
RANBAXY
369
376
387
395
406
RCOM
66
68
69
71
72
RELCAPITAL
255
259
263
267
272
RELIANCE
712
731
743
762
774
RELINFRA
340
349
357
366
374
RPOWER
72
74
76
78
80
SAIL
75
76
77
78
79
SBIN
1,700
1,718
1,745
1,764
1,791
SESAGOA
158
161
164
168
171
SIEMENS
652
660
670
678
688
STER
91
92
94
95
97
SUNPHARMA
511
517
521
527
531
SUZLON
19
20
20
21
22
TATAMOTORS
164
168
172
177
181
TATAPOWER
83
87
89
93
95
TATASTEEL
362
368
374
381
387
TCS
1,140
1,161
1,176
1,197
1,211
WIPRO
394
400
409
416
425
Technical Research Team
For Private Circulation Only |
4
Technical Report
RESEARCH TEAM
Shardul Kulkarni
Head - Technicals
Sameet Chavan
Technical Analyst
Sacchitanand Uttekar
Technical Analyst
Mehul Kothari
Technical Analyst
Ankur Lakhotia
Technical Analyst
Research Team: 022-3952 6600
DISCLAIMER: This document is not for public distribution and has been furnished to you solely for your information and must not
be reproduced or redistributed to any other person. Persons into whose possession this document may come are required to observe
these restrictions.
Opinion expressed is our current opinion as of the date appearing on this material only. While we endeavor to update on a
reasonable basis the information discussed in this material, there may be regulatory, compliance, or other reasons that prevent us
from doing so. Prospective investors and others are cautioned that any forward-looking statements are not predictions and may be
subject to change without notice. Our proprietary trading and investment businesses may make investment decisions that are
inconsistent with the recommendations expressed herein.
The information in this document has been printed on the basis of publicly available information, internal data and other reliable
sources believed to be true and are for general guidance only. While every effort is made to ensure the accuracy and completeness of
information contained, the company takes no guarantee and assumes no liability for any errors or omissions of the information. No
one can use the information as the basis for any claim, demand or cause of action.
Recipients of this material should rely on their own investigations and take their own professional advice. Each recipient of this
document should make such investigations as it deems necessary to arrive at an independent evaluation of an investment in the
securities of companies referred to in this document (including the merits and risks involved), and should consult their own advisors to
determine the merits and risks of such an investment. Price and value of the investments referred to in this material may go up or
down. Past performance is not a guide for future performance. Certain transactions - futures, options and other derivatives as well as
non-investment grade securities - involve substantial risks and are not suitable for all investors. Reports based on technical analysis
centers on studying charts of a stock's price movement and trading volume, as opposed to focusing on a company's fundamentals
and as such, may not match with a report on a company's fundamentals.
We do not undertake to advise you as to any change of our views expressed in this document. While we would endeavor to update
the information herein on a reasonable basis, Angel Broking, its subsidiaries and associated companies, their directors and
employees are under no obligation to update or keep the information current. Also there may be regulatory, compliance, or other
reasons that may prevent Angel Broking and affiliates from doing so. Prospective investors and others are cautioned that any
forward-looking statements are not predictions and may be subject to change without notice.
Angel Broking Limited and affiliates, including the analyst who has issued this report, may, on the date of this report, and from time
to time, have long or short positions in, and buy or sell the securities of the companies mentioned herein or engage in any other
transaction involving such securities and earn brokerage or compensation or act as advisor or have other potential conflict of interest
with respect to company/ies mentioned herein or inconsistent with any recommendation and related information and opinions.
Angel Broking Limited and affiliates may seek to provide or have engaged in providing corporate finance, investment banking or
other advisory services in a merger or specific transaction to the companies referred to in this report, as on the date of this report or
in the past.
Sebi Registration No : INB 010996539
For Private Circulation Only |