Technical Research | April 16, 2012
Daily Technical Report
Sensex (17095) / NIFTY (5207)
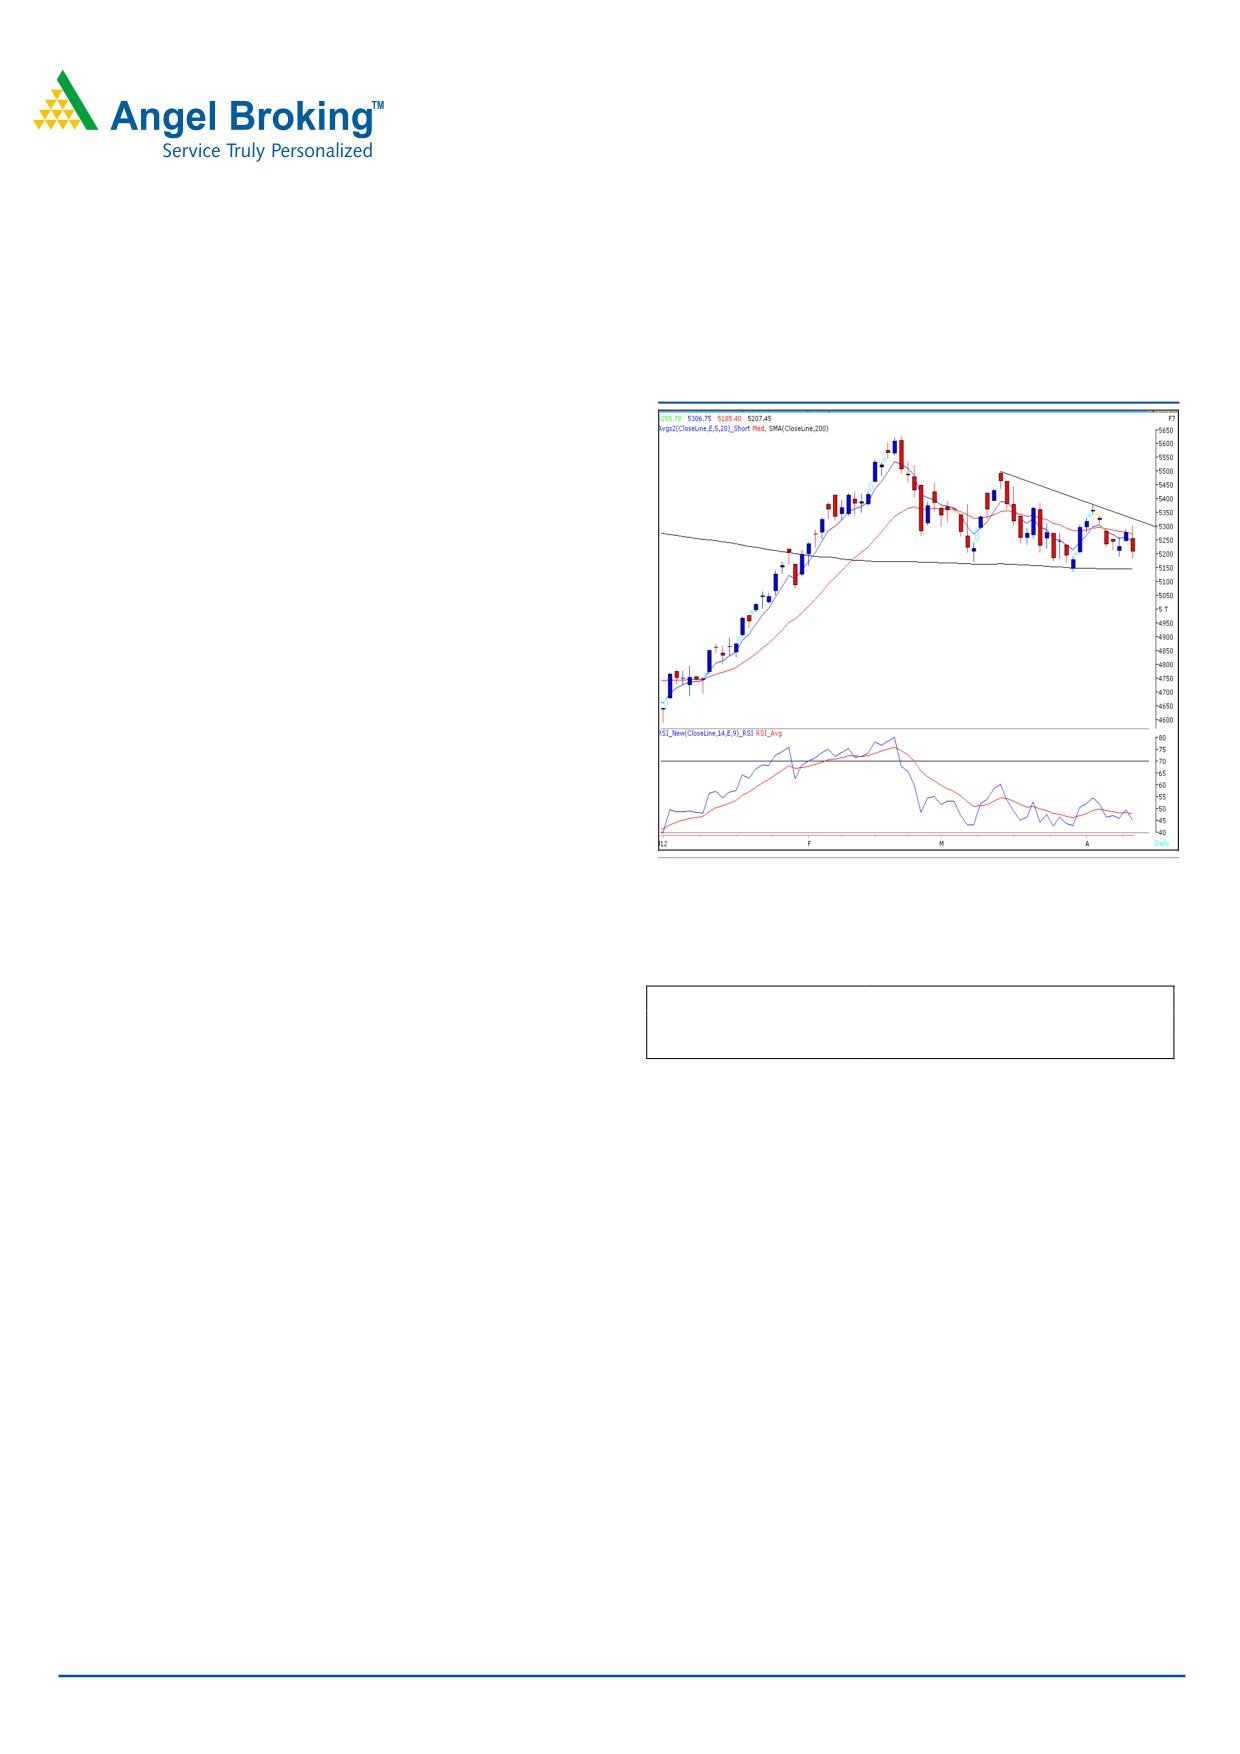
Exhibit 1: Nifty Daily Chart
On Friday, our Benchmark indices opened flat and traded
with positive bias during the initial hour of the session to test
the mentioned resistance zone of 5300. However, during
the latter half, we witnessed a fall of more than 2% from
day’s high and Nifty closed marginally above 5200 mark.
On sectoral front, IT, and Teck counters contributed heavily
in the fall whereas Health Care and FMCG sectors ended
with marginal gains. The advance to decline ratio was in
favor of declining counters (A=1236 D=1567) (Source -
Formation:
• The 200-day SMA (Simple Moving Average) and 20-
day EMA (Exponential Moving Average) have now shifted to
17100 / 5150 and 17400 / 5300, respectively.
Source: Falcon
• The ‘20-Week EMA’ is placed at 17200 / 5200 level.
• We are witnessing a ‘Downward Sloping Trend Line’
Actionable points:
resistance around 17400 / 5300 level.
View
Neutral
Resistance levels
5255-5307
Support Levels
5170 - 5135
Trading strategy:
Considering, Friday’s sharp correction during the second
On account of significant selling pressure in Friday’s
half, we advise traders to stay light on positions and trade
session, markets tumbled down from the day’s high and
with strict stop losses.
closed almost at the lowest point of the week. Indices are
now approaching a strong support zone comprising of the
‘20-week EMA’ and ‘200-day SMA’. This support zone is at
17200 - 17100 / 5200 - 5150 levels. Therefore, going
forward, ONLY if indices sustain below recent swing low of
16920 / 5135, we may witness intense selling pressure and
markets are likely to drift towards the next support levels of
16828 - 16600 / 5076 - 5000. Conversely, 17400 / 5300
level is now a crucial resistance for the indices. Only a
sustainable move, with strong volumes, above the weekly
high 17408 / 5307 will indicate resumption of a strong
uptrend. Indices then may rally towards 17664 - 18041 /
5379 - 5500 levels.
For Private Circulation Only |
1
Technical Research | April 16, 2012
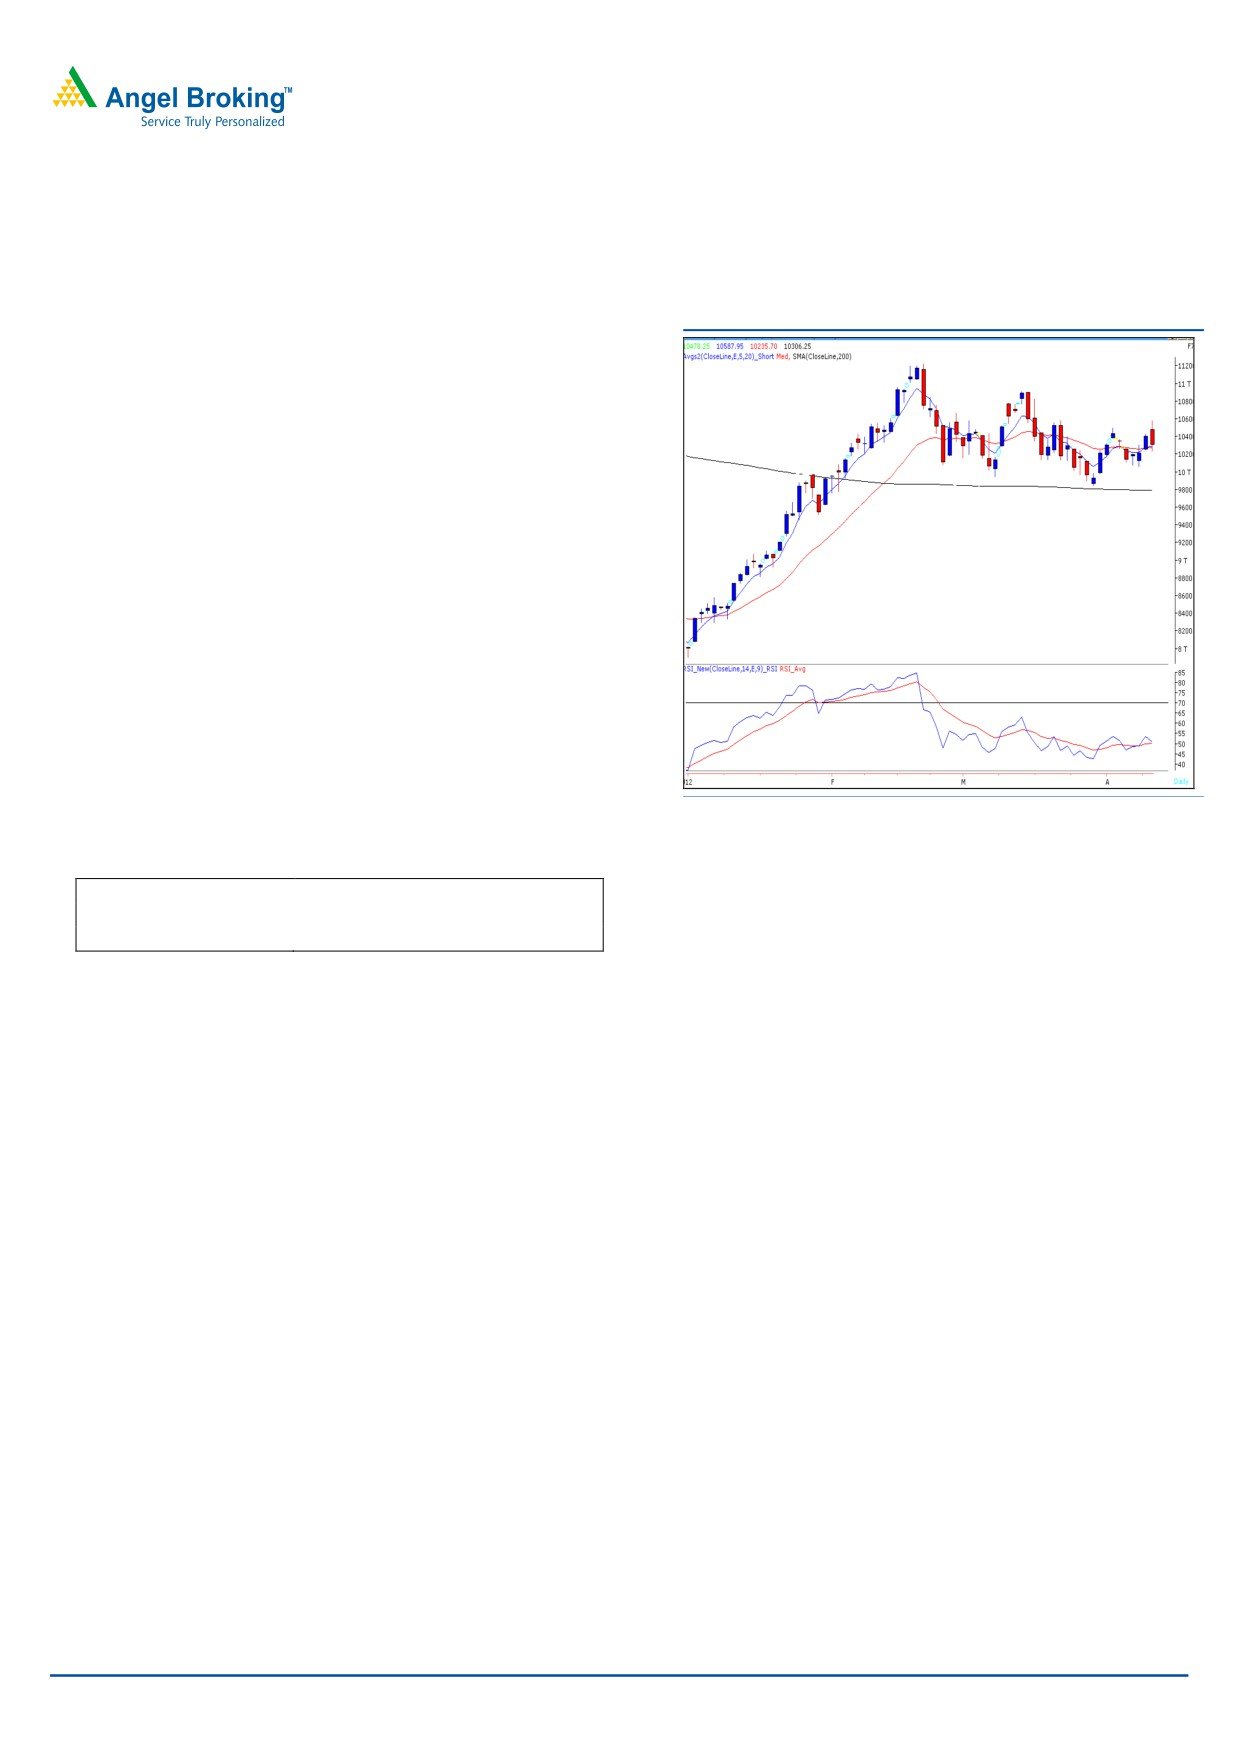
Bank Nifty Outlook - (10306)
Exhibit 2: Bank Nifty Daily Chart
On Friday’s session, Bank Nifty opened with an upside
gap and traded in a narrow range during first half of the
session. However during the second half strong selling
pressure pushed the index to test the mentioned support
level of 10250. As expected we witnessed high volatility
during Friday’s session. The ADX
(14) indicator is
currently placed at 11.38 which suggest that the current
trend is sideways. Moreover, the positioning of the
momentum oscillators on the daily chart reflects lack of
confidence amongst trading participants. Going into the
policy week we may witness volatility in Bank Nifty. On
the upside 10588 - 10625 levels are likely to act as
resistance and 10130 - 10000 levels are likely to act as
support in coming trading sessions.
Source: Falcon
Actionable points:
View
Neutral
Resistance Levels
10588 - 10625
Support Levels
10130 - 10000
For Private Circulation Only |
2
Technical Research | April 16, 2012
Negative Bias:
Negative
Expected
Stock Name
CMP
5 Day EMA
20 Day EMA
Remarks
Below
Target
ROLTA
91.2
93
94
88.9
79
View will change above 93
View will change above
GMR INFRA
28.7
29.2
29.7
28
24
30.2
For Private Circulation Only |
3
Technical Research | April 16, 2012
Daily Pivot Levels for Nifty 50 Stocks
SCRIPS
S2
S1
PIVOT
R1
R2
SENSEX
16,802
16,948
17,173
17,319
17,544
NIFTY
5,112
5,160
5,233
5,281
5,355
BANKNIFTY
10,024
10,165
10,377
10,518
10,729
ACC
1,221
1,240
1,272
1,291
1,324
AMBUJACEM
157
160
163
166
170
AXISBANK
1,118
1,140
1,178
1,201
1,239
BAJAJ-AUTO
1,597
1,618
1,653
1,674
1,708
BHARTIARTL
316
320
324
328
333
BHEL
250
254
258
262
266
BPCL
662
670
681
689
701
CAIRN
337
339
342
344
347
CIPLA
310
312
314
316
318
COALINDIA
330
335
340
344
349
DLF
191
195
200
203
208
DRREDDY
1,687
1,711
1,725
1,749
1,763
GAIL
347
352
359
363
371
HCLTECH
466
473
481
488
496
HDFC
672
676
681
685
690
HDFCBANK
516
523
530
537
544
HEROMOTOCO
2,000
2,028
2,063
2,092
2,127
HINDALCO
121
123
126
128
132
HINDUNILVR
420
423
425
428
431
ICICIBANK
822
843
872
894
922
IDFC
127
130
134
137
142
INFY
2,305
2,354
2,438
2,487
2,572
ITC
229
232
237
240
245
JINDALSTEL
474
486
503
515
532
JPASSOCIAT
71
74
78
81
85
KOTAKBANK
561
571
578
588
594
LT
1,243
1,263
1,295
1,314
1,346
M&M
677
684
698
705
718
MARUTI
1,291
1,307
1,328
1,344
1,366
NTPC
164
165
167
169
170
ONGC
254
257
261
265
268
PNB
875
889
910
924
945
POWERGRID
109
111
112
113
115
RANBAXY
484
492
506
514
528
RCOM
80
82
86
88
92
RELIANCE
726
739
750
763
775
RELINFRA
521
534
554
566
586
RPOWER
111
113
116
118
122
SAIL
92
93
94
95
97
SBIN
2,142
2,177
2,230
2,266
2,319
SESAGOA
181
184
188
190
194
SIEMENS
769
780
798
810
828
STER
104
105
108
109
111
SUNPHARMA
563
574
583
594
603
SUZLON
23
24
24
25
25
TATAMOTORS
283
286
290
294
298
TATAPOWER
100
101
104
105
107
TATASTEEL
438
444
453
459
469
TCS
1,035
1,052
1,078
1,095
1,122
WIPRO
399
409
423
434
448
Technical Research Team
For Private Circulation Only |
4
Technical Report
RESEARCH TEAM
Shardul Kulkarni
Head - Technicals
Sameet Chavan
Technical Analyst
Sacchitanand Uttekar
Technical Analyst
Mehul Kothari
Technical Analyst
Ankur Lakhotia
Technical Analyst
Research Team: 022-3952 6600
DISCLAIMER: This document is not for public distribution and has been furnished to you solely for your information and must not
be reproduced or redistributed to any other person. Persons into whose possession this document may come are required to observe
these restrictions.
Opinion expressed is our current opinion as of the date appearing on this material only. While we endeavor to update on a
reasonable basis the information discussed in this material, there may be regulatory, compliance, or other reasons that prevent us
from doing so. Prospective investors and others are cautioned that any forward-looking statements are not predictions and may be
subject to change without notice. Our proprietary trading and investment businesses may make investment decisions that are
inconsistent with the recommendations expressed herein.
The information in this document has been printed on the basis of publicly available information, internal data and other reliable
sources believed to be true and are for general guidance only. While every effort is made to ensure the accuracy and completeness of
information contained, the company takes no guarantee and assumes no liability for any errors or omissions of the information. No
one can use the information as the basis for any claim, demand or cause of action.
Recipients of this material should rely on their own investigations and take their own professional advice. Each recipient of this
document should make such investigations as it deems necessary to arrive at an independent evaluation of an investment in the
securities of companies referred to in this document (including the merits and risks involved), and should consult their own advisors to
determine the merits and risks of such an investment. Price and value of the investments referred to in this material may go up or
down. Past performance is not a guide for future performance. Certain transactions - futures, options and other derivatives as well as
non-investment grade securities - involve substantial risks and are not suitable for all investors. Reports based on technical analysis
centers on studying charts of a stock's price movement and trading volume, as opposed to focusing on a company's fundamentals
and as such, may not match with a report on a company's fundamentals.
We do not undertake to advise you as to any change of our views expressed in this document. While we would endeavor to update
the information herein on a reasonable basis, Angel Broking, its subsidiaries and associated companies, their directors and
employees are under no obligation to update or keep the information current. Also there may be regulatory, compliance, or other
reasons that may prevent Angel Broking and affiliates from doing so. Prospective investors and others are cautioned that any
forward-looking statements are not predictions and may be subject to change without notice.
Angel Broking Limited and affiliates, including the analyst who has issued this report, may, on the date of this report, and from time
to time, have long or short positions in, and buy or sell the securities of the companies mentioned herein or engage in any other
transaction involving such securities and earn brokerage or compensation or act as advisor or have other potential conflict of interest
with respect to company/ies mentioned herein or inconsistent with any recommendation and related information and opinions.
Angel Broking Limited and affiliates may seek to provide or have engaged in providing corporate finance, investment banking or
other advisory services in a merger or specific transaction to the companies referred to in this report, as on the date of this report or
in the past.
Sebi Registration No: INB 010996539
For Private Circulation Only |