Technical Research | January 16, 2012
Daily Technical Report
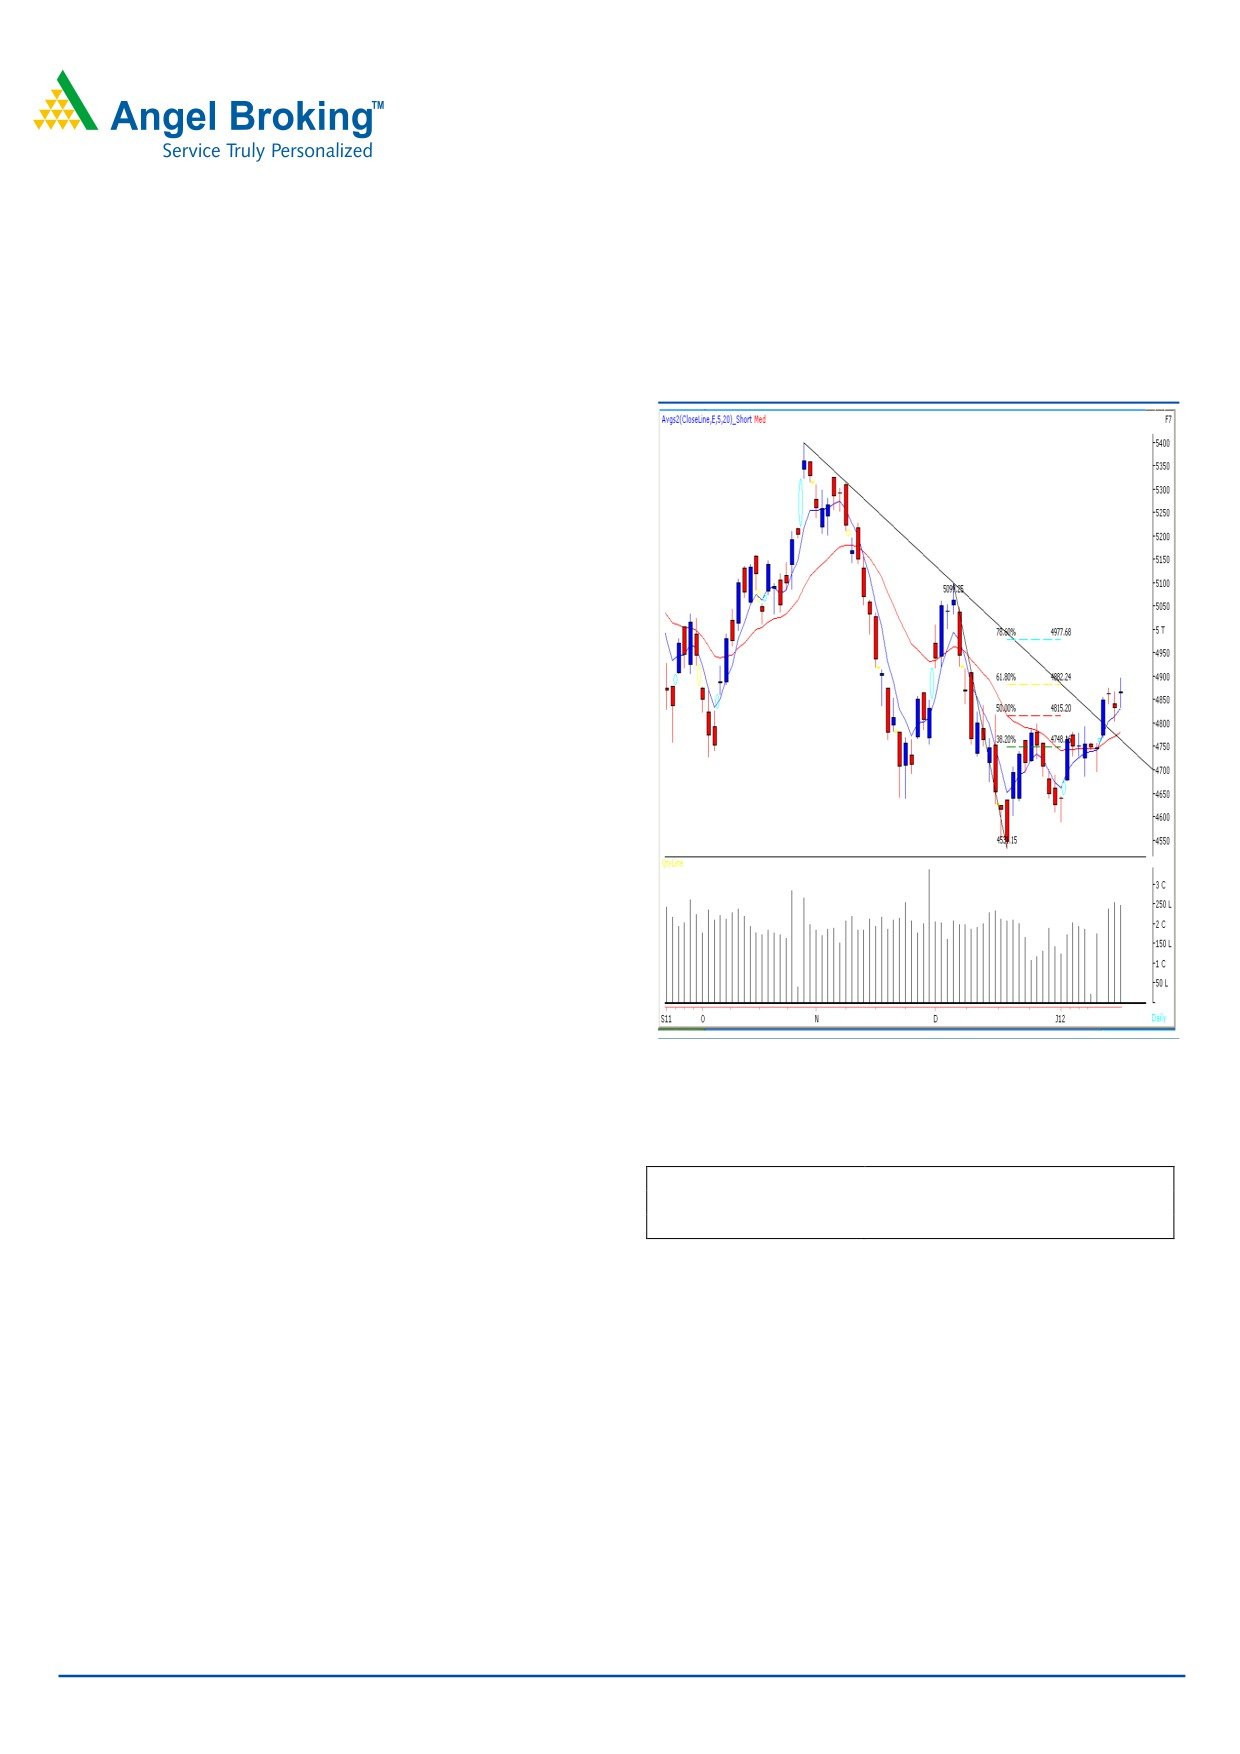
Sensex (16155) / NIFTY (4866)
Exhibit 1: Nifty Daily Chart
On Friday, markets opened higher in-line with global cues
and traded with extreme volatility throughout the session. As
a result, despite crossing 16286 / 4881 level, indices
drifted during the latter part of the day and finally closed
almost at the initial opening level. On the sectoral front,
Metal, Capital Goods and Power sectors were among the
major gainers, whereas Consumer Durables and Oil & Gas
counters ended marginally on the losing side. The advance
to decline ratio was strongly in favor of gaining counters.
Formation:
• The 20-day EMA (Exponential Moving Average) has
now shifted to the 15940 / 4780 level.
• The positive crossover in weekly momentum oscillators,
viz. the RSI and the Stochastic, is still intact.
• On the Daily chart, we witnessed a “Downward Sloping
Trend Line” breakout from the resistance level of 16070 /
4820.
Source: Falcon
• The 61.8% Fibonacci retracement level of the fall from
17004 to 15135 / 5100 to 4531 is at 16290 / 4881.
Trading strategy:
Actionable points:
View
Positive Above 4920
After several attempts, markets finally managed to break
Expected Targets
4976
out from the stiff resistance zone of 16070 / 4820, which
Support levels
4834 - 4803
also resulted in “Downward Sloping Trend Line” break out
on the daily chart. Going forward, the bias remains positive
In this case, they are likely to head towards the next
as indices are trading convincingly above the 20 day EMA
resistance levels of 16600 - 17004 / 4976 - 5100. On the
and have formed a “Higher Top Higher Bottom” formation
downside, indices have a decent support near 15962 -
on the daily chart. Further, looking at last 2-3 trading
15940 / 4803 - 4780 levels. A move below 15940 / 4780
sessions, we have observed that indices are facing
level may result in loss of positive momentum and then
headwinds around the 61.8% Fibonacci retracement level of
indices are likely to slide towards the 16000 / 4686 level.
16290 / 4881. Further, the positive crossover in weekly
oscillators is still intact. Hence, the positive momentum may
resume if indices sustain above the 16421 / 4920 level.
For Private Circulation Only |
1
Technical Research | January 16, 2012
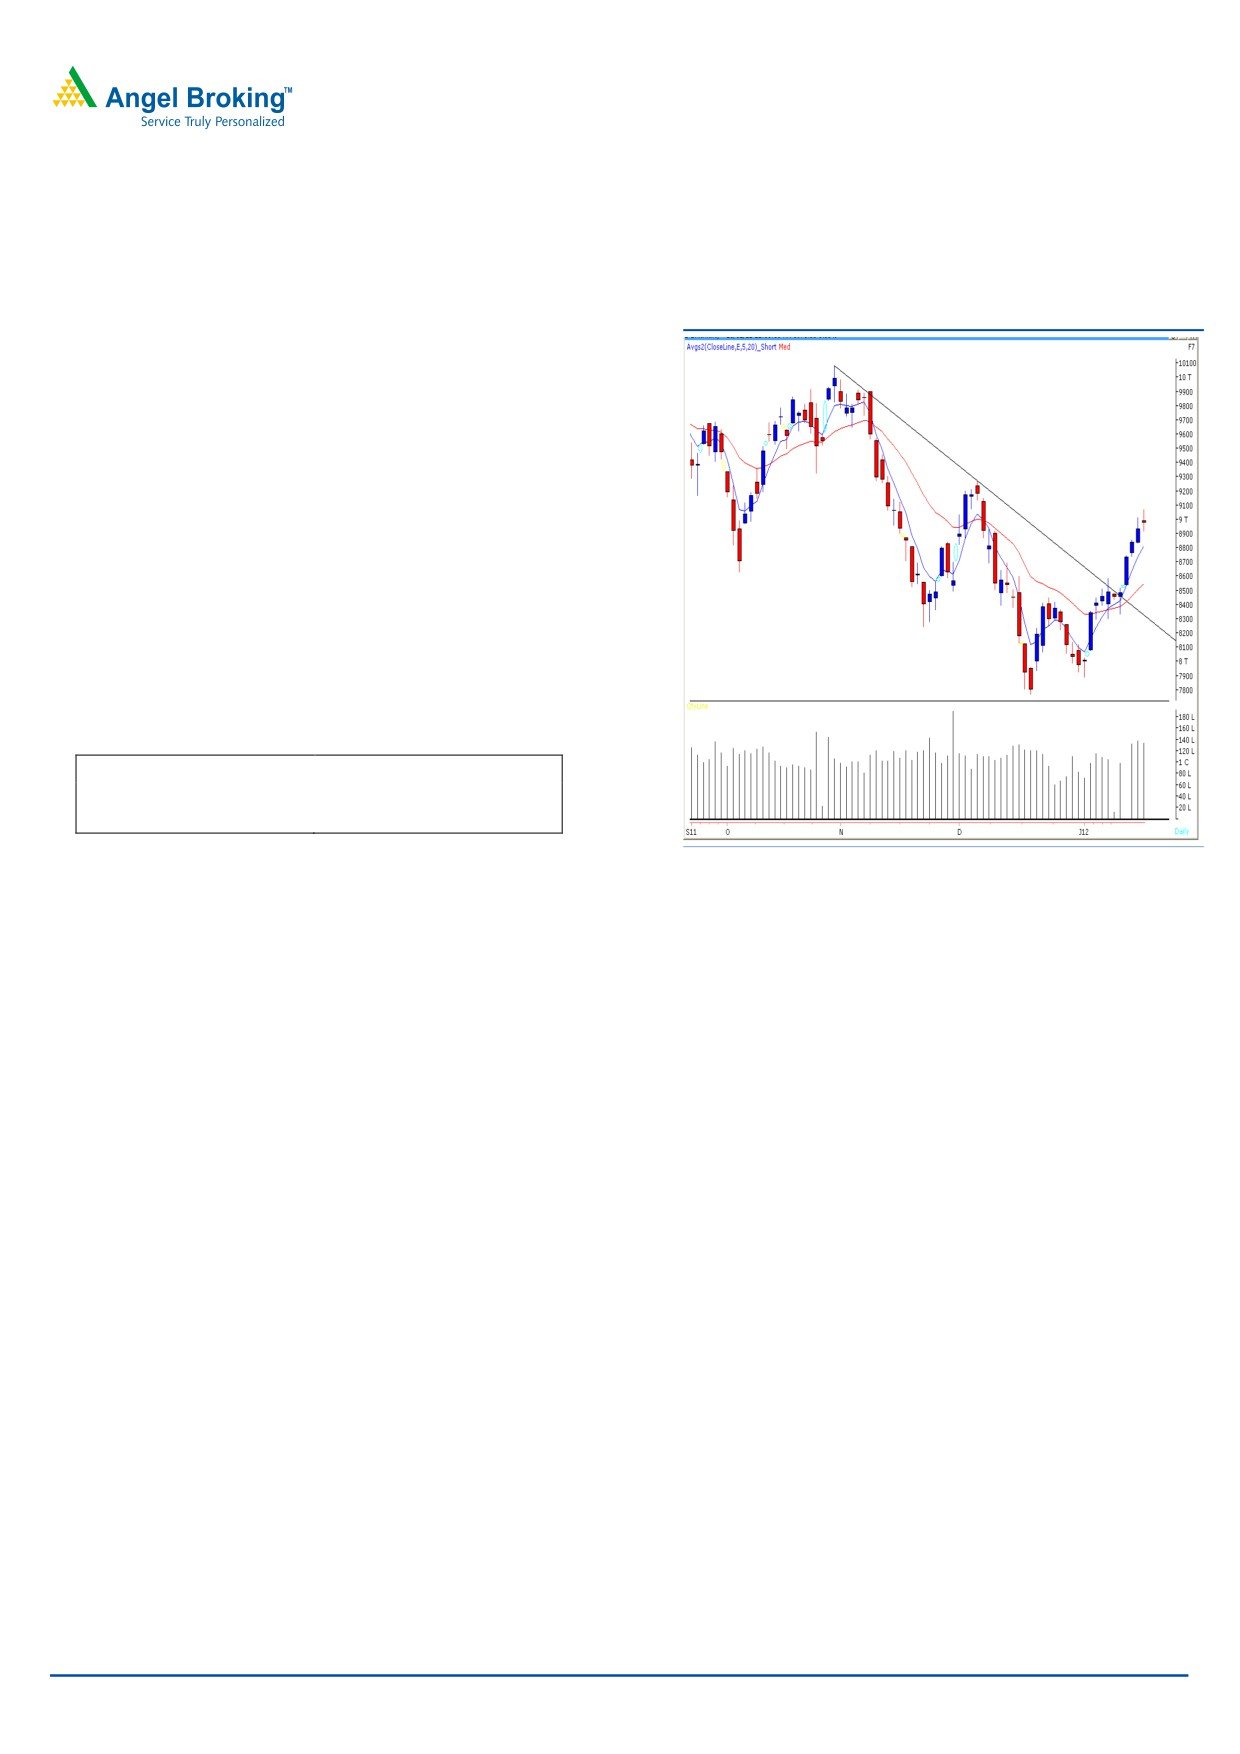
Bank Nifty Outlook - (8975)
Exhibit 2: Bank Nifty Daily Chart
On Friday, Bank Nifty opened on flat note and traded in a
narrow range throughout the session to close near the initial
opening level. The Daily chart depicts a “Doji” candlestick
pattern, which indicates indecisiveness prevailing at current
levels. The index has faced resistance near its “20 Week
EMA” which is placed at 9110. However, on the flip side, we
are witnessing a positive crossover in “RSI Smoothened”
oscillator on Weekly chart. Hence, any sustainable move
above Friday’s high of 9073 level would help Bank Nifty to
test 9110 - 9275 levels. On the downside, low of the “Doji”
(8913) would now act as a crucial support, below which we
may witness a minor correction up to 8810 - 8750 levels.
Actionable points:
View
Positive Above 9073
Expected Target
9110 - 9275
Support Levels
8913 - 8810
Source: Falcon
For Private Circulation Only |
2
Technical Research | January 16, 2012
Positive Bias:
Expected
Stock Name
CMP
5 Day EMA
20 Day EMA
Remarks
Target
ITC
207.75
205.6
203.4
216
View will change below 200.5
IRB
145.05
138.4
136.7
160
View will change below 135
Negative Bias:
Expected
Stock Name
CMP
5 Day EMA
20 Day EMA
Remarks
Target
GAIL
373.5
379.8
384.6
352
View will change above 388
Bajaj-Auto
1430.8
1449
1510.6
1360
View will change above 1490
For Private Circulation Only |
3
Technical Research | January 16, 2012
Daily Pivot Levels for Nifty 50 Stocks
SCRIPS
S2
S1
PIVOT
R1
R2
SENSEX
15,946
16,050
16,154
16,258
16,361
NIFTY
4,802
4,834
4,866
4,899
4,931
BANKNIFTY
8,828
8,902
8,987
9,061
9,146
ACC
1,106
1,115
1,123
1,132
1,140
AMBUJACEM
149
150
152
153
155
AXISBANK
914
927
941
954
969
BAJAJ-AUTO
1,379
1,405
1,447
1,473
1,515
BHARTIARTL
324
329
334
339
344
BHEL
261
264
266
269
272
BPCL
498
504
511
516
524
CAIRN
324
330
334
340
344
CIPLA
331
335
338
342
346
DLF
188
192
197
201
205
DRREDDY
1,624
1,642
1,655
1,673
1,685
GAIL
362
368
378
384
394
HCLTECH
389
393
401
405
413
HDFC
659
670
682
694
706
HDFCBANK
456
463
468
475
480
HEROMOTOCO
1,753
1,773
1,796
1,816
1,839
HINDALCO
128
131
133
136
139
HINDUNILVR
388
390
392
394
397
ICICIBANK
764
777
793
806
822
IDFC
104
106
109
111
114
INFY
2,518
2,551
2,585
2,618
2,652
ITC
203
205
206
208
210
JINDALSTEL
480
492
502
513
524
JPASSOCIAT
58
59
60
61
62
KOTAKBANK
455
464
470
479
485
LT
1,115
1,144
1,161
1,190
1,207
M&M
674
683
691
700
708
MARUTI
952
964
987
1,000
1,022
NTPC
159
162
165
168
171
ONGC
255
257
259
261
263
PNB
875
885
900
910
925
POWERGRID
100
101
102
103
103
RANBAXY
444
454
461
471
477
RCOM
80
84
87
90
93
RELCAPITAL
273
286
296
309
318
RELIANCE
714
723
737
746
760
RELINFRA
393
402
414
423
436
RPOWER
80
85
88
93
97
SAIL
90
91
93
94
97
SBIN
1,752
1,764
1,782
1,794
1,812
SESAGOA
179
183
187
191
196
SIEMENS
699
711
720
732
741
STER
99
101
104
106
108
SUNPHARMA
501
507
515
521
529
SUZLON
20
21
22
23
24
TATAMOTORS
203
206
210
213
216
TATAPOWER
93
95
97
98
100
TATASTEEL
378
397
411
430
444
TCS
1,057
1,071
1,087
1,102
1,118
WIPRO
385
393
399
407
413
Technical Research Team
For Private Circulation Only |
4
Technical Report
RESEARCH TEAM
Shardul Kulkarni
Head - Technicals
Sameet Chavan
Technical Analyst
Sacchitanand Uttekar
Technical Analyst
Mehul Kothari
Technical Analyst
Ankur Lakhotia
Technical Analyst
Research Team: 022-3952 6600
DISCLAIMER: This document is not for public distribution and has been furnished to you solely for your information and must not
be reproduced or redistributed to any other person. Persons into whose possession this document may come are required to observe
these restrictions.
Opinion expressed is our current opinion as of the date appearing on this material only. While we endeavor to update on a
reasonable basis the information discussed in this material, there may be regulatory, compliance, or other reasons that prevent us
from doing so. Prospective investors and others are cautioned that any forward-looking statements are not predictions and may be
subject to change without notice. Our proprietary trading and investment businesses may make investment decisions that are
inconsistent with the recommendations expressed herein.
The information in this document has been printed on the basis of publicly available information, internal data and other reliable
sources believed to be true and are for general guidance only. While every effort is made to ensure the accuracy and completeness of
information contained, the company takes no guarantee and assumes no liability for any errors or omissions of the information. No
one can use the information as the basis for any claim, demand or cause of action.
Recipients of this material should rely on their own investigations and take their own professional advice. Each recipient of this
document should make such investigations as it deems necessary to arrive at an independent evaluation of an investment in the
securities of companies referred to in this document (including the merits and risks involved), and should consult their own advisors to
determine the merits and risks of such an investment. Price and value of the investments referred to in this material may go up or
down. Past performance is not a guide for future performance. Certain transactions - futures, options and other derivatives as well as
non-investment grade securities - involve substantial risks and are not suitable for all investors. Reports based on technical analysis
centers on studying charts of a stock's price movement and trading volume, as opposed to focusing on a company's fundamentals
and as such, may not match with a report on a company's fundamentals.
We do not undertake to advise you as to any change of our views expressed in this document. While we would endeavor to update
the information herein on a reasonable basis, Angel Broking, its subsidiaries and associated companies, their directors and
employees are under no obligation to update or keep the information current. Also there may be regulatory, compliance, or other
reasons that may prevent Angel Broking and affiliates from doing so. Prospective investors and others are cautioned that any
forward-looking statements are not predictions and may be subject to change without notice.
Angel Broking Limited and affiliates, including the analyst who has issued this report, may, on the date of this report, and from time
to time, have long or short positions in, and buy or sell the securities of the companies mentioned herein or engage in any other
transaction involving such securities and earn brokerage or compensation or act as advisor or have other potential conflict of interest
with respect to company/ies mentioned herein or inconsistent with any recommendation and related information and opinions.
Angel Broking Limited and affiliates may seek to provide or have engaged in providing corporate finance, investment banking or
other advisory services in a merger or specific transaction to the companies referred to in this report, as on the date of this report or
in the past.
Sebi Registration No : INB 010996539
For Private Circulation Only |