Daily Technical Report
June 15, 2012
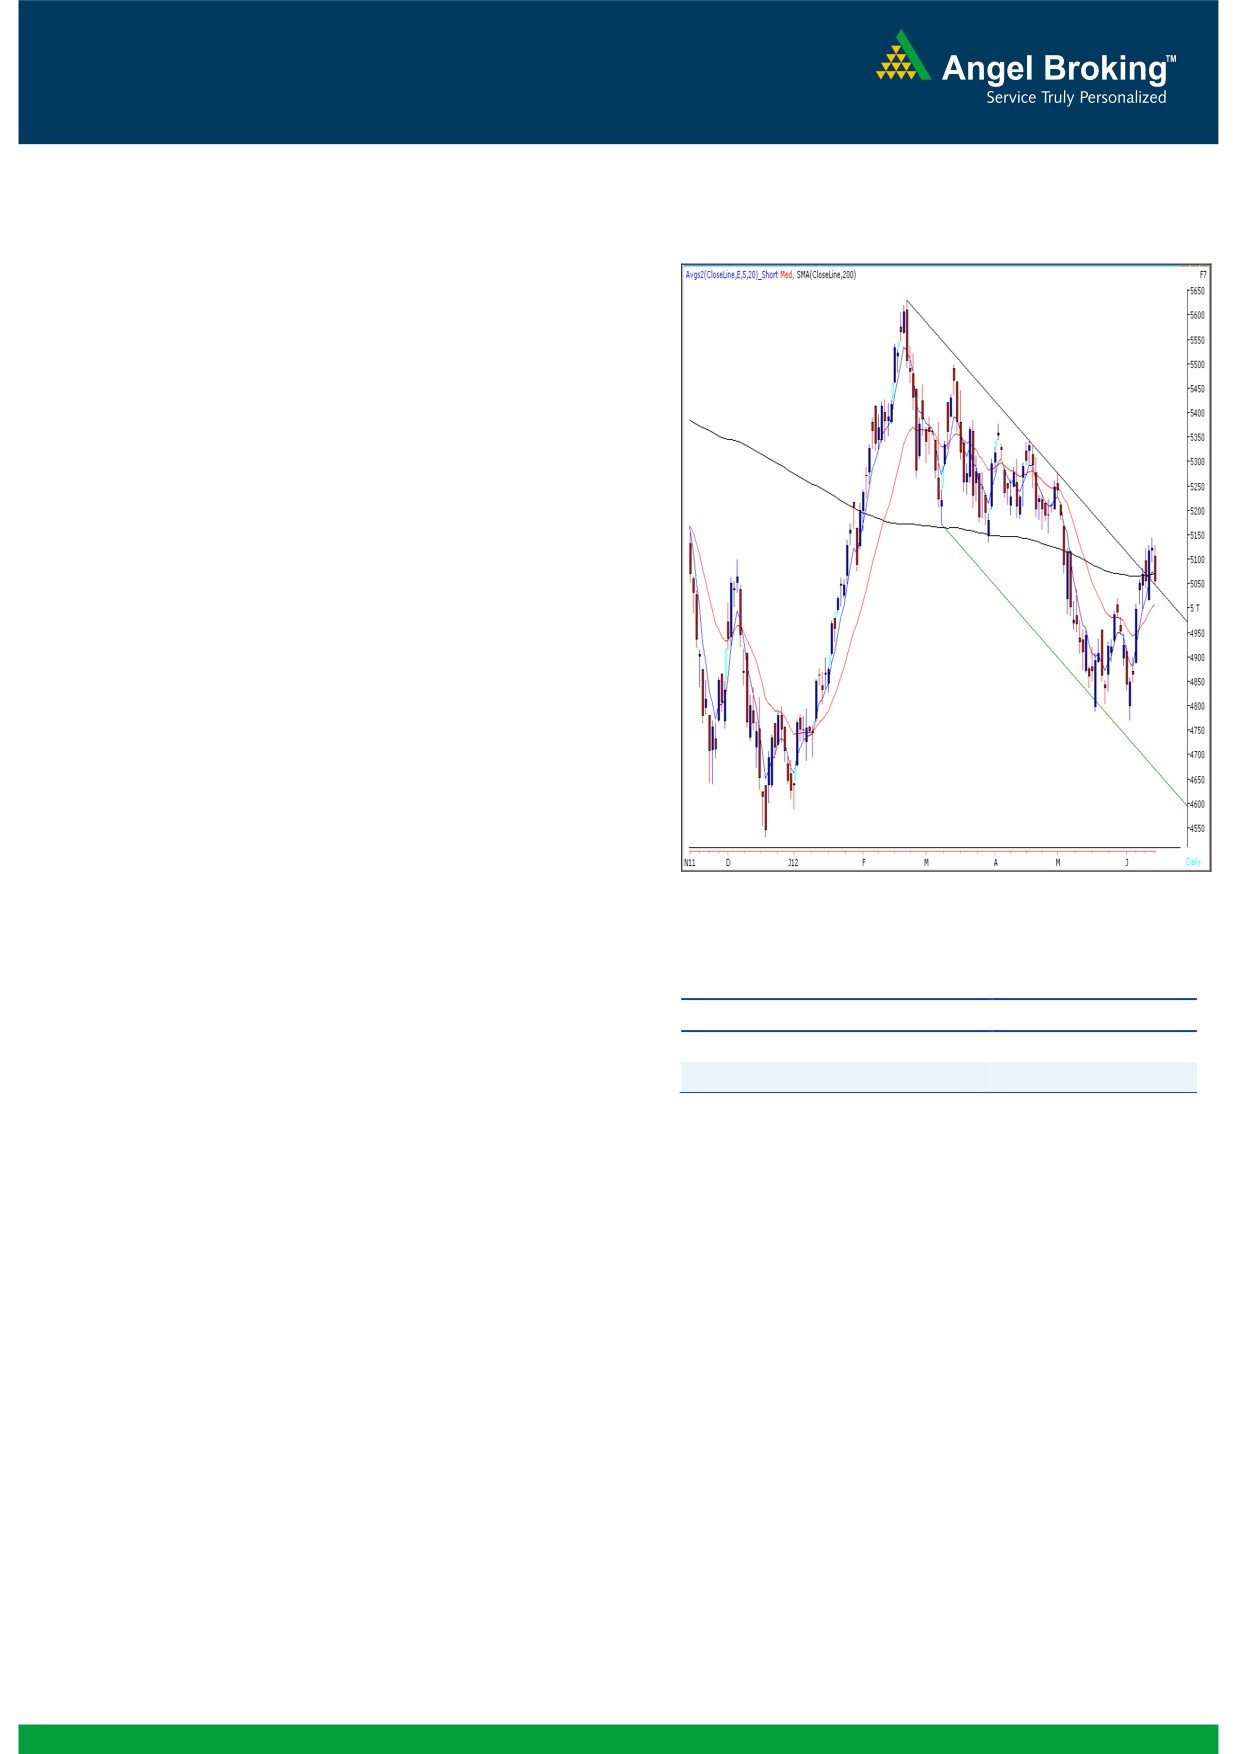
Exhibit 1: Nifty Daily Chart
Sensex (16678) / NIFTY (5055)
Yesterday, our benchmark indices opened on a flat
note in-line with mixed global cues. However, post the
announcement of the inflation numbers, indices
tumbled down sharply to test 5050 mark. On sectoral
front, Realty, Banking and Capital Goods counters
corrected heavily were during yesterday’s session;
whereas IT and Teck ended with a nominal gain. The
advance to decline ratio was strongly in favor of
declining counters (A=1011 D=1701) (Source
-
Formation
The 200-day SMA (Simple Moving Average) and
20-day EMA (Exponential Moving Average) have
now shifted to 16800 / 5070 and 16500 /
5005, respectively.
The ‘20-Week EMA’ is placed at 16830 / 5100
level.
Indices have taken a support near 15860 /
4766 level, which is the
78.6% Fibonacci
Source: Falcon
Retracement level of the rise from 15135 / 4531
(Low on December 23, 2011) to 18524 / 5630
(High on February 22, 2012).
Actionable points:
On the daily chart, indices are trading near the
View
Neutral
upper range of ‘Downward Sloping Channel’
Resistance Levels
5085 - 5145
drawn by joining two highs of February 22,
Support Levels
5047 - 5005
2012 - April 19, 2012 and low of March 7,
2012.
The weekly ‘RSI’ momentum oscillator is
signaling a positive crossover.
While the underlying tone still remains bullish, we
expect a choppy session for the day as traders would
Trading strategy:
brace themselves for the upcoming Greece elections
and the RBI monetary policy. For the Bulls (positional
Markets opened on a flat note and traded quietly
traders), the swing high of 16544 / 5020, remains
during the first half. The inflation numbers put the
an important support level on a closing basis.
spanner in the works and markets lost their positive
momentum to correct sharply and close just above
5050 mark. Going forward, if indices manage to
sustain below yesterday’s low of 16658 / 5047, then
they are likely to test ’20-day EMA’ support level of
16500 / 5005. Conversely, the intraday resistance is
seen around 16750 - 16945 / 5085 - 5145 levels.
1
Daily Technical Report
June 15, 2012
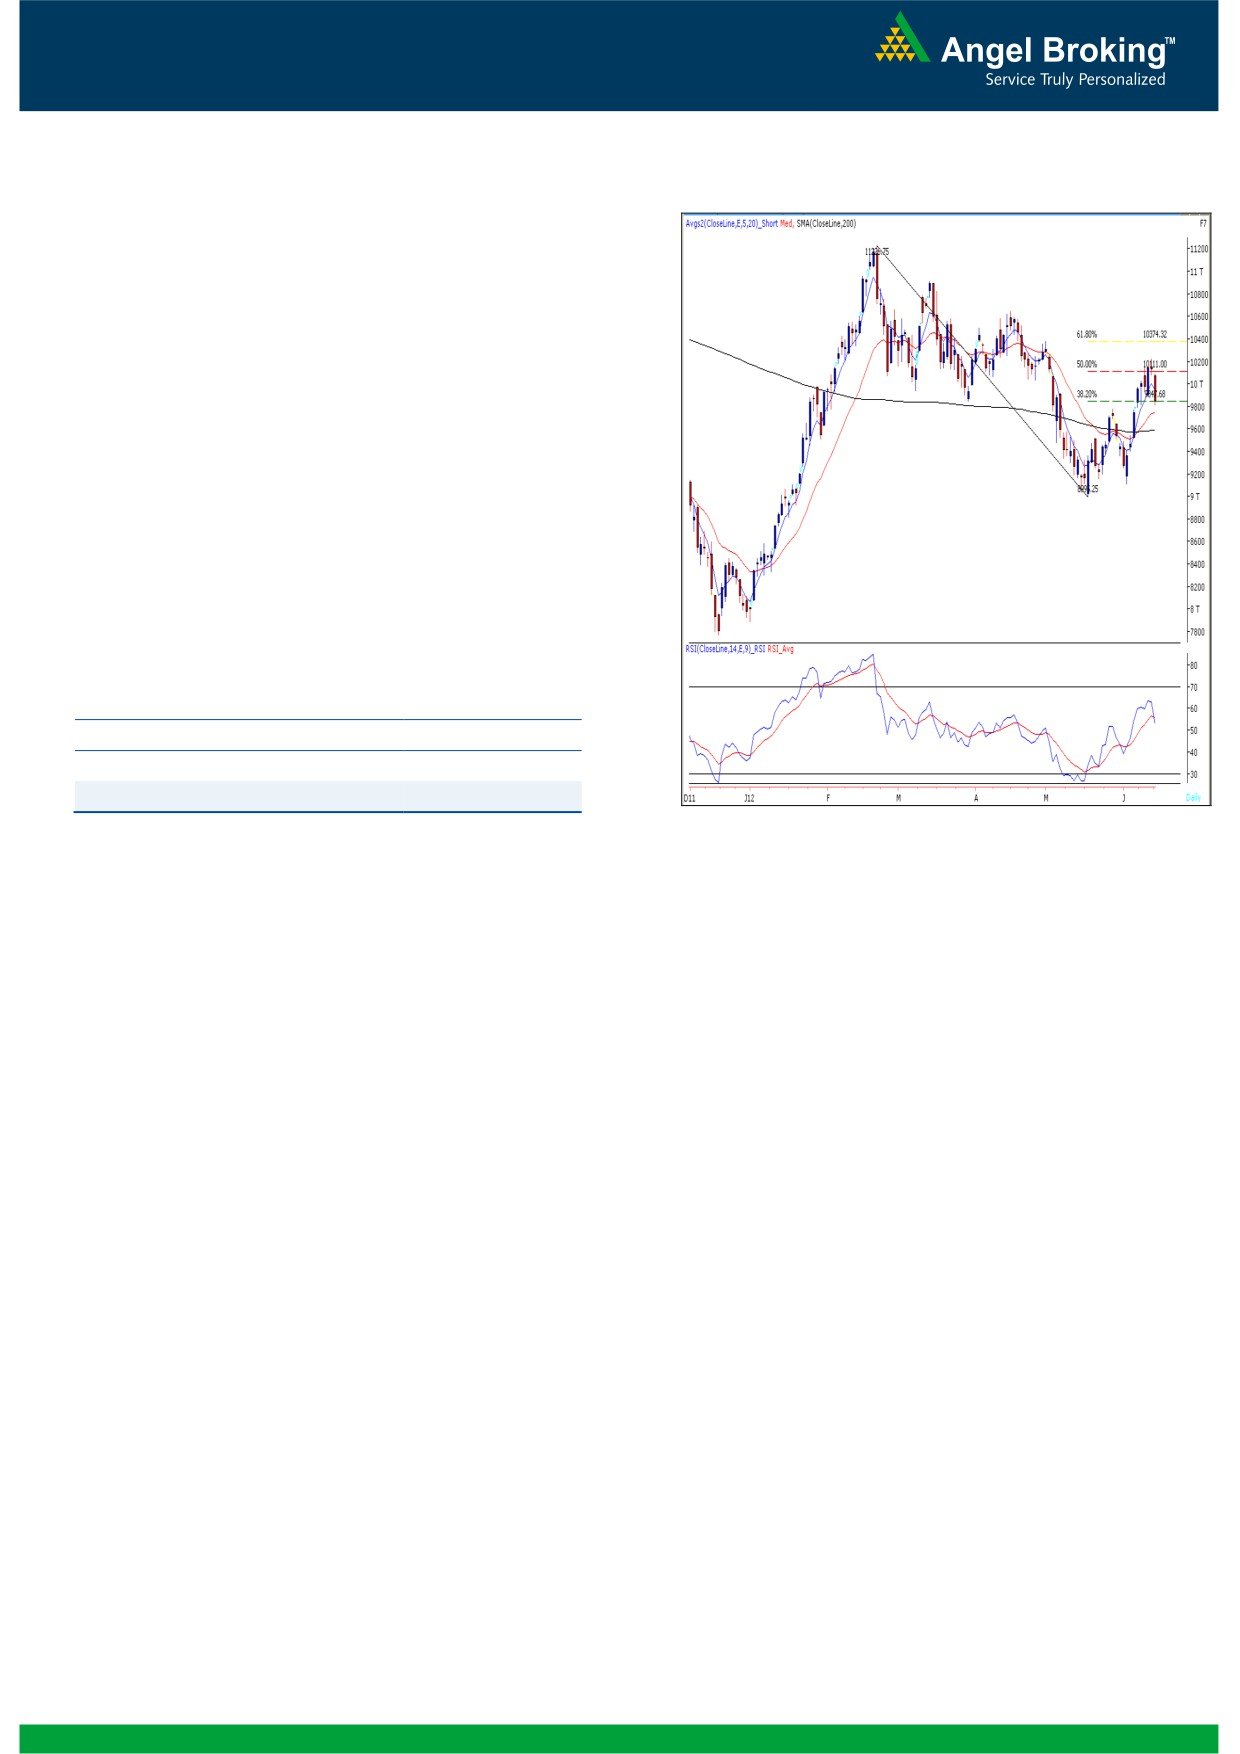
Exhibit 2: Bank Nifty Daily Chart
Bank Nifty Outlook - (9837)
Yesterday, Bank Nifty opened on a pessimistic note
and traded in a narrow range during the initial hours
of trade. However during the second half we
witnessed selling pressure which led the index to close
near the low point of the day. The candlestick pattern
formed on the daily chart resembles an “Evening Star”
but requires confirmation in the form of a close below
9813. The “Stochastic” and “RSI” momentum
oscillators are negatively poised. The combined effect
of these negative indicators would be seen only if the
index sustains below yesterday’s low of 9813. In this
case the index is likely to drift towards 9699 - 9589
levels. On the upside 10095 - 10220 levels may act
as resistance in coming trading session.
Actionable points:
View
Neutral
Resistance levels
10095 - 10220
Support Levels
9813
Source: Falcon
2
Daily Technical Report
June 15, 2012
Daily Pivot Levels for Nifty 50 Stocks
SCRIPS
S2
S1
PIVOT
R1
R2
SENSEX
16,490
16,584
16,753
16,847
17,015
NIFTY
4,995
5,025
5,077
5,107
5,160
BANKNIFTY
9,633
9,735
9,916
10,018
10,199
ACC
1,153
1,172
1,190
1,208
1,226
AMBUJACEM
159
161
163
165
168
ASIANPAINT
3,824
3,848
3,881
3,904
3,937
AXISBANK
987
1,000
1,019
1,032
1,051
BAJAJ-AUTO
1,517
1,534
1,555
1,572
1,593
BANKBARODA
676
685
699
708
721
BHARTIARTL
301
304
306
308
311
BHEL
213
215
219
221
224
BPCL
717
728
735
747
754
CAIRN
318
321
324
327
329
CIPLA
301
304
306
309
311
COALINDIA
325
328
332
335
340
DLF
186
189
193
196
200
DRREDDY
1,522
1,539
1,559
1,576
1,596
GAIL
325
329
337
341
349
GRASIM
2,300
2,323
2,360
2,384
2,421
HCLTECH
465
472
483
490
501
HDFC
632
638
648
654
664
HDFCBANK
523
529
538
544
553
HEROMOTOCO
1,913
1,933
1,957
1,977
2,000
HINDALCO
118
119
121
122
125
HINDUNILVR
434
437
444
447
453
ICICIBANK
795
807
828
840
861
IDFC
124
126
131
133
137
INFY
2,441
2,470
2,490
2,519
2,539
ITC
240
242
245
248
251
JINDALSTEL
425
430
435
439
445
JPASSOCIAT
66
67
68
69
71
KOTAKBANK
553
561
574
581
594
LT
1,251
1,274
1,312
1,335
1,372
M&M
668
674
684
690
700
MARUTI
1,041
1,060
1,093
1,113
1,145
NTPC
143
146
150
153
157
ONGC
262
265
267
270
273
PNB
746
758
779
791
812
POWERGRID
103
104
106
108
109
RANBAXY
462
467
475
480
489
RELIANCE
706
711
716
721
726
RELINFRA
485
492
505
512
525
SAIL
88
90
93
94
97
SBIN
2,096
2,123
2,171
2,198
2,246
SESAGOA
182
185
188
191
194
SIEMENS
680
687
697
704
714
STER
99
100
102
104
106
SUNPHARMA
572
577
585
591
599
TATAMOTORS
217
222
231
236
244
TATAPOWER
88
90
93
95
97
TATASTEEL
399
403
410
414
421
TCS
1,237
1,246
1,254
1,262
1,270
WIPRO
388
391
395
398
402
3
Daily Technical Report
June 15, 2012
Research Team Tel: 022 - 39357800
DISCLAIMER
This document is solely for the personal information of the recipient, and must not be singularly used as the basis of any investment
decision. Nothing in this document should be construed as investment or financial advice. Each recipient of this document should make
such investigations as they deem necessary to arrive at an independent evaluation of an investment in the securities of the companies
referred to in this document (including the merits and risks involved), and should consult their own advisors to determine the merits and
risks of such an investment.
Angel Broking Limited, its affiliates, directors, its proprietary trading and investment businesses may, from time to time, make
investment decisions that are inconsistent with or contradictory to the recommendations expressed herein. The views contained in this
document are those of the analyst, and the company may or may not subscribe to all the views expressed within.
Reports based on technical and derivative analysis center on studying charts of a stock's price movement, outstanding positions and
trading volume, as opposed to focusing on a company's fundamentals and, as such, may not match with a report on a company's
fundamentals.
The information in this document has been printed on the basis of publicly available information, internal data and other reliable
sources believed to be true, but we do not represent that it is accurate or complete and it should not be relied on as such, as this
document is for general guidance only. Angel Broking Limited or any of its affiliates/ group companies shall not be in any way
responsible for any loss or damage that may arise to any person from any inadvertent error in the information contained in this report.
Angel Broking Limited has not independently verified all the information contained within this document. Accordingly, we cannot testify,
nor make any representation or warranty, express or implied, to the accuracy, contents or data contained within this document. While
Angel Broking Limited endeavours to update on a reasonable basis the information discussed in this material, there may be regulatory,
compliance, or other reasons that prevent us from doing so.
This document is being supplied to you solely for your information, and its contents, information or data may not be reproduced,
redistributed or passed on, directly or indirectly.
Angel Broking Limited and its affiliates may seek to provide or have engaged in providing corporate finance, investment banking or
other advisory services in a merger or specific transaction to the companies referred to in this report, as on the date of this report or in
the past.
Neither Angel Broking Limited, nor its directors, employees or affiliates shall be liable for any loss or damage that may arise from or in
connection with the use of this information.
Note: Please refer to the important `Stock Holding Disclosure' report on the Angel website (Research Section). Also, please refer to the
latest update on respective stocks for the disclosure status in respect of those stocks. Angel Broking Limited and its affiliates may have
investment positions in the stocks recommended in this report.
Research Team
Shardul Kulkarni
-
Head - Technicals
Sameet Chavan
-
Technical Analyst
Sacchitanand Uttekar
-
Technical Analyst
Mehul Kothari
-
Technical Analyst
Ankur Lakhotia
-
Technical Analyst
Angel Broking Pvt. Ltd.
Registered Office: G-1, Ackruti Trade Centre, Rd. No. 7, MIDC, Andheri (E), Mumbai - 400 093.
Corporate Office: 6th Floor, Ackruti Star, MIDC, Andheri (E), Mumbai - 400 093. Tel: (022) 3952 6600
Sebi Registration No: INB 010996539
4