Daily Technical Report
May 15, 2012
Sensex (16216) / NIFTY (4908)
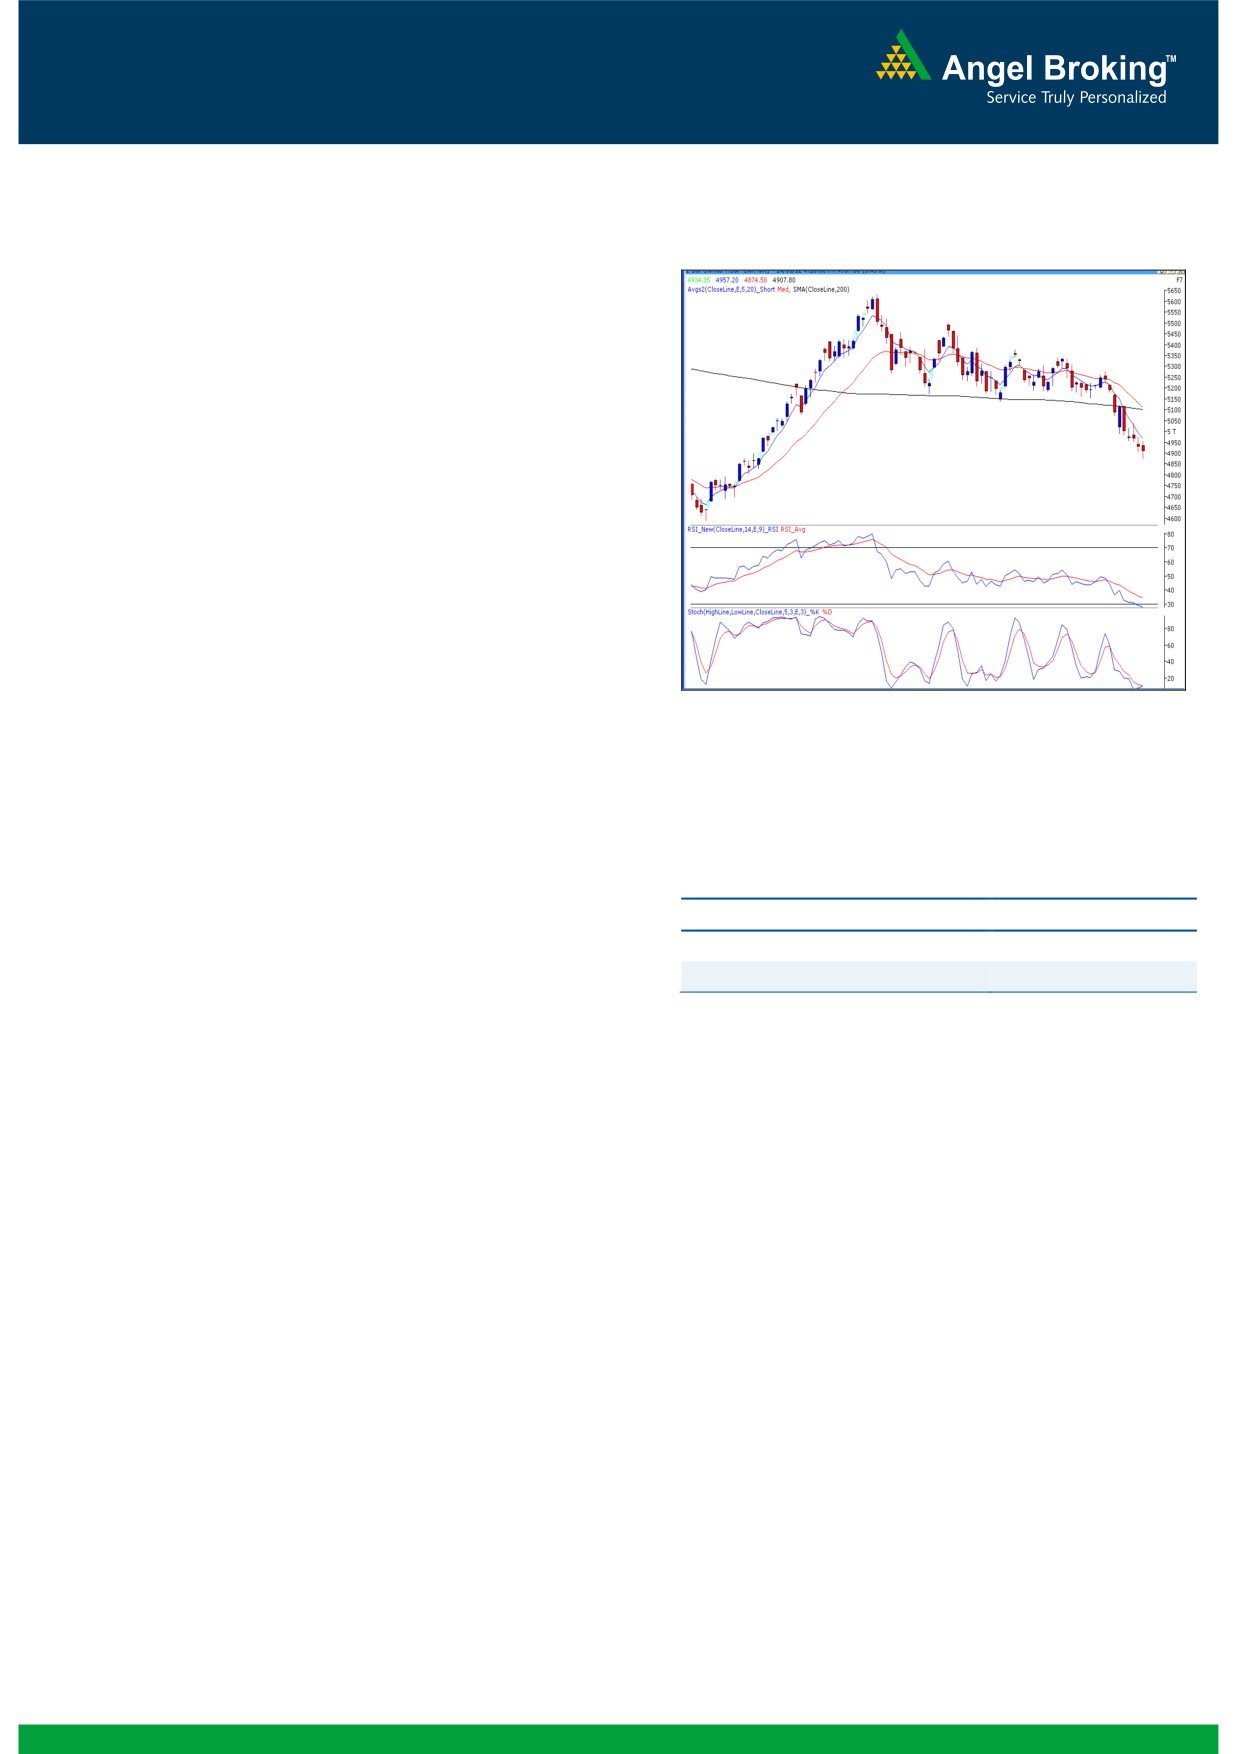
Exhibit 1: Nifty Daily Chart
Yesterday, we witnessed a quiet opening on the back
of mix global cues. However, inflation data
disappointed the street and markets tumbled down to
test mentioned support level of 16000 - 4850. A
minor recovery during the second half of the session
led indices to close just above 4900 mark. On the
sectoral front, Oil & Gas, Banking and Realty were
among the major losers; whereas Health Care and IT
sectors ended marginally in the positive territory. The
advance to decline ratio was strongly in favor of
declining counters (A=1047 D=1657) (Source
-
Formation
Source: Falcon
The 200-day SMA (Simple Moving Average) and
20-day EMA (Exponential Moving Average) have
now shifted to 16920 / 5100 and 16940 /
5130, respectively.
The ‘20-Week EMA’ is placed at 17100 / 5180
Actionable points:
level.
View
Neutral
Indices have now tested 16430 / 4950 level,
Resistance Level
4957 - 5050
which is the 61.8 % Fibonacci Retracement level
Support Levels
4850 - 4800
of the rise from
15135
/
4531 (Low on
December 23, 2011) to 18524 / 5630 (High on
February 22, 2012).
Trading strategy:
Yesterday, selling pressure dragged indices
significantly lower to test mentioned support level of
16000 / 4850. Going forward, we reiterate that
considering oversold position of momentum
oscillators on the daily chart, it is not advisable to
create fresh short position at this juncture. However,
loss of momentum or an oversold condition in the
momentum oscillators does not necessarily signal a
price reversal. Hence, only a move beyond yesterday's
high of 16390 / 4957 may provide bounce for the
markets up to 16447 - 16700 / 4976 -5050 levels.
On the downside, 16000 - 15860 / 4850 - 4800
levels are likely to act as decent support for the
markets.
1
Daily Technical Report
May 15, 2012
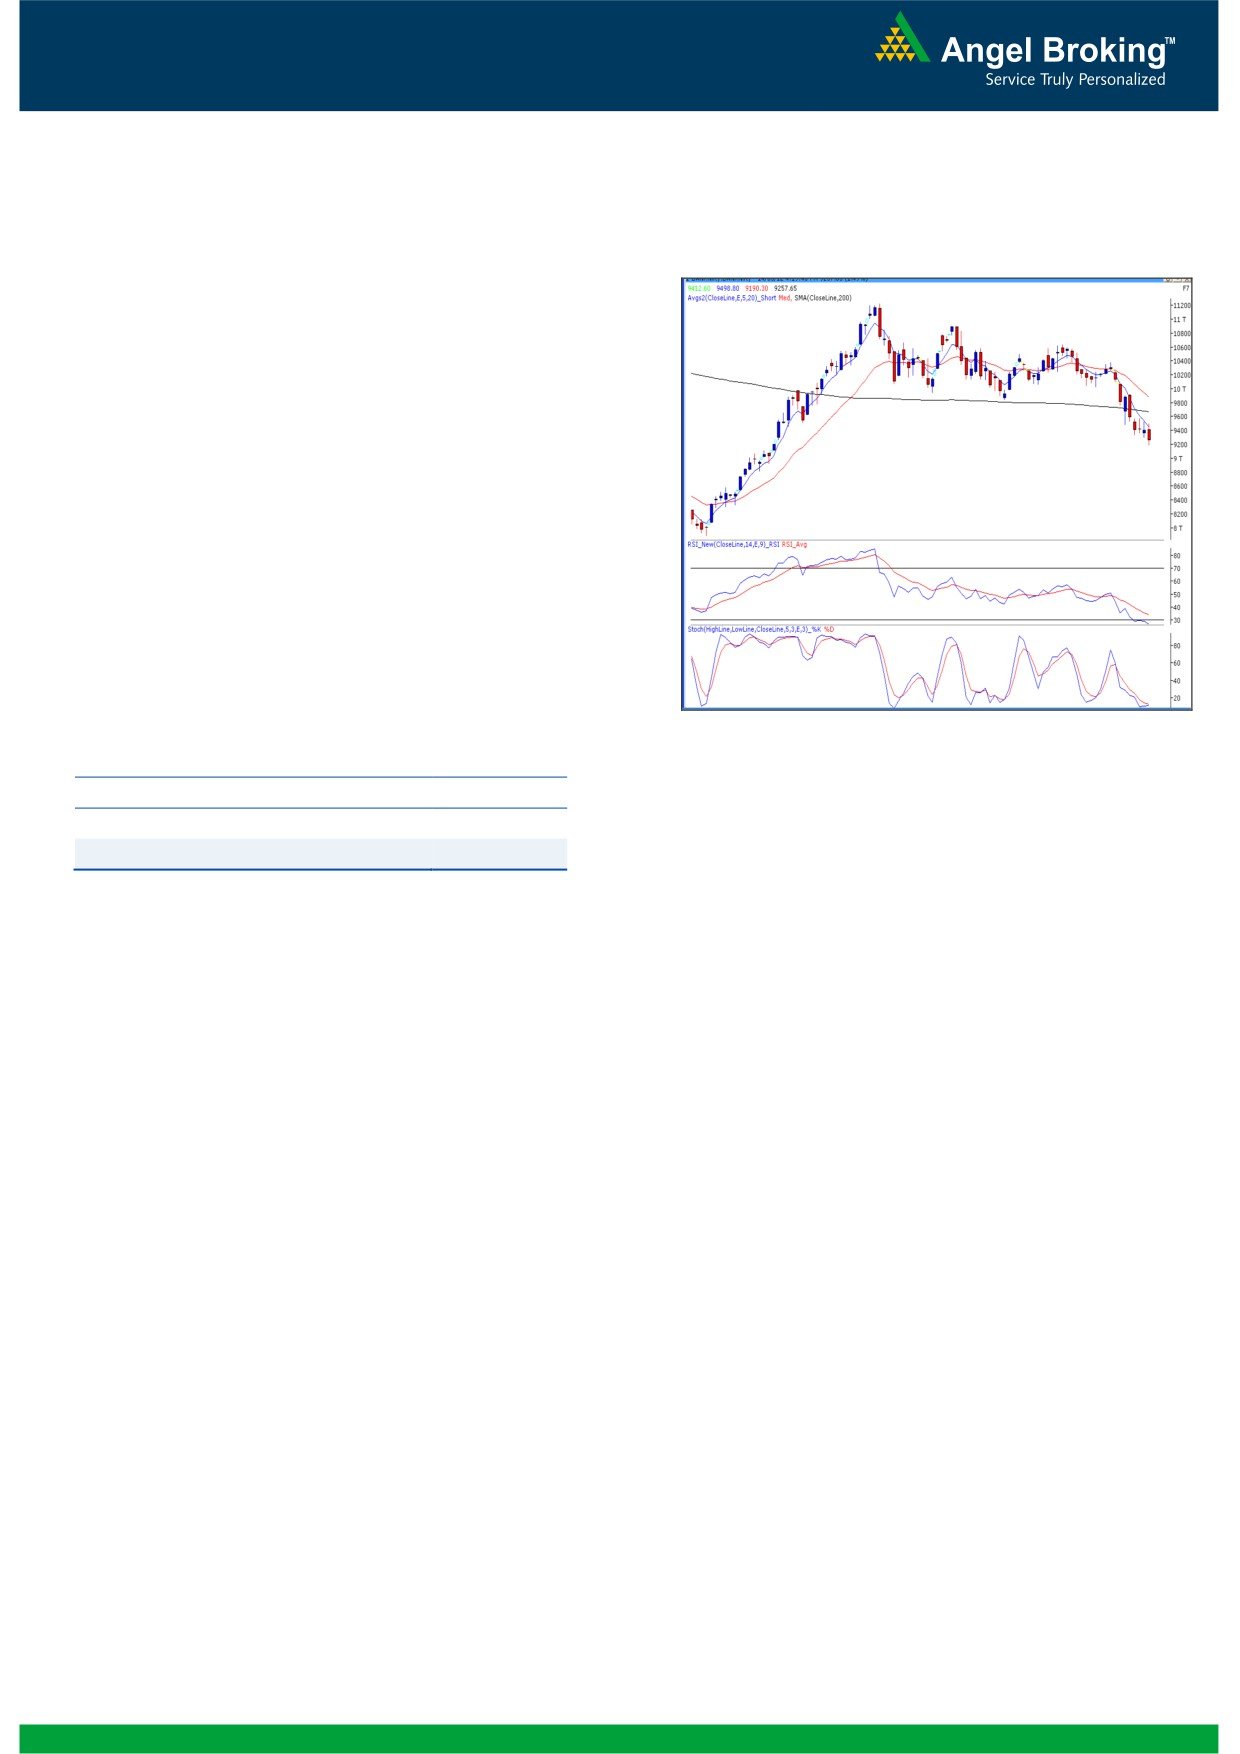
Bank Nifty Outlook - (9258)
Yesterday, Bank Nifty opened on a flat note and
Exhibit 2: Bank Nifty Daily Chart
selling pressure lead the index to test the lower end of
the mentioned range of 9700 - 9200. The “Spinning
Top” candlestick pattern mentioned in our previous
report has been negated as the index managed to
give a close below 9296 level. However, in line with
the benchmark indices the momentum oscillators on
the daily chart continue to remain in an oversold
zone. The “Positive divergence” in momentum
oscillator “RSI” on the hourly chart mentioned in our
previous report is still intact. We reiterate that the
Bank Nifty is likely to trade in the mentioned range of
9200 - 9700. Within the mentioned range, 9380 -
9536 are likely to act as temporary resistance levels.
Only a close below 9200 will signal further weakness
in the index.
Source: Falcon
Actionable points:
View
Neutral
Resistance Levels
9380 - 9536
Support Levels
9200 - 9106
2
Daily Technical Report
May 15, 2012
Research Team Tel: 022 - 39357800
DISCLAIMER
This document is solely for the personal information of the recipient, and must not be singularly used as the basis of any investment
decision. Nothing in this document should be construed as investment or financial advice. Each recipient of this document should make
such investigations as they deem necessary to arrive at an independent evaluation of an investment in the securities of the companies
referred to in this document (including the merits and risks involved), and should consult their own advisors to determine the merits and
risks of such an investment.
Angel Broking Limited, its affiliates, directors, its proprietary trading and investment businesses may, from time to time, make
investment decisions that are inconsistent with or contradictory to the recommendations expressed herein. The views contained in this
document are those of the analyst, and the company may or may not subscribe to all the views expressed within.
Reports based on technical and derivative analysis center on studying charts of a stock's price movement, outstanding positions and
trading volume, as opposed to focusing on a company's fundamentals and, as such, may not match with a report on a company's
fundamentals.
The information in this document has been printed on the basis of publicly available information, internal data and other reliable
sources believed to be true, but we do not represent that it is accurate or complete and it should not be relied on as such, as this
document is for general guidance only. Angel Broking Limited or any of its affiliates/ group companies shall not be in any way
responsible for any loss or damage that may arise to any person from any inadvertent error in the information contained in this report.
Angel Broking Limited has not independently verified all the information contained within this document. Accordingly, we cannot testify,
nor make any representation or warranty, express or implied, to the accuracy, contents or data contained within this document. While
Angel Broking Limited endeavours to update on a reasonable basis the information discussed in this material, there may be regulatory,
compliance, or other reasons that prevent us from doing so.
This document is being supplied to you solely for your information, and its contents, information or data may not be reproduced,
redistributed or passed on, directly or indirectly.
Angel Broking Limited and its affiliates may seek to provide or have engaged in providing corporate finance, investment banking or
other advisory services in a merger or specific transaction to the companies referred to in this report, as on the date of this report or in
the past.
Neither Angel Broking Limited, nor its directors, employees or affiliates shall be liable for any loss or damage that may arise from or in
connection with the use of this information.
Note: Please refer to the important `Stock Holding Disclosure' report on the Angel website (Research Section). Also, please refer to the
latest update on respective stocks for the disclosure status in respect of those stocks. Angel Broking Limited and its affiliates may have
investment positions in the stocks recommended in this report.
Research Team
Shardul Kulkarni
-
Head - Technicals
Sameet Chavan
-
Technical Analyst
Sacchitanand Uttekar
-
Technical Analyst
Mehul Kothari
-
Technical Analyst
Ankur Lakhotia
-
Technical Analyst
Angel Broking Pvt. Ltd.
Registered Office: G-1, Ackruti Trade Centre, Rd. No. 7, MIDC, Andheri (E), Mumbai - 400 093.
Corporate Office: 6th Floor, Ackruti Star, MIDC, Andheri (E), Mumbai - 400 093. Tel: (022) 3952 6600
Sebi Registration No: INB 010996539
4