Daily Technical Report
June 14, 2012
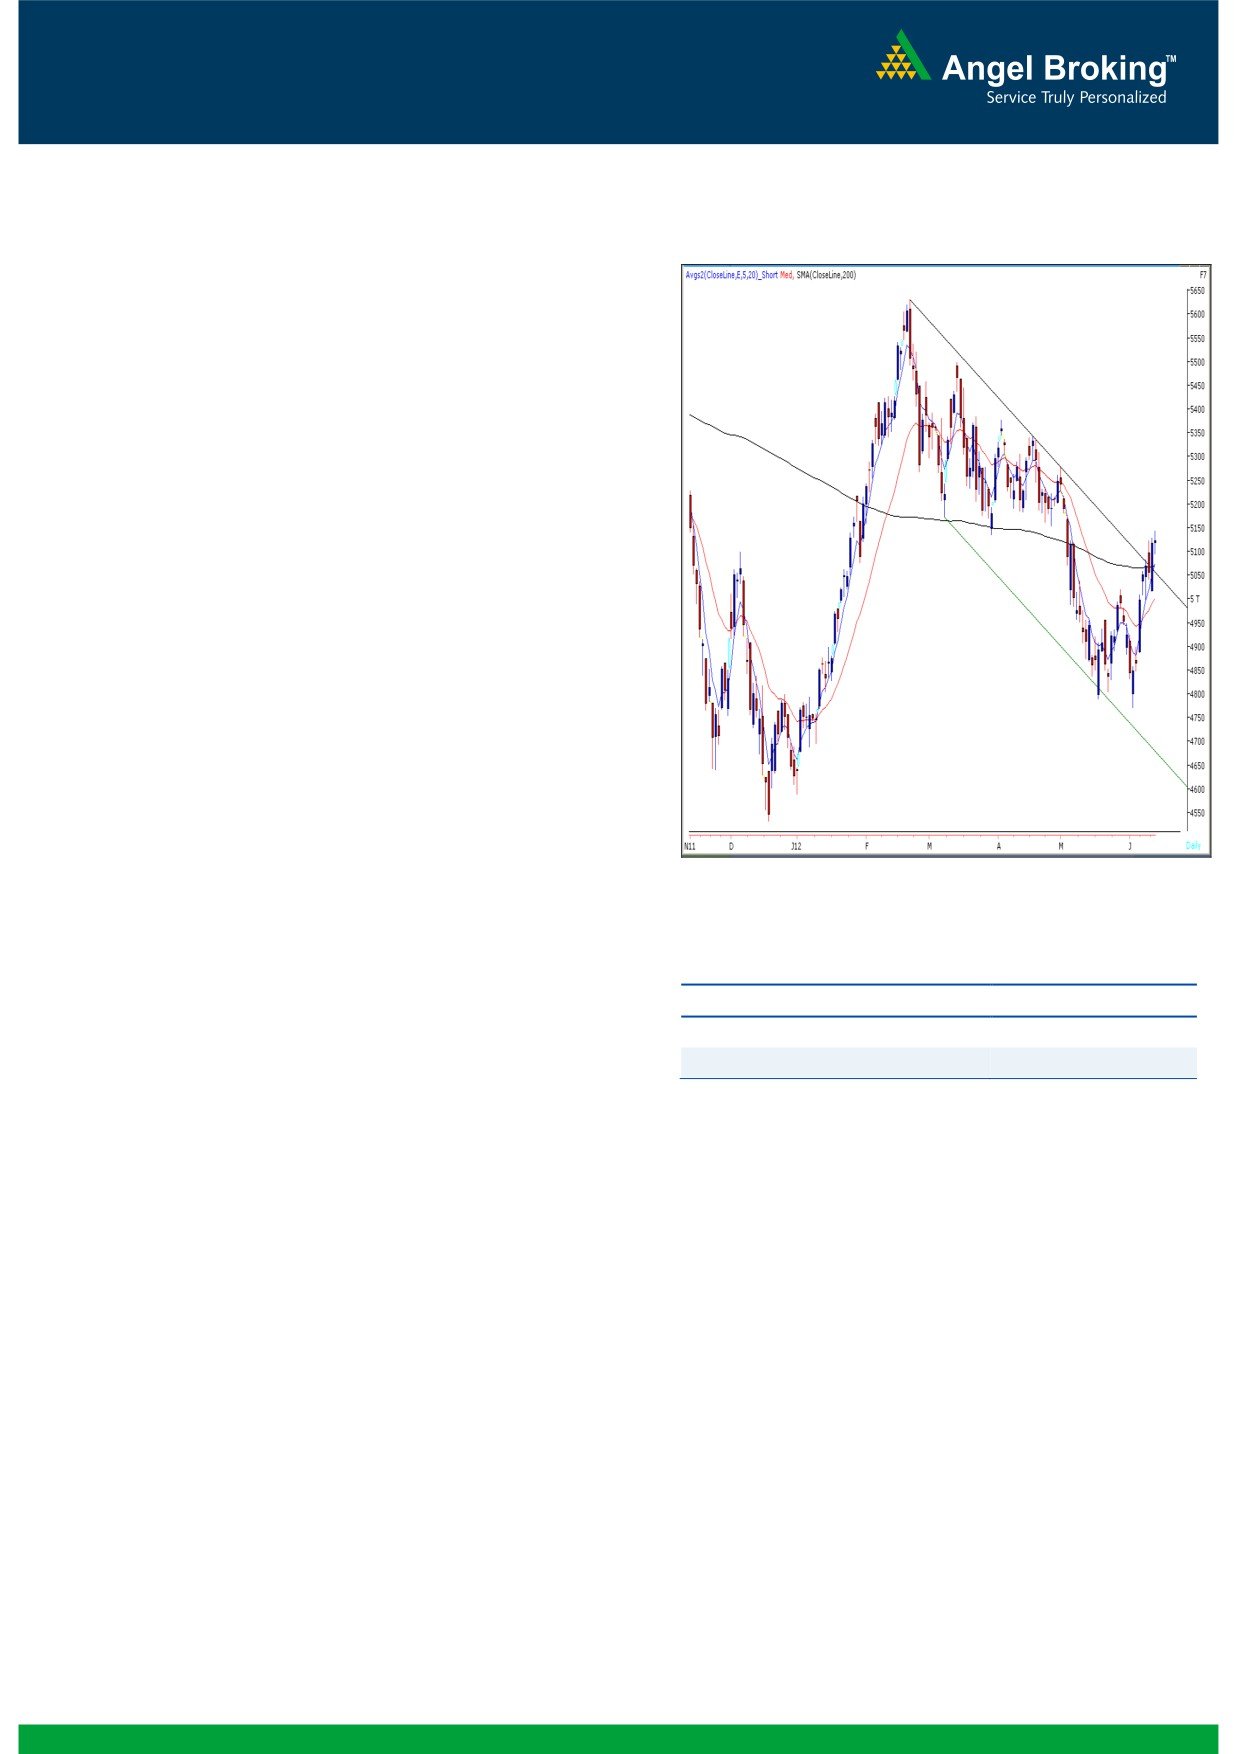
Exhibit 1: Nifty Daily Chart
Sensex (16881) / NIFTY (5121)
Yesterday, our benchmark indices opened on a flat
note in-line with mixed global cues. Further, indices
traded in a narrow range with extreme choppiness to
eventually close near the initial opening level. On
sectoral front, Consumer Goods, FMCG and
Healthcare counters were among the major gainers;
whereas Realty, Auto and Consumer Durables ended
on a losing side. The advance to decline ratio was
marginally in favor of advancing counters (A=1400
Formation
The 200-day SMA (Simple Moving Average) and
20-day EMA (Exponential Moving Average) have
now shifted to 16800 / 5070 and 16380 /
4967, respectively.
The ‘20-Week EMA’ is placed at 16830 / 5100
level.
Indices have taken a support near 15860 /
Source: Falcon
4766 level, which is the
78.6% Fibonacci
Retracement level of the rise from 15135 / 4531
(Low on December 23, 2011) to 18524 / 5630
(High on February 22, 2012).
Actionable points:
View
Bullish above 5145
On the daily chart, indices are trading near the
Resistance Levels
5177 - 5200
upper range of ‘Downward Sloping Channel’
Support Levels
5095 - 5058
drawn by joining two highs of February 22,
2012 - April 19, 2012 and low of March 7,
2012.
We expect the Indices to meet the target of 17400 /
The weekly ‘RSI’ momentum oscillator is
5270 in the next few sessions. The resistance for the
signaling a positive crossover.
day is seen at 17121 / 5177 levels. On the lower
side, 16792 - 16680 / 5095 - 5058 may provide
decent support for the day.
Trading strategy:
Tuesday's sharp bounce was followed by a range
bound session yesterday as indices traded in a narrow
band of about a percent. Going forward, our view
remains unchanged as yesterday's session does not
significantly alter the underlying bullish trend. Hence,
we reiterate that a sustainable move above 16944 / -
5145 would lead to a 'Downward Sloping Channel'
breakout and would result in enhanced buying
interest among market participants.
1
Daily Technical Report
June 14, 2012
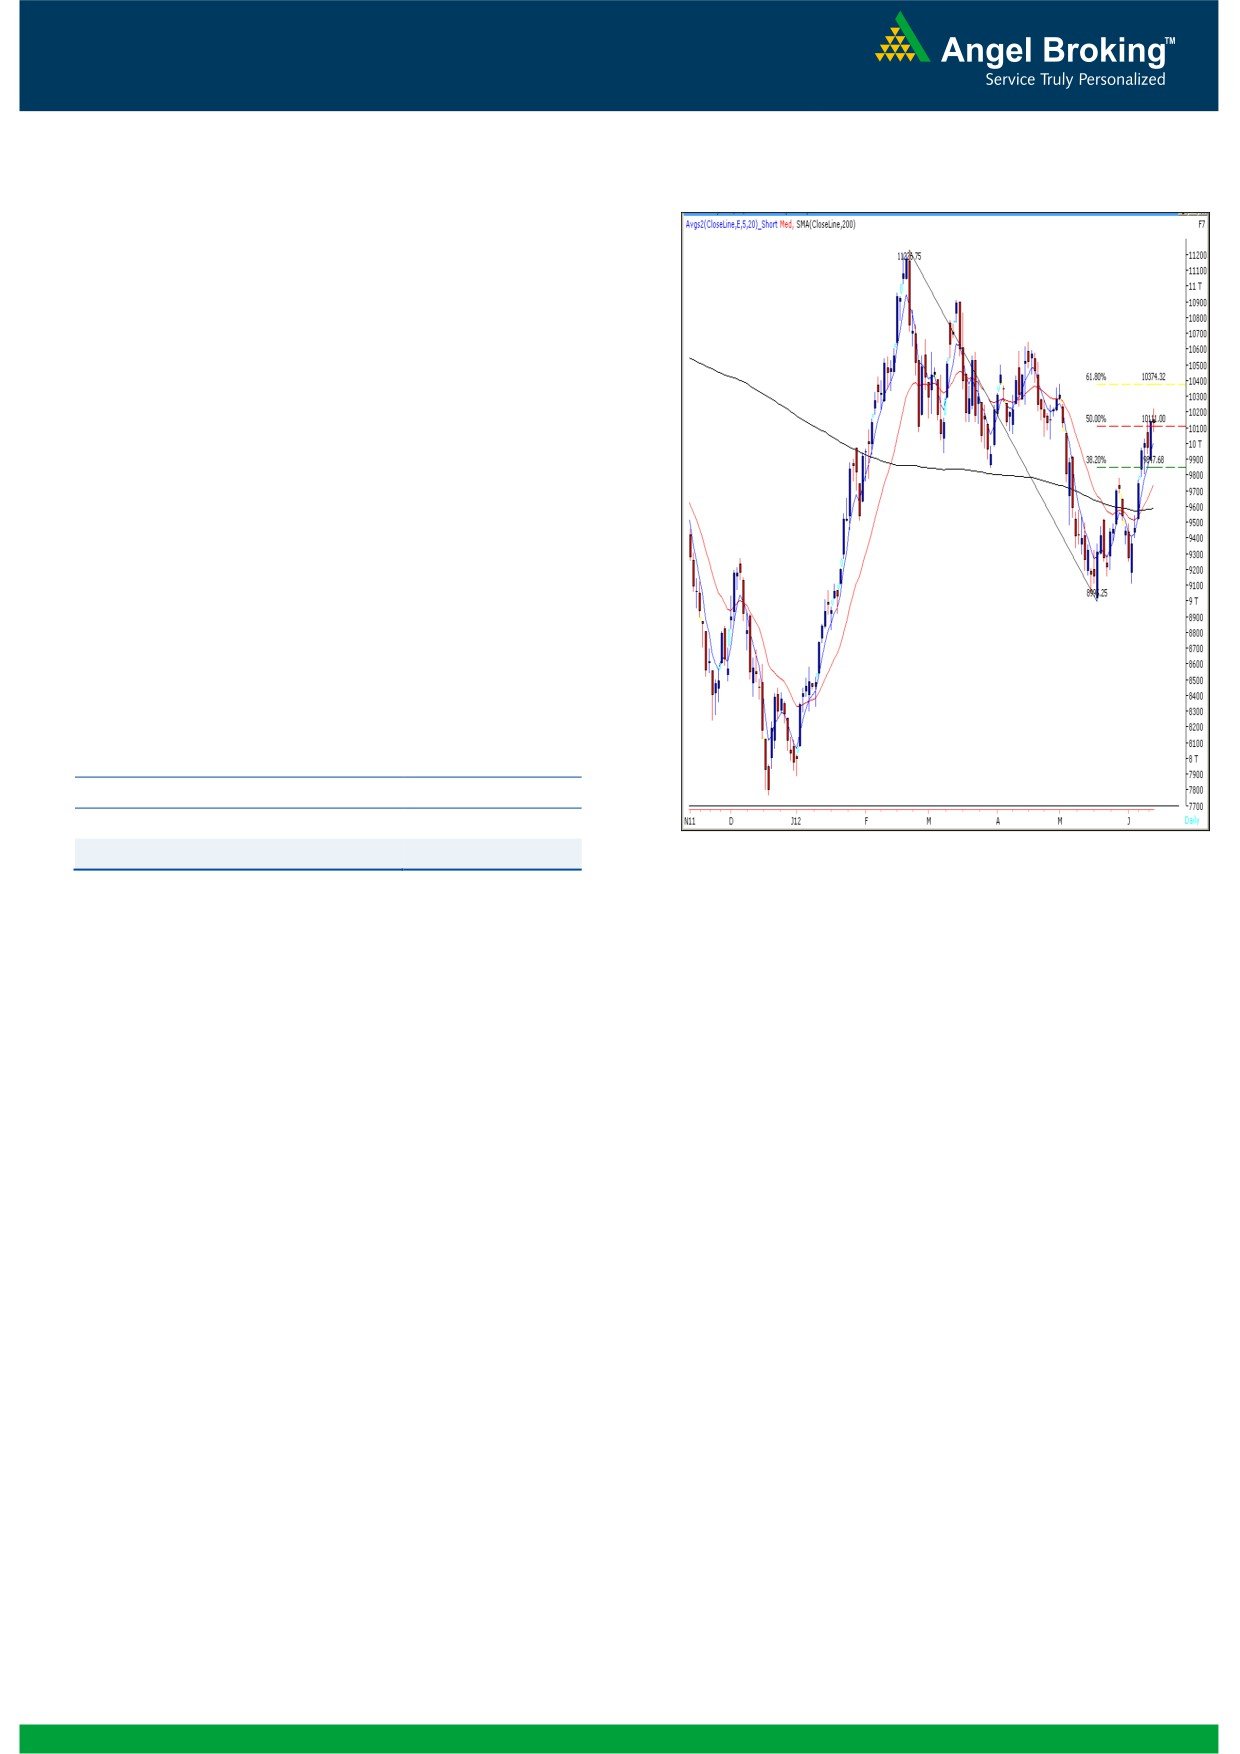
Bank Nifty Outlook - (10128)
Exhibit 2: Bank Nifty Daily Chart
Yesterday, Bank Nifty opened on a flat note and
traded in a narrow range throughout the session. The
index tested the resistance level of 10230 and drifted
lower to close near the initial opening level. The
candlestick formed yesterday is a “Spinning Top” and
indicates indecisiveness
/ consolidation at current
levels. We are now witnessing a negative crossover in
“Stochastic” momentum oscillator on the daily chart
coupled with a negative divergence in “RSI”
momentum oscillator on the hourly chart. These are
early warning signals that indicate that in case the
Bank Nifty sustains below yesterday’s low of 10075,
the Index may lose buying momentum and it is likely
to then drift towards 9898 - 9809 levels. On the
other hand, a move beyond 10230 level would signal
further upside and the Index may then head towards
the swing high of 10380 over the next few sessions.
Actionable points:
View
Bullish Above 10230
Expected Target
10382
Support Levels
10000 - 9893
Source: Falcon
2
Daily Technical Report
June 14, 2012
Daily Pivot Levels for Nifty 50 Stocks
SCRIPS
S2
S1
PIVOT
R1
R2
SENSEX
16,721
16,801
16,872
16,952
17,024
NIFTY
5,071
5,096
5,121
5,146
5,170
BANKNIFTY
9,993
10,061
10,143
10,210
10,292
ACC
1,161
1,170
1,183
1,193
1,205
AMBUJACEM
156
160
162
166
168
ASIANPAINT
3,828
3,853
3,887
3,912
3,946
AXISBANK
1,026
1,035
1,049
1,058
1,072
BAJAJ-AUTO
1,527
1,544
1,561
1,578
1,595
BANKBARODA
706
713
722
729
738
BHARTIARTL
302
305
309
312
316
BHEL
214
218
221
224
227
BPCL
723
728
733
738
743
CAIRN
316
319
321
324
326
CIPLA
300
302
304
306
308
COALINDIA
327
330
336
339
344
DLF
192
194
197
199
202
DRREDDY
1,550
1,559
1,575
1,584
1,600
GAIL
331
334
338
341
345
GRASIM
2,340
2,357
2,376
2,393
2,412
HCLTECH
481
486
490
495
499
HDFC
651
653
657
660
663
HDFCBANK
532
537
545
550
557
HEROMOTOCO
1,909
1,932
1,968
1,990
2,027
HINDALCO
120
121
123
124
126
HINDUNILVR
426
437
443
453
459
ICICIBANK
825
837
847
860
870
IDFC
132
133
135
136
138
INFY
2,420
2,445
2,467
2,493
2,515
ITC
241
243
244
245
246
JINDALSTEL
427
434
439
446
451
JPASSOCIAT
68
69
70
71
72
KOTAKBANK
579
582
588
591
597
LT
1,271
1,310
1,341
1,381
1,411
M&M
668
675
683
691
699
MARUTI
1,077
1,092
1,118
1,134
1,160
NTPC
151
153
155
157
160
ONGC
255
262
266
273
276
PNB
799
807
812
820
825
POWERGRID
106
107
108
108
109
RANBAXY
471
476
481
486
491
RELIANCE
706
711
718
723
729
RELINFRA
503
510
520
527
537
SAIL
93
94
95
96
97
SBIN
2,161
2,193
2,219
2,251
2,277
SESAGOA
183
185
188
190
193
SIEMENS
673
685
691
703
709
STER
98
100
102
104
107
SUNPHARMA
573
583
589
599
605
TATAMOTORS
231
234
239
242
247
TATAPOWER
92
93
95
96
98
TATASTEEL
407
409
413
416
419
TCS
1,234
1,242
1,251
1,259
1,268
WIPRO
391
394
396
399
401
3
Daily Technical Report
June 14, 2012
Research Team Tel: 022 - 39357800
DISCLAIMER
This document is solely for the personal information of the recipient, and must not be singularly used as the basis of any investment
decision. Nothing in this document should be construed as investment or financial advice. Each recipient of this document should make
such investigations as they deem necessary to arrive at an independent evaluation of an investment in the securities of the companies
referred to in this document (including the merits and risks involved), and should consult their own advisors to determine the merits and
risks of such an investment.
Angel Broking Limited, its affiliates, directors, its proprietary trading and investment businesses may, from time to time, make
investment decisions that are inconsistent with or contradictory to the recommendations expressed herein. The views contained in this
document are those of the analyst, and the company may or may not subscribe to all the views expressed within.
Reports based on technical and derivative analysis center on studying charts of a stock's price movement, outstanding positions and
trading volume, as opposed to focusing on a company's fundamentals and, as such, may not match with a report on a company's
fundamentals.
The information in this document has been printed on the basis of publicly available information, internal data and other reliable
sources believed to be true, but we do not represent that it is accurate or complete and it should not be relied on as such, as this
document is for general guidance only. Angel Broking Limited or any of its affiliates/ group companies shall not be in any way
responsible for any loss or damage that may arise to any person from any inadvertent error in the information contained in this report.
Angel Broking Limited has not independently verified all the information contained within this document. Accordingly, we cannot testify,
nor make any representation or warranty, express or implied, to the accuracy, contents or data contained within this document. While
Angel Broking Limited endeavours to update on a reasonable basis the information discussed in this material, there may be regulatory,
compliance, or other reasons that prevent us from doing so.
This document is being supplied to you solely for your information, and its contents, information or data may not be reproduced,
redistributed or passed on, directly or indirectly.
Angel Broking Limited and its affiliates may seek to provide or have engaged in providing corporate finance, investment banking or
other advisory services in a merger or specific transaction to the companies referred to in this report, as on the date of this report or in
the past.
Neither Angel Broking Limited, nor its directors, employees or affiliates shall be liable for any loss or damage that may arise from or in
connection with the use of this information.
Note: Please refer to the important `Stock Holding Disclosure' report on the Angel website (Research Section). Also, please refer to the
latest update on respective stocks for the disclosure status in respect of those stocks. Angel Broking Limited and its affiliates may have
investment positions in the stocks recommended in this report.
Research Team
Shardul Kulkarni
-
Head - Technicals
Sameet Chavan
-
Technical Analyst
Sacchitanand Uttekar
-
Technical Analyst
Mehul Kothari
-
Technical Analyst
Ankur Lakhotia
-
Technical Analyst
Angel Broking Pvt. Ltd.
Registered Office: G-1, Ackruti Trade Centre, Rd. No. 7, MIDC, Andheri (E), Mumbai - 400 093.
Corporate Office: 6th Floor, Ackruti Star, MIDC, Andheri (E), Mumbai - 400 093. Tel: (022) 3952 6600
Sebi Registration No: INB 010996539
4