Daily Technical Report
May 14, 2012
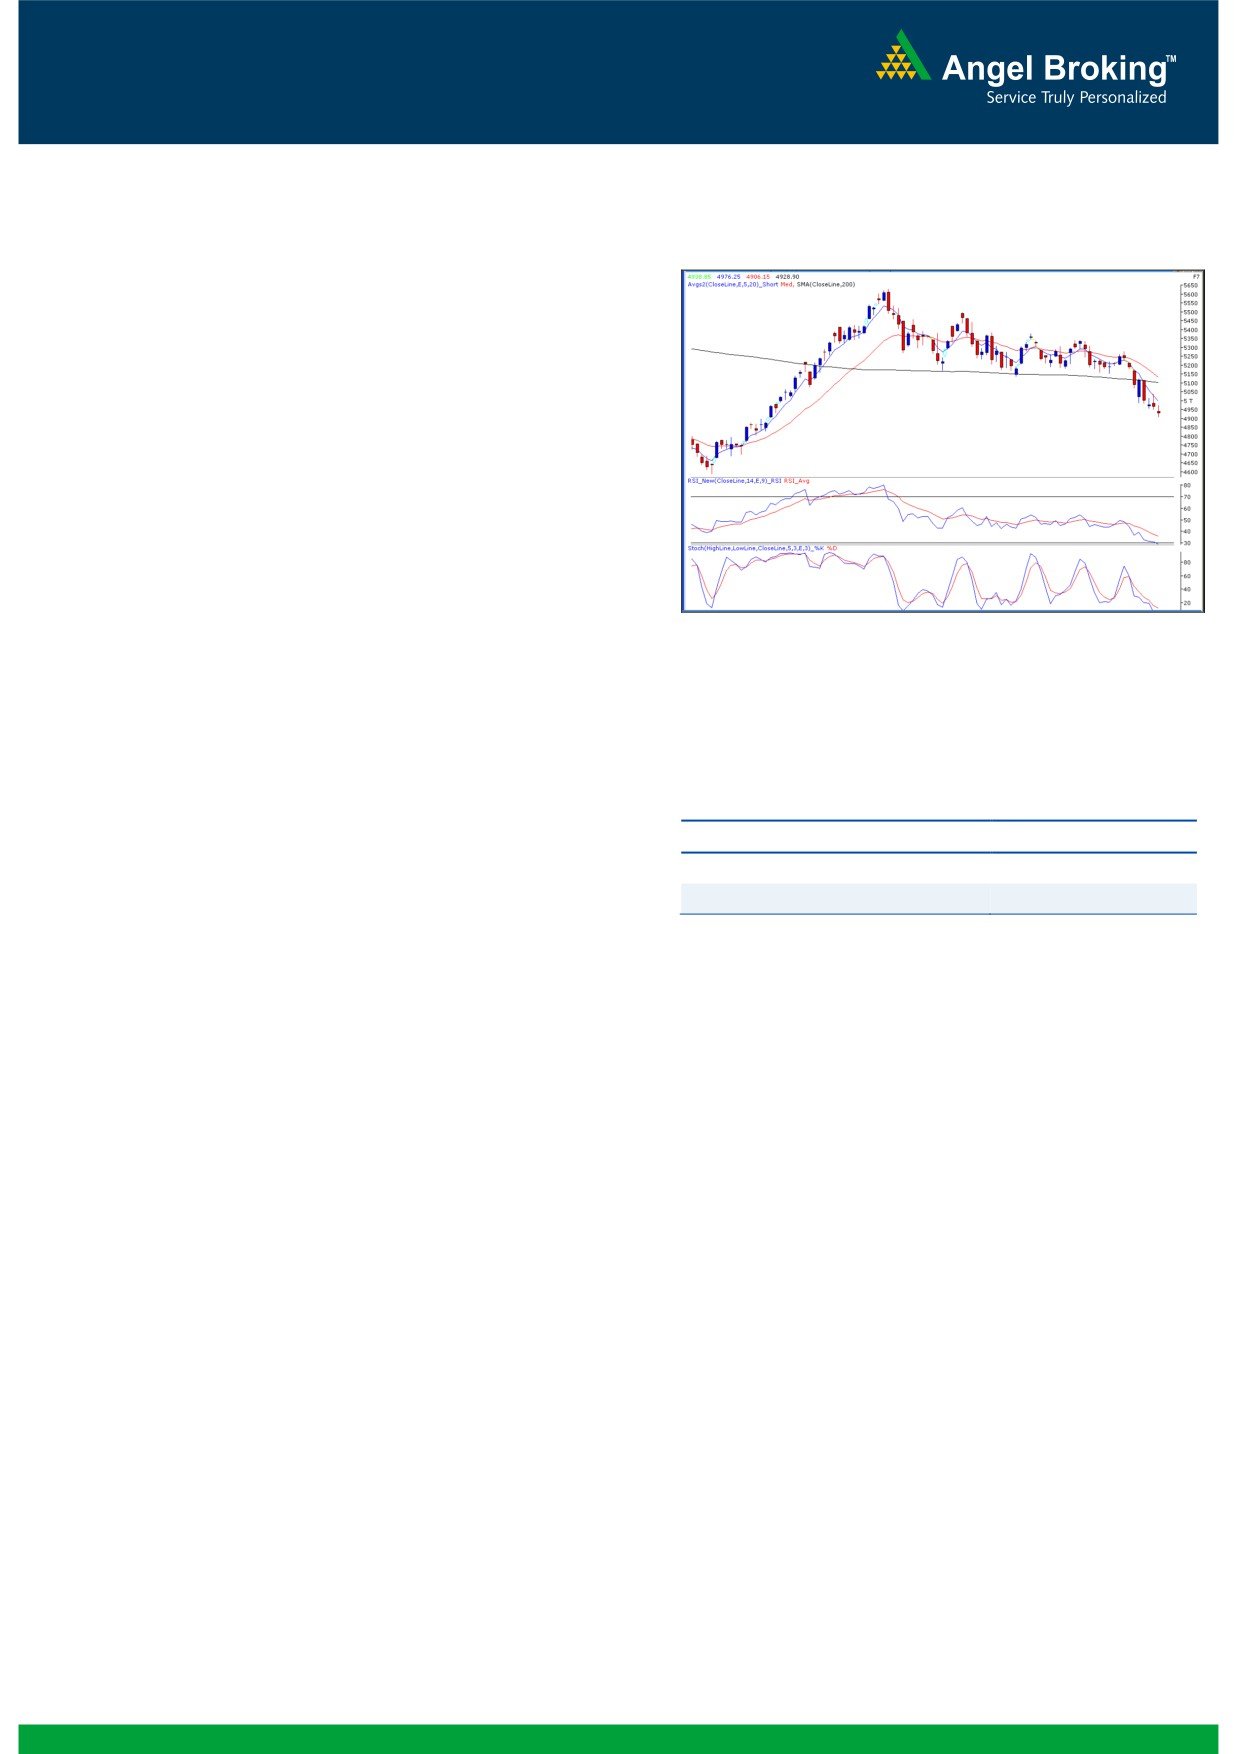
Sensex (16293) / NIFTY (4929)
Exhibit 1: Nifty Daily Chart
On Friday, we witnessed a gap down opening in-line
with negative global cues. Subsequently indices
bounced sharply towards the hourly ‘20 EMA’, but a
sharp fall in the closing hour of the session led indices
to close below 4950 mark. On the sectoral front,
Health Care, Power and FMCG counters were among
the major losers; whereas Auto and Banking sectors
ended marginally in the positive territory. The
advance to decline ratio was strongly in favor of
declining counters (A=981 D=1772) (Source
-
Source: Falcon
Formation
The 200-day SMA (Simple Moving Average) and
20-day EMA (Exponential Moving Average) have
now shifted to 16920 / 5100 and 16940 /
5130, respectively.
Actionable points:
The ‘20-Week EMA’ is placed at 17100 / 5180
View
Neutral
level.
Resistance Level
4976 - 5050
Indices have now tested 16430 / 4950 level,
Support Levels
4906 - 4850
which is the 61.8 % Fibonacci Retracement level
of the rise from
15135
/
4531 (Low on
December 23, 2011) to 18524 / 5630 (High on
February 22, 2012).
However, we must also take into consideration
Trading strategy:
that the oversold indication of momentum
oscillators signals loss of momentum and does
On the back of few negative domestic as well as
not necessarily indicate a reversal. Hence, only
global inflows, we witnessed a sharp correction during
if indices sustain above Friday’s high of 16447
the week after a decent bounce on Monday’s session.
/ 4976, we may witness a bounce up to 16700
Indices tested the mentioned support levels of 16430
- 16840 /5050 - 5090 levels. A violation of
/ 4950 and have closed just below this level. This
Friday’s low
(16233
/
4906) would clearly
support level coincides with the
61.8% Fibonacci
increase the chances of a further fall and, as a
Retracement level of the rise from 15135 / 4531 (Low
result, indices may slide towards
16000
-
on December 23, 2011) to 18524 / 5630 (High on
15860 / 4850 - 4800 levels. We are of the
February 22, 2012). We are now observing a series
opinion that traders who intend to trade with a
of ‘Narrow Range’ body formations on the daily chart.
positive bias should enter the market only if
This indicates uncertainty among the market
indices sustain and close above the weekly high
participants and signals probable exhaustion of a
of 16945 / 5125.
current negative momentum. Momentum oscillators
on the daily chart are placed well inside the oversold
territory.
1
Daily Technical Report
May 14, 2012
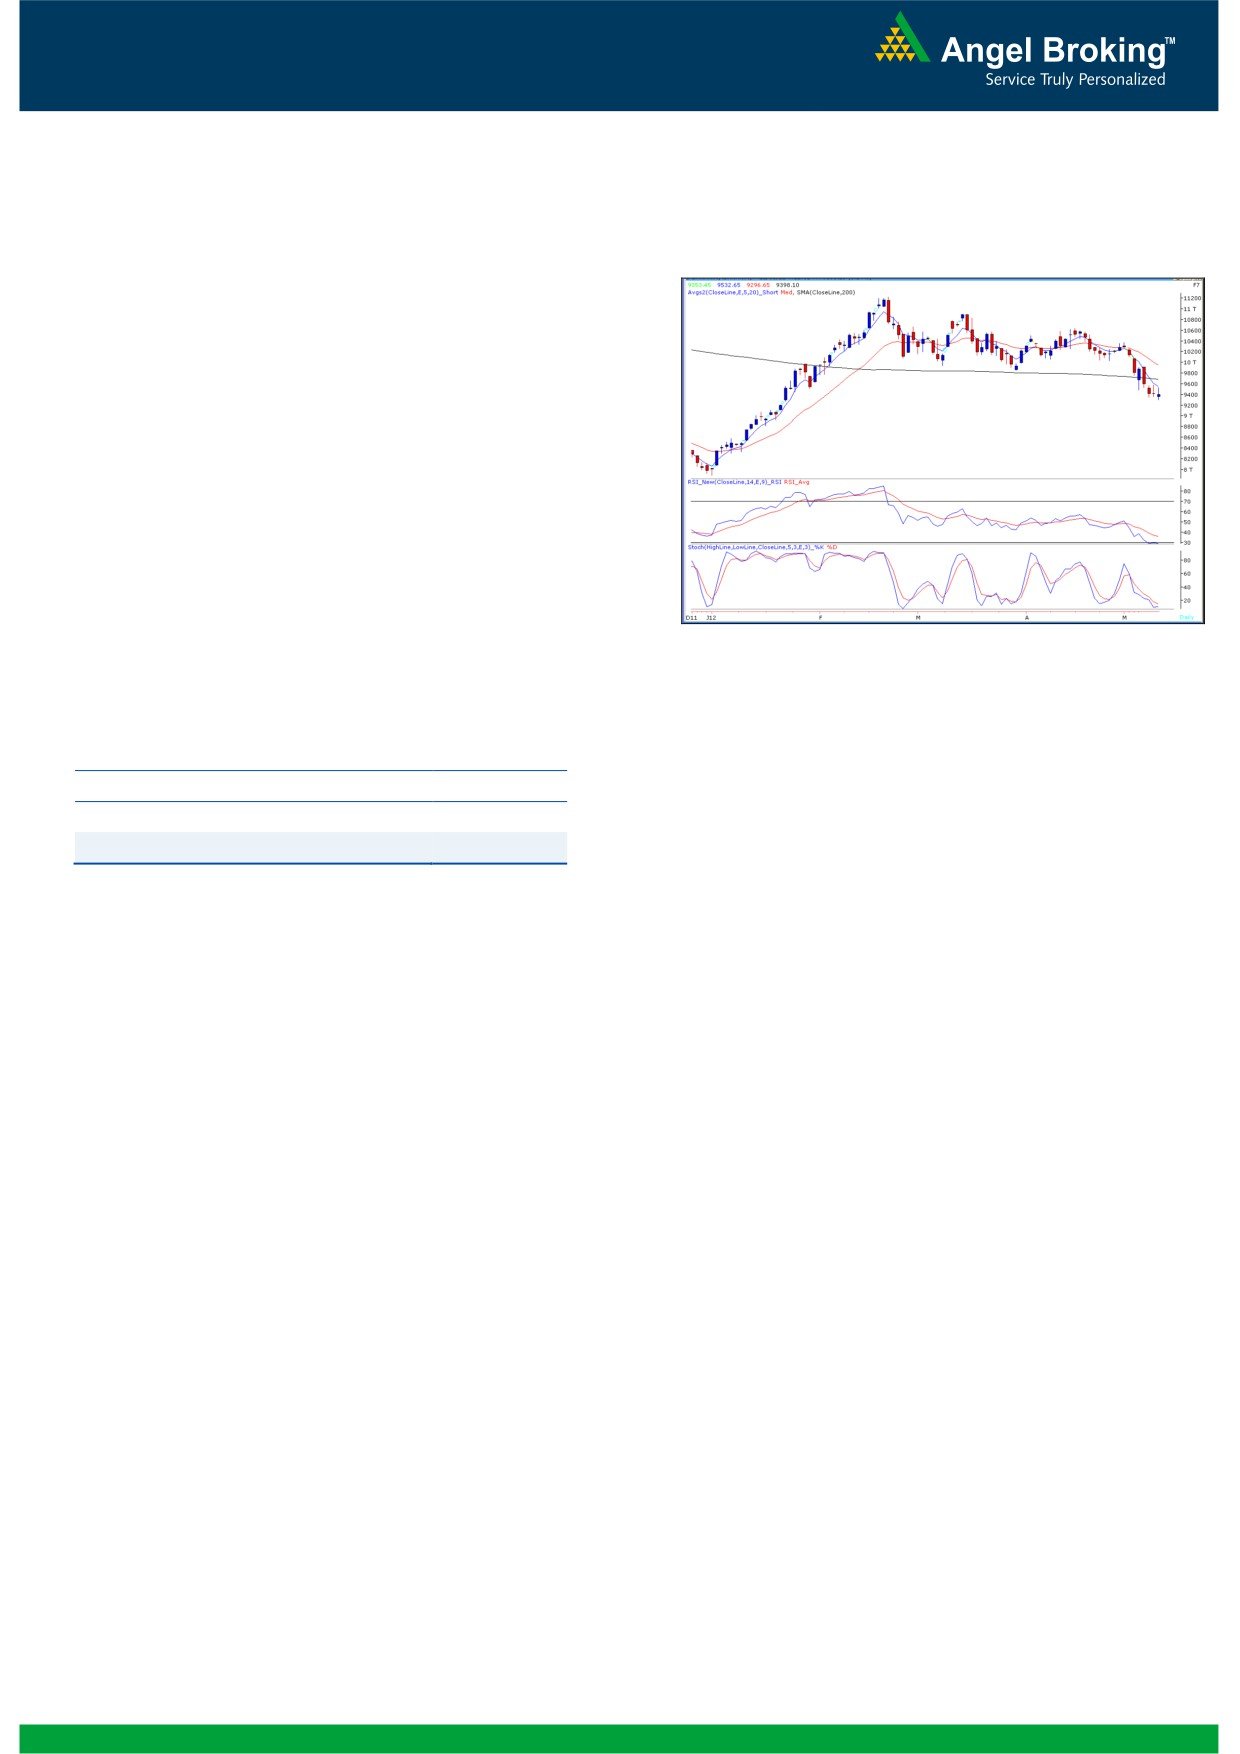
Bank Nifty Outlook - (9398)
On Friday, Bank Nifty opened on a pessimistic note
Exhibit 2: Bank Nifty Daily Chart
and found support near our mentioned support level
of 9270. We are now witnessing a “Spinning top”
candlestick pattern. The mentioned candlestick stick
pattern is formed after a “Doji” candlestick formed
during Thursday’s session. Both the patterns suggest
possibility of a minor pullback or consolidation in the
ongoing downtrend. Moreover the momentum
oscillators on the daily chart are in an oversold
condition. We are also witnessing “Positive
divergence” in momentum oscillator “RSI” on the
hourly chart. Going forward, for the coming week, we
expect the index to trade in the range of 9200 -
9700. Within the mentioned range, 9536 - 9610
Source: Falcon
levels are likely to act as intermediate resistances and
9296 - 9232 levels are likely to act as support in
coming trading session.
Actionable points:
View
Neutral
Resistance Levels
9536 - 9610
Support Levels
9296 - 9232
2
Daily Technical Report
May 14, 2012
Daily Pivot Levels for Nifty 50 Stocks
SCRIPS
S2
S1
PIVOT
R1
R2
SENSEX
16,111
16,202
16,325
16,416
16,538
NIFTY
4,867
4,898
4,937
4,968
5,007
BANKNIFTY
9,173
9,286
9,409
9,522
9,645
ACC
1,126
1,146
1,175
1,195
1,223
AMBUJACEM
139
141
144
146
149
ASIANPAINT
3,536
3,580
3,627
3,671
3,718
AXISBANK
950
975
992
1,017
1,034
BAJAJ-AUTO
1,457
1,507
1,537
1,587
1,617
BANKBARODA
625
637
647
659
669
BHARTIARTL
302
305
309
311
315
BHEL
213
217
221
225
229
BPCL
679
690
702
712
724
CAIRN
308
313
320
324
331
CIPLA
307
313
322
328
337
COALINDIA
308
311
316
320
325
DLF
177
182
186
192
196
DRREDDY
1,603
1,632
1,673
1,702
1,744
GAIL
310
314
319
324
329
GRASIM
2,299
2,345
2,418
2,464
2,537
HCLTECH
481
485
488
492
495
HDFC
639
642
648
652
658
HDFCBANK
501
506
513
518
525
HEROMOTOCO
1,810
1,827
1,852
1,869
1,895
HINDALCO
110
111
114
116
119
HINDUNILVR
429
431
433
434
436
ICICIBANK
794
804
813
823
833
IDFC
114
117
120
124
126
INFY
2,253
2,282
2,321
2,350
2,389
ITC
228
231
235
238
241
JINDALSTEL
435
446
457
468
479
JPASSOCIAT
58
60
62
64
66
KOTAKBANK
521
531
542
553
564
LT
1,100
1,119
1,143
1,161
1,185
M&M
633
644
653
664
673
MARUTI
1,200
1,218
1,235
1,252
1,269
NTPC
144
146
148
151
153
ONGC
249
251
255
257
261
PNB
722
733
747
758
772
POWERGRID
99
100
102
103
104
RANBAXY
453
466
482
495
511
RELIANCE
681
689
696
704
711
RELINFRA
454
463
474
483
494
SAIL
86
88
89
91
93
SBIN
1,789
1,821
1,853
1,885
1,917
SESAGOA
169
174
177
182
185
SIEMENS
691
700
710
719
729
STER
92
93
95
97
98
SUNPHARMA
549
560
577
588
606
TATAMOTORS
282
290
296
304
310
TATAPOWER
87
90
94
97
100
TATASTEEL
403
407
414
418
425
TCS
1,214
1,222
1,230
1,238
1,245
WIPRO
389
395
403
409
418
3
Daily Technical Report
May 14, 2012
Research Team Tel: 022 - 39357800
DISCLAIMER
This document is solely for the personal information of the recipient, and must not be singularly used as the basis of any investment
decision. Nothing in this document should be construed as investment or financial advice. Each recipient of this document should make
such investigations as they deem necessary to arrive at an independent evaluation of an investment in the securities of the companies
referred to in this document (including the merits and risks involved), and should consult their own advisors to determine the merits and
risks of such an investment.
Angel Broking Limited, its affiliates, directors, its proprietary trading and investment businesses may, from time to time, make
investment decisions that are inconsistent with or contradictory to the recommendations expressed herein. The views contained in this
document are those of the analyst, and the company may or may not subscribe to all the views expressed within.
Reports based on technical and derivative analysis center on studying charts of a stock's price movement, outstanding positions and
trading volume, as opposed to focusing on a company's fundamentals and, as such, may not match with a report on a company's
fundamentals.
The information in this document has been printed on the basis of publicly available information, internal data and other reliable
sources believed to be true, but we do not represent that it is accurate or complete and it should not be relied on as such, as this
document is for general guidance only. Angel Broking Limited or any of its affiliates/ group companies shall not be in any way
responsible for any loss or damage that may arise to any person from any inadvertent error in the information contained in this report.
Angel Broking Limited has not independently verified all the information contained within this document. Accordingly, we cannot testify,
nor make any representation or warranty, express or implied, to the accuracy, contents or data contained within this document. While
Angel Broking Limited endeavours to update on a reasonable basis the information discussed in this material, there may be regulatory,
compliance, or other reasons that prevent us from doing so.
This document is being supplied to you solely for your information, and its contents, information or data may not be reproduced,
redistributed or passed on, directly or indirectly.
Angel Broking Limited and its affiliates may seek to provide or have engaged in providing corporate finance, investment banking or
other advisory services in a merger or specific transaction to the companies referred to in this report, as on the date of this report or in
the past.
Neither Angel Broking Limited, nor its directors, employees or affiliates shall be liable for any loss or damage that may arise from or in
connection with the use of this information.
Note: Please refer to the important `Stock Holding Disclosure' report on the Angel website (Research Section). Also, please refer to the
latest update on respective stocks for the disclosure status in respect of those stocks. Angel Broking Limited and its affiliates may have
investment positions in the stocks recommended in this report.
Research Team
Shardul Kulkarni
-
Head - Technicals
Sameet Chavan
-
Technical Analyst
Sacchitanand Uttekar
-
Technical Analyst
Mehul Kothari
-
Technical Analyst
Ankur Lakhotia
-
Technical Analyst
Angel Broking Pvt. Ltd.
Registered Office: G-1, Ackruti Trade Centre, Rd. No. 7, MIDC, Andheri (E), Mumbai - 400 093.
Corporate Office: 6th Floor, Ackruti Star, MIDC, Andheri (E), Mumbai - 400 093. Tel: (022) 3952 6600
Sebi Registration No: INB 010996539
4