Technical Research | February 14, 2012
Daily Technical Report
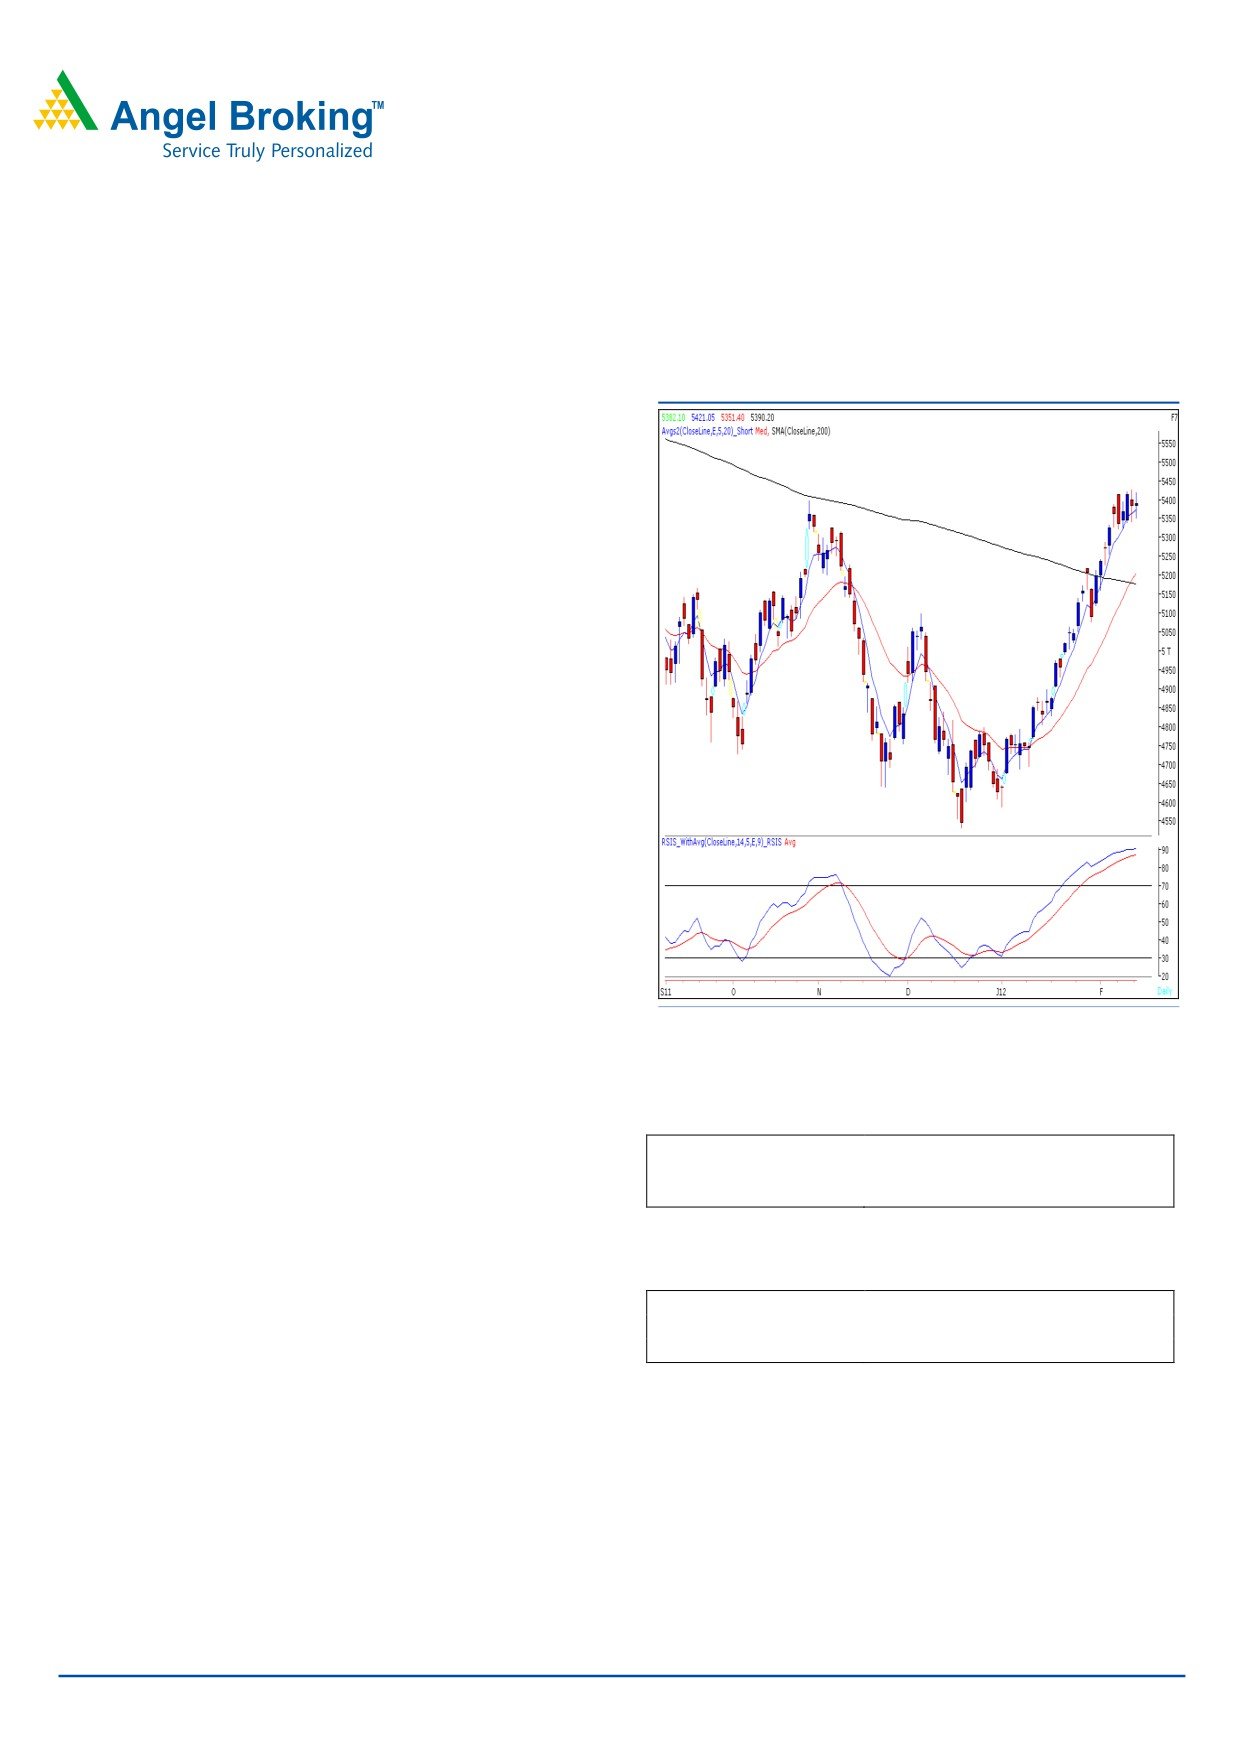
Sensex (17773) / NIFTY (5390)
Exhibit 1: Nifty Daily Chart
Yesterday, for yet another session markets traded with
extreme volatility throughout the day. Indices have been
trading in this narrow range of 17579 - 17890 / 5322 -
5428 for the past six trading sessions. On the sectoral front,
Metal, Auto and Consumer Durables counters were among
the major gainers, whereas Capital Goods and Teck
counters ended in a negative territory. The advance to
decline ratio was marginally in favor of advancing counters.
Formation:
• On the Weekly chart, indices are hovering around the
“Horizontal Resistance Line” placed at 17908 / 5400
level.
• The Weekly chart depicts a “Doji” formation.
• The 200-day SMA and 20-day EMA are placed at
17235 / 5178 and 17160 / 5185, respectively.
• The “RSI-Smoothened” oscillator on the daily chart is
Source: Falcon
placed in extreme overbought territory.
Actionable points:
Trading strategy:
View
Positive Above 5428
After a quiet opening, once again for the sixth consecutive
Expected targets
5552 - 5702
session, indices traded in a narrow range of 17579 -
Support level
5322
17890 / 5322 - 5428. Therefore, we reiterate our view that
a break out on either side would decide next move. On the
Actionable points:
downside, the negative outlook will be confirmed only if
View
Negative Below 5322
indices sustain below the low of 17579 / 5322. In this case,
Expected targets
5250 - 5185
we may witness a corrective move up to 17200 - 17000 /
Resistance level
5428
5250 - 5185 levels, which also coincides with the support
zone of 200-Day SMA and 20-day EMA. Conversely, a
break out above 17890 / 5428 may attract strong buying
interest which would then push indices to test next resistance
zone of 18440 - 18932 / 5552 - 5702.
For Private Circulation Only |
1
Technical Research | February 14, 2012
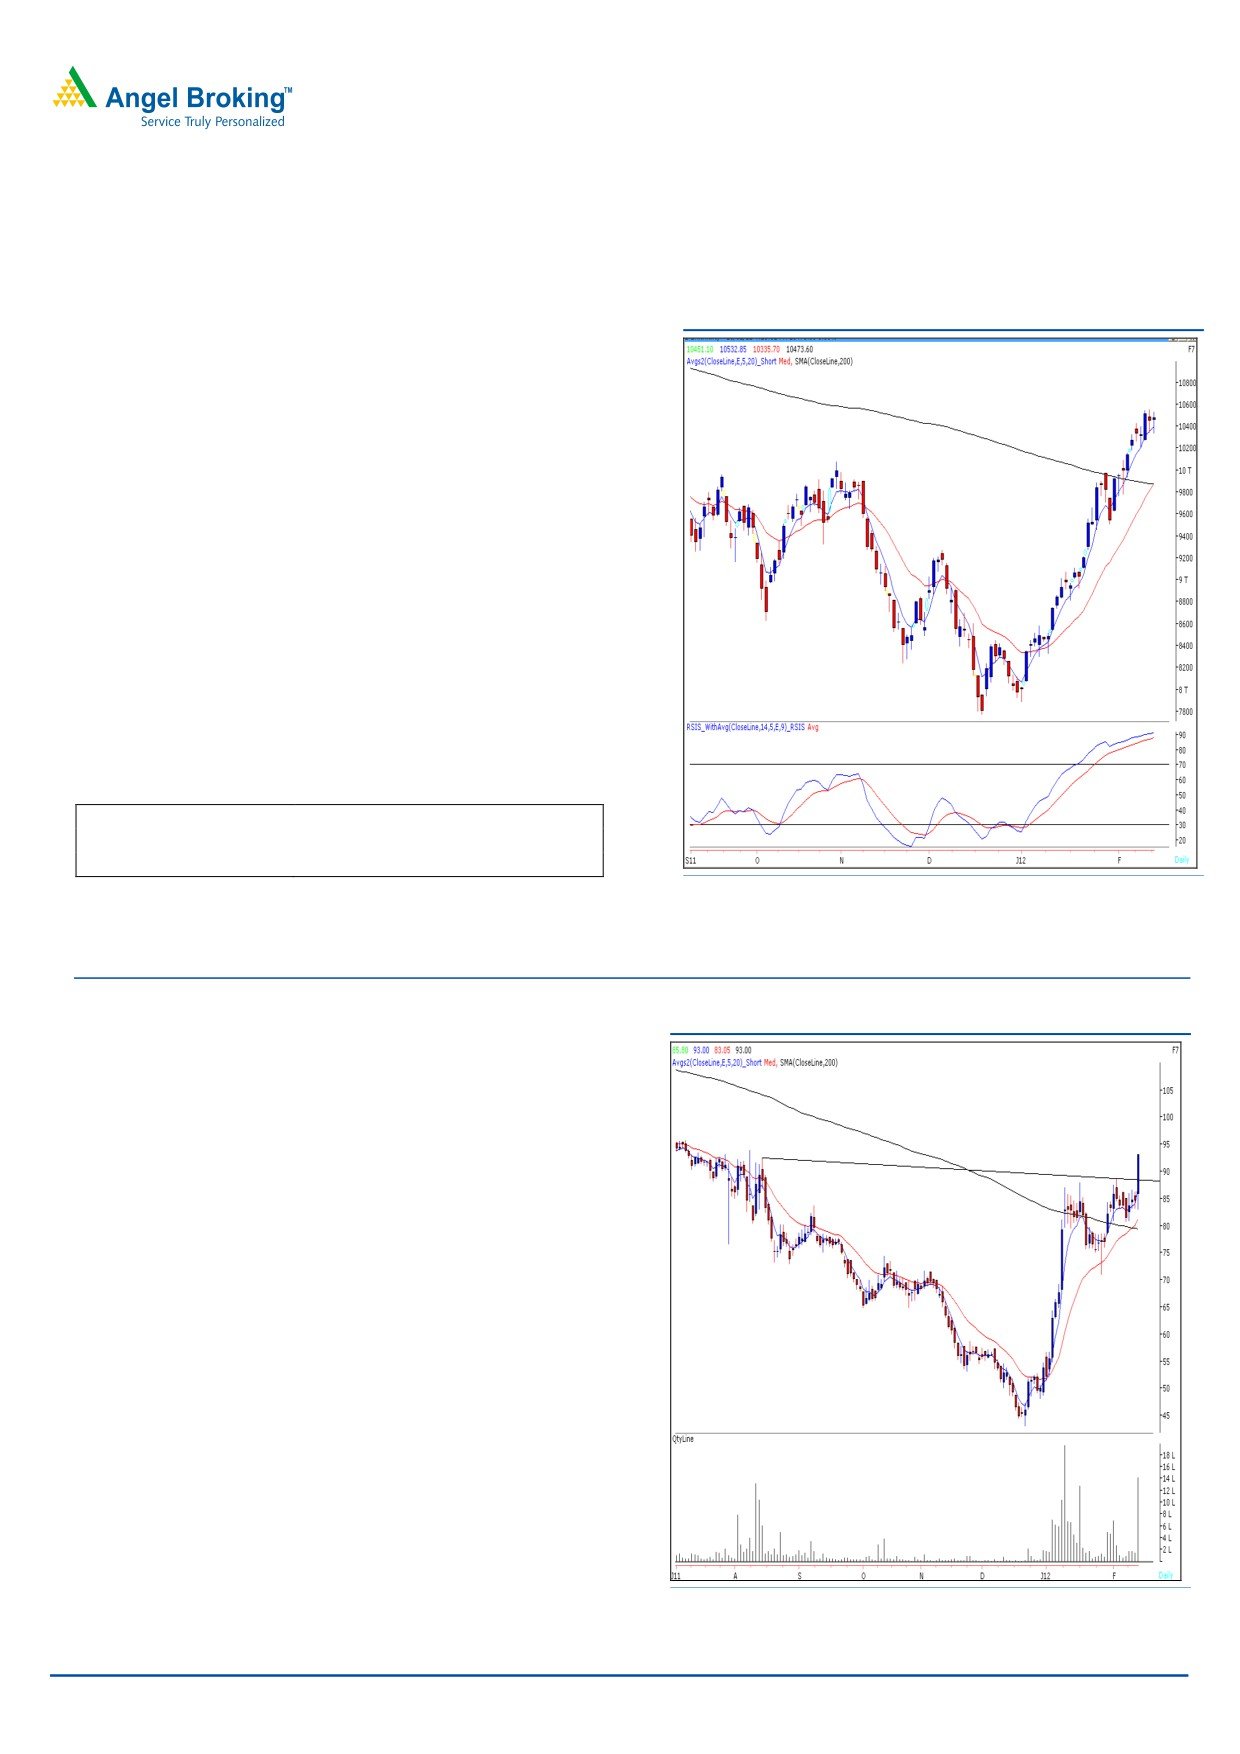
Bank Nifty Outlook - (10474)
Exhibit 2: Bank Nifty Daily Chart
In Yesterday’s trading session, we witnessed high volatility
in case of the Bank Nifty mainly on account of the results
declared by country’s largest bank, State Bank of India.
However, this volatility was within the mentioned range
and no breakout or breakdown is visible on charts. We
are again witnessing a “Doji” candle stick formation in
yesterday’s session. Also, the “Bearish Harami” candle
stick pattern mentioned in our previous report is still
intact. The index has failed to close above 10555 levels.
Therefore, if the index manages to sustain below
yesterday’s low of 10335 then it is likely to drift towards
10183 - 10150 levels. On the upside, 10533 - 10555
levels are likely to act as resistance in coming trading
session.
Actionable points:
View
Negative Below 10335
Expected Target
10183 - 10150
Resistance levels
10533 - 10555
Source: Falcon
Stock Recommendations:
Exhibit 3: NATIONAL FERTISLISERS (NSE CASH)
Stock - NATIONAL FERTILISERS (NSE CASH)
Action - Buy
Last close
- ` 93.00
Buying Range
- ` 93 - 88
Stop Loss
- ` 85.00
Target
- ` 104.00
Justification - The stock has given a trend line breakout at `
88.50 along with humongous volumes on Daily chart.
Further, it is trading convincingly above “200-day SMA”
since past 15 - 20 trading sessions, which shows positivity
in the stock. We are also observing a continue rise in the
value of “ADX (14)” indicator, which is currently placed at
34.83. This indicates strength of the present uptrend. Thus,
buy this stock on declines up to ` 88 for a target of ` 104 in
coming 1-2 weeks.
Source: Falcon
For Private Circulation Only |
2
Technical Research | February 14, 2012
Negative Bias:
Expected
Stock Name
CMP
5 Day EMA
20 Day EMA
Remarks
Target
Shree Renuka
37.1
38.6
36.8
33
View will change above 39.4
For Private Circulation Only |
3
Technical Research | February 14, 2012
Daily Pivot Levels for Nifty 50 Stocks
SCRIPS
S2
S1
PIVOT
R1
R2
SENSEX
17,579
17,676
17,763
17,860
17,947
NIFTY
5,318
5,354
5,388
5,424
5,457
BANKNIFTY
10,250
10,362
10,447
10,559
10,645
ACC
1,317
1,336
1,355
1,374
1,393
AMBUJACEM
166
168
170
172
174
AXISBANK
1,098
1,107
1,118
1,127
1,137
BAJAJ-AUTO
1,719
1,733
1,749
1,763
1,779
BHARTIARTL
339
344
348
352
356
BHEL
256
259
261
264
266
BPCL
577
583
593
599
608
CAIRN
366
369
374
377
383
CIPLA
331
336
345
351
359
DLF
330
333
337
340
344
DRREDDY
213
222
227
236
241
GAIL
1,603
1,615
1,627
1,638
1,650
HCLTECH
381
385
389
392
397
HDFC
461
465
470
474
479
HDFCBANK
690
693
696
699
702
HEROMOTOCO
512
517
521
526
530
HINDALCO
1,942
1,978
1,999
2,034
2,055
HINDUNILVR
148
152
154
158
161
ICICIBANK
384
388
391
395
397
IDFC
906
921
933
947
960
INFY
130
132
134
136
137
ITC
2,739
2,764
2,782
2,807
2,825
JINDALSTEL
201
202
203
204
206
JPASSOCIAT
581
593
604
616
627
KOTAKBANK
75
76
77
79
80
LT
535
551
560
576
586
M&M
1,295
1,312
1,333
1,350
1,371
MARUTI
685
695
702
712
719
NTPC
1,190
1,207
1,233
1,251
1,276
ONGC
178
179
181
182
184
PNB
276
278
282
285
289
POWERGRID
967
981
995
1,009
1,024
RANBAXY
105
107
109
111
113
RCOM
430
435
441
445
452
RELCAPITAL
89
91
93
96
97
RELIANCE
832
841
850
858
867
RELINFRA
552
577
591
616
630
RPOWER
102
104
106
109
111
SAIL
105
107
111
114
118
SBIN
2,051
2,090
2,135
2,175
2,220
SESAGOA
221
233
243
256
266
SIEMENS
768
787
799
818
830
STER
124
127
130
133
136
SUNPHARMA
541
547
553
560
566
SUZLON
26
27
29
30
31
TATAMOTORS
251
254
258
261
265
TATAPOWER
104
106
109
111
113
TATASTEEL
458
472
480
494
503
TCS
1,202
1,214
1,226
1,238
1,250
WIPRO
427
432
440
445
453
Technical Research Team
For Private Circulation Only |
4
Technical Report
RESEARCH TEAM
Shardul Kulkarni
Head - Technicals
Sameet Chavan
Technical Analyst
Sacchitanand Uttekar
Technical Analyst
Mehul Kothari
Technical Analyst
Ankur Lakhotia
Technical Analyst
Research Team: 022-3952 6600
DISCLAIMER: This document is not for public distribution and has been furnished to you solely for your information and must not
be reproduced or redistributed to any other person. Persons into whose possession this document may come are required to observe
these restrictions.
Opinion expressed is our current opinion as of the date appearing on this material only. While we endeavor to update on a
reasonable basis the information discussed in this material, there may be regulatory, compliance, or other reasons that prevent us
from doing so. Prospective investors and others are cautioned that any forward-looking statements are not predictions and may be
subject to change without notice. Our proprietary trading and investment businesses may make investment decisions that are
inconsistent with the recommendations expressed herein.
The information in this document has been printed on the basis of publicly available information, internal data and other reliable
sources believed to be true and are for general guidance only. While every effort is made to ensure the accuracy and completeness of
information contained, the company takes no guarantee and assumes no liability for any errors or omissions of the information. No
one can use the information as the basis for any claim, demand or cause of action.
Recipients of this material should rely on their own investigations and take their own professional advice. Each recipient of this
document should make such investigations as it deems necessary to arrive at an independent evaluation of an investment in the
securities of companies referred to in this document (including the merits and risks involved), and should consult their own advisors to
determine the merits and risks of such an investment. Price and value of the investments referred to in this material may go up or
down. Past performance is not a guide for future performance. Certain transactions - futures, options and other derivatives as well as
non-investment grade securities - involve substantial risks and are not suitable for all investors. Reports based on technical analysis
centers on studying charts of a stock's price movement and trading volume, as opposed to focusing on a company's fundamentals
and as such, may not match with a report on a company's fundamentals.
We do not undertake to advise you as to any change of our views expressed in this document. While we would endeavor to update
the information herein on a reasonable basis, Angel Broking, its subsidiaries and associated companies, their directors and
employees are under no obligation to update or keep the information current. Also there may be regulatory, compliance, or other
reasons that may prevent Angel Broking and affiliates from doing so. Prospective investors and others are cautioned that any
forward-looking statements are not predictions and may be subject to change without notice.
Angel Broking Limited and affiliates, including the analyst who has issued this report, may, on the date of this report, and from time
to time, have long or short positions in, and buy or sell the securities of the companies mentioned herein or engage in any other
transaction involving such securities and earn brokerage or compensation or act as advisor or have other potential conflict of interest
with respect to company/ies mentioned herein or inconsistent with any recommendation and related information and opinions.
Angel Broking Limited and affiliates may seek to provide or have engaged in providing corporate finance, investment banking or
other advisory services in a merger or specific transaction to the companies referred to in this report, as on the date of this report or
in the past.
Sebi Registration No : INB 010996539
For Private Circulation Only |