Technical Research | October 14, 2011
Daily Technical Report
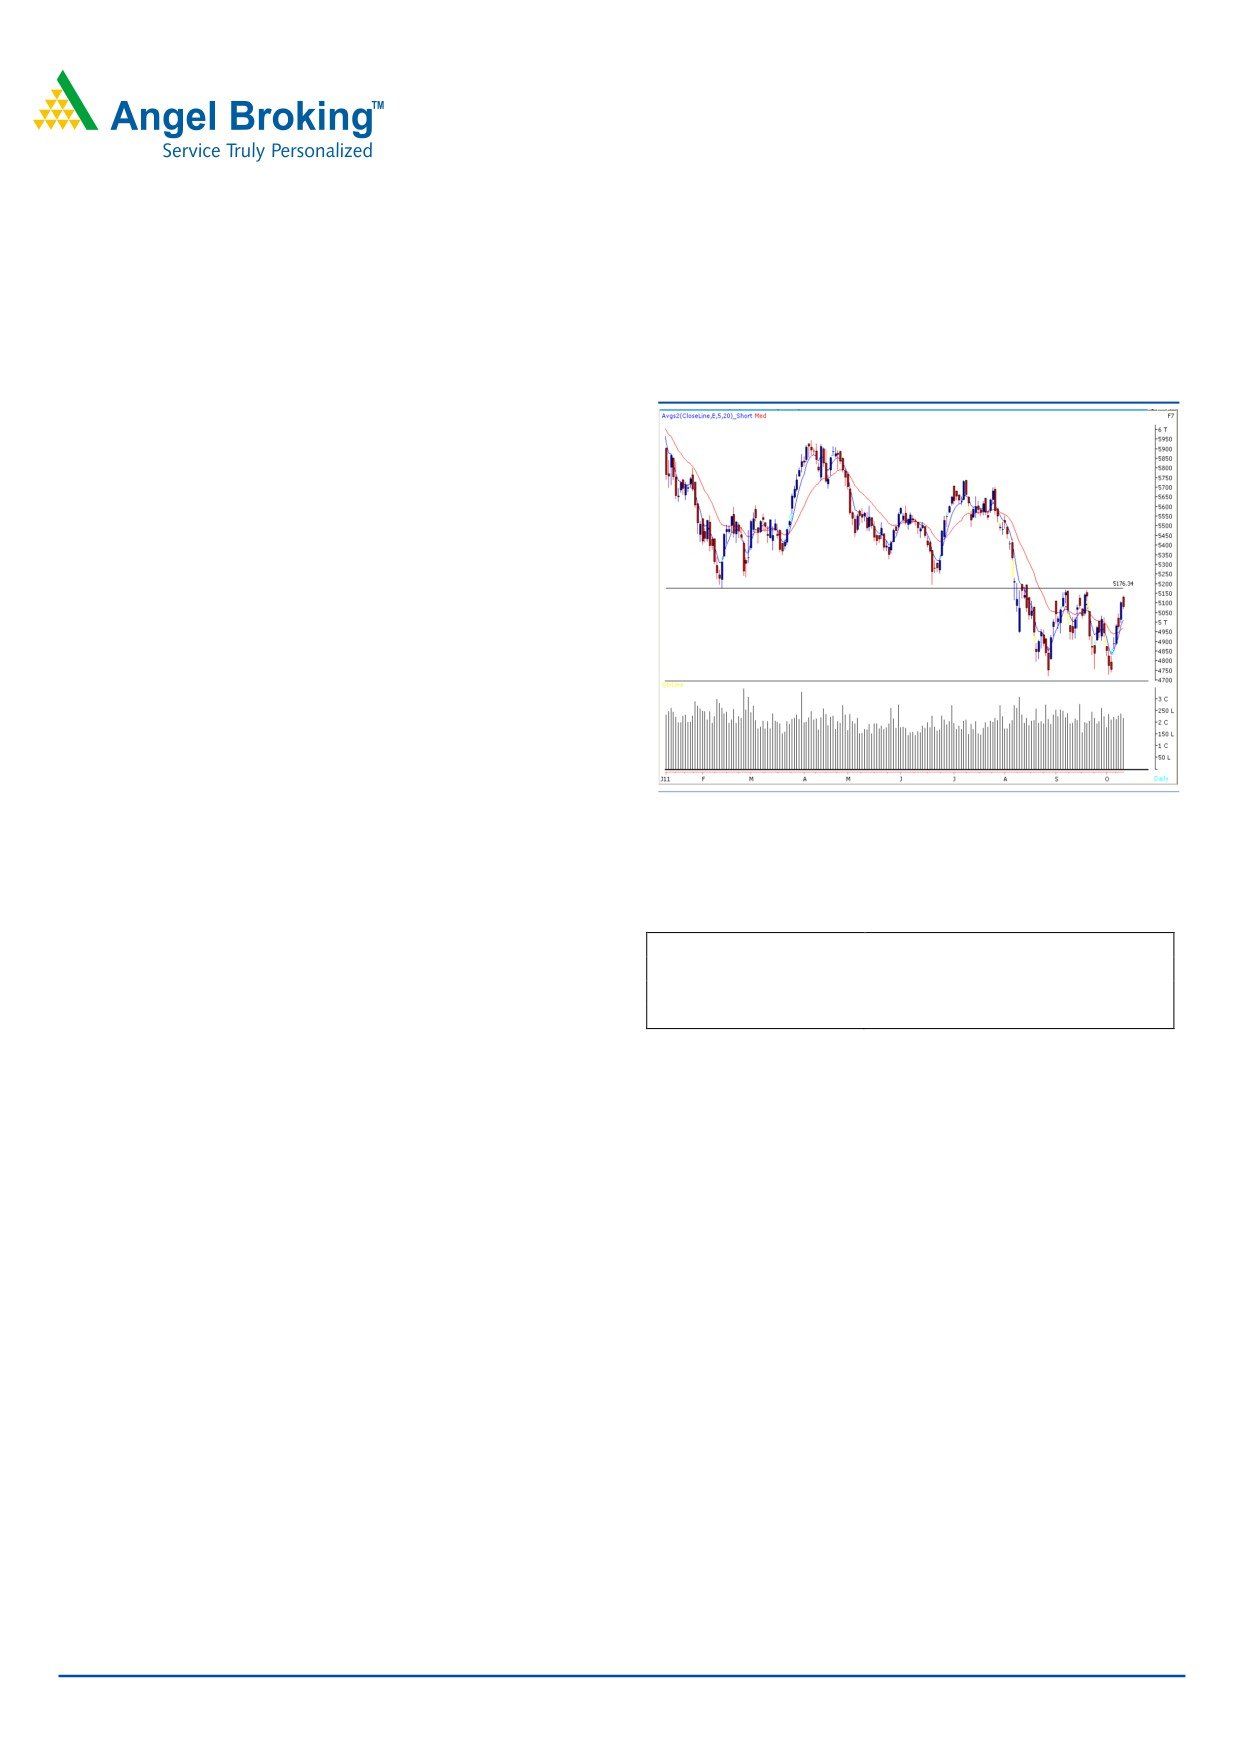
Sensex (16884) / NIFTY (5088)
We witnessed a gap up opening in yesterday’ session, but
Exhibit 1: Nifty Daily Chart
markets failed to sustain at higher levels and pared early
gains to close marginally below Wednesday’s close. On the
sector front, Auto, Capital Goods and Healthcare counters
were among the major losers whereas Banking and IT
ended on a gaining side. The advance decline ratio was in
favor of declining counters (A=1379 D=1403). (Source -
Formation
• On the Daily chart, “Horizontal Trend Line” resistance is
at 17303 / 5177 level.
• We are witnessing a negative crossover of “RSI -
Smoothened” oscillator in hourly chart.
Source: Falcon
Actionable points:
Trading strategy:
Markets are now at the upper end of the broad range of
View
Bearish
5200 to 4700. As mentioned in some of our earlier
Negative Below
5067
reports, the Indices have a strong “Horizontal Trend Line”
Expected Target
5045 - 4964
Resistance Levels
5137 - 5169
resistance at 17300 / 5177 level. Moreover, negative
crossover of “RSI - Smoothened” oscillator in hourly chart
indicates that further downside is likely to continue if indices
sustain below yesterday’s low of
16854
/
5067.
Subsequently, indices may witness selling pressure and are
likely to test 16774 - 16510 / 5045 - 4964 levels. On the
upside, yesterday’s high of 17084 / 5137 may act as
immediate resistance in coming trading session. A move
beyond this level can push indices towards the mentioned
resistance levels at 17210 - 17303 / 5169 - 5177 levels.
For Private Circulation Only |
1
Technical Research | October 14, 2011
Bank Nifty Outlook - (9591)
Exhibit 2: Bank Nifty Daily Chart
Bank Nifty opened with an upside gap and tested the initial
resistance level of 9700. After moving towards this
resistance, Bank Nifty traded in a narrow range throughout
the session to close near the initial opening level. Thus we
are now witnessing a “Bearish Doji Star” Japanese candle
stick pattern on daily chart. To confirm the bearish
implication of the said pattern a breach of the low at 9547 is
necessary. If Bank Nifty falls below yesterday’s low of 9547
then it is likely to test 9400 - 9280 levels. The above
mentioned pattern will be negated only if bank nifty closes
above yesterday’s high of 9685. On the Upside, 9700 level
may act as a resistance for the day.
Actionable points:
Source: Falcon
View
Mildly Bearish
Negative Above
9547
Expected Target
9400 - 9280
Resistance Level
9700
Stock Recommendations:
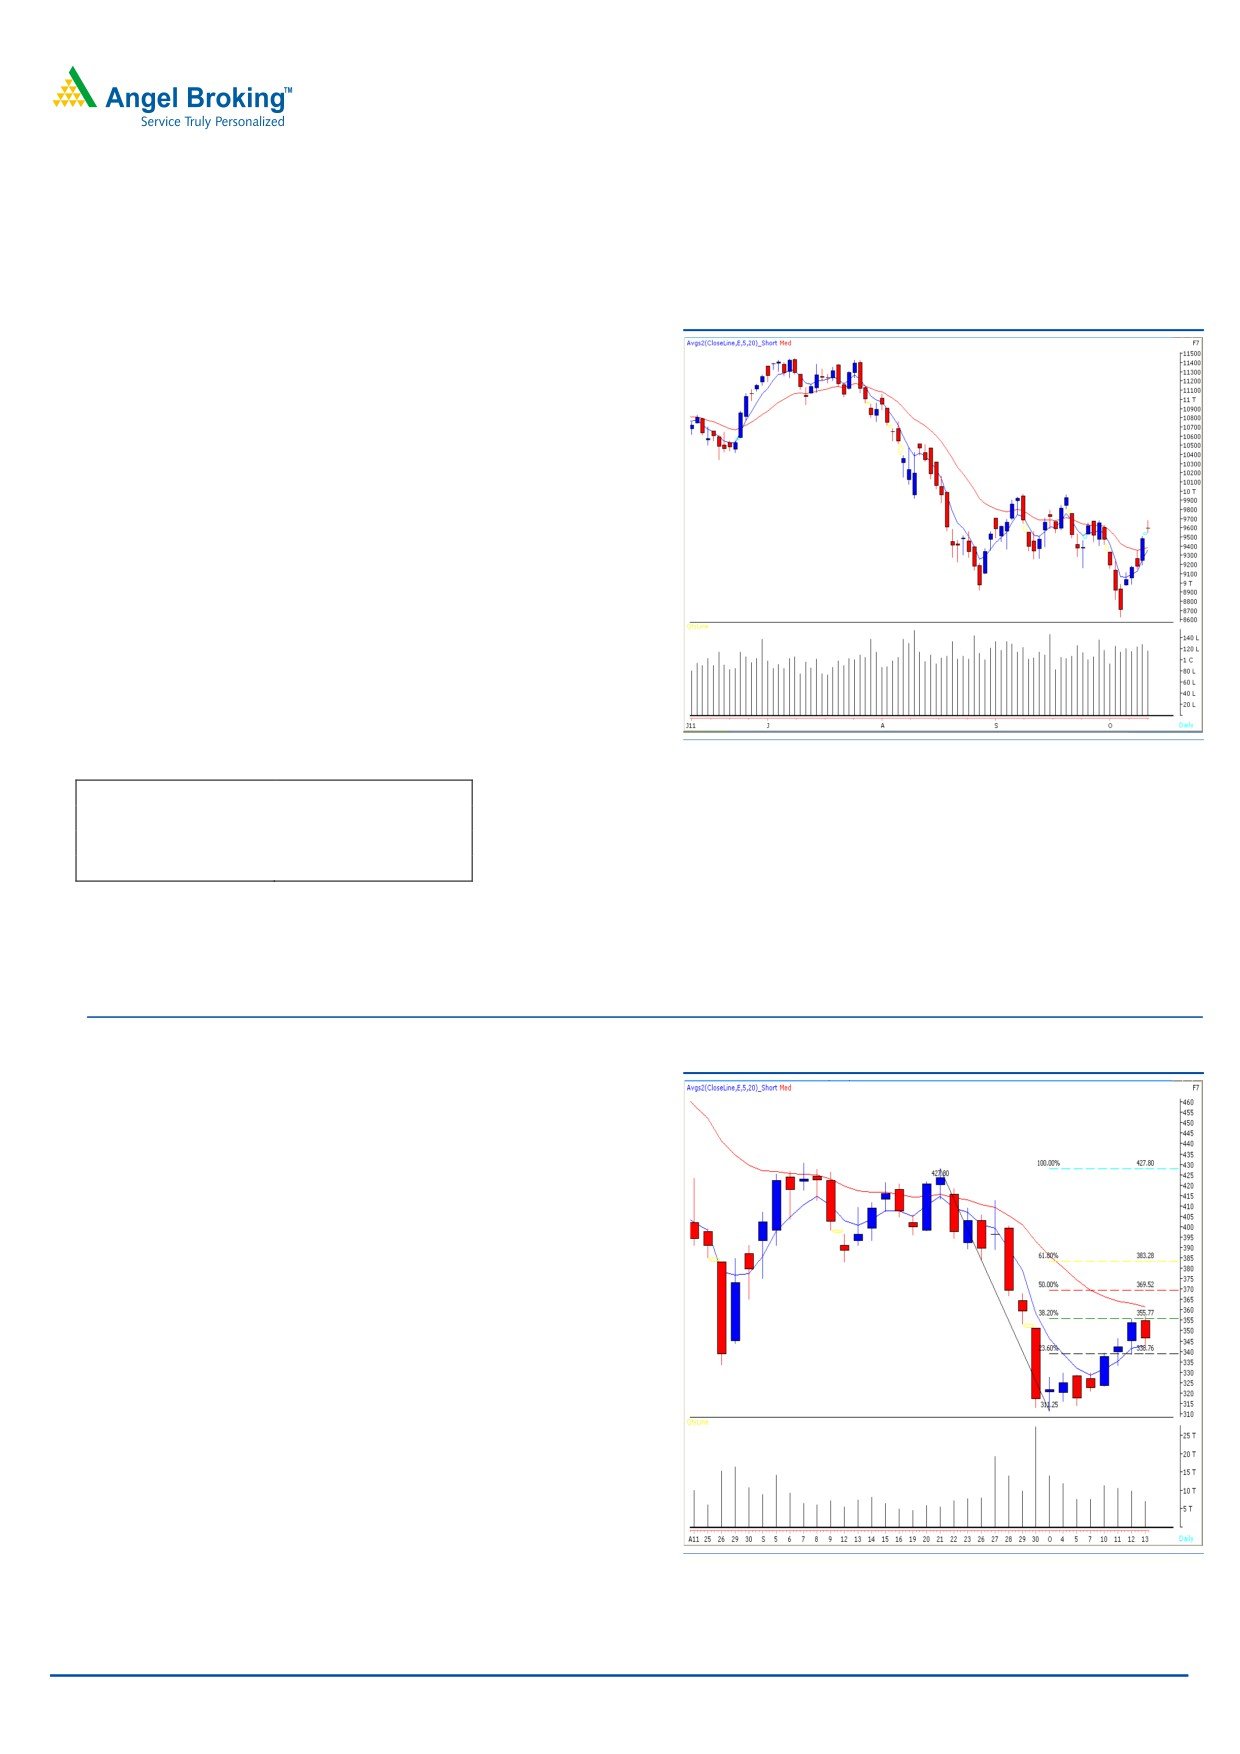
Exhibit 3: Reliance Capital (Oct Fut) Daily chart
Stock - Reliance Capital (Oct.Fut.)
Action - Sell
Last close - ` 346.15
Range
- ` 346 - ` 350
Stop Loss - ` 357.15
Target
- ` 324
Justification - The Daily chart depicts a “Dark Cloud Cover”
Japanese candlestick pattern exactly at 38.2% Fibonacci
retracement of the fall from ` 428 to ` 311.In addition, this
level is near its “20 day EMA” coupled with negatively
poised hourly chart. Hence, we advise selling the stock in a
range of ` 346 to ` 350 for a target of ` 324 in coming 3 -
4 trading sessions.
Source: Falcon
For Private Circulation Only |
2
Technical Research | October 14, 2011
Positive Bias:
Stock Name
5 Day EMA
20 Day EMA
Expected Target
Remarks
Cipla
285
284.31
294
Support at 279.50
Chambal
95.66
97.50
104.50
Support at 94.50
Fertilizer
Negative Bias:
Stock Name
5 Day EMA
20 Day EMA
Expected Target
Remarks
ACC
1124.62
1094.07
1090
Strong resistance at 1146.50
Hindalco
129.17
133.42
124
Resistance at 134.50
Larsen&Toubro
1409.78
1444.94
1368.50
Resistance at 1450
For Private Circulation Only |
3
Technical Research | October 14, 2011
Daily Pivot Levels for Nifty 50 Stocks
SCRIPS
S2
S1
PIVOT
R1
R2
SENSEX
16,711
16,797
16,941
17,027
17,171
NIFTY
5,025
5,051
5,094
5,121
5,163
BANKNIFTY
9,470
9,531
9,608
9,669
9,746
ACC
1,107
1,115
1,128
1,136
1,148
AMBUJACEM
145
146
148
150
151
AXISBANK
1,064
1,075
1,092
1,103
1,120
BAJAJ-AUTO
1,562
1,574
1,589
1,602
1,617
BHARTIARTL
360
365
371
376
382
BHEL
323
328
336
342
350
BPCL
640
647
660
668
681
CAIRN
273
276
280
284
288
CIPLA
283
285
288
290
293
DLF
228
233
238
243
248
DRREDDY
1,465
1,484
1,509
1,528
1,553
GAIL
410
414
419
423
428
HCLTECH
414
420
427
434
440
HDFC
656
660
667
671
677
HDFCBANK
463
467
471
475
480
HEROMOTOCO
1,942
1,962
1,994
2,014
2,045
HINDALCO
124
126
130
133
137
HINDUNILVR
319
323
328
331
336
ICICIBANK
855
868
878
890
901
IDFC
117
119
122
124
127
INFY
2,660
2,678
2,704
2,722
2,748
ITC
198
200
203
205
207
JINDALSTEL
442
470
494
523
546
JPASSOCIAT
72
73
74
75
77
KOTAKBANK
464
469
473
478
483
LT
1,390
1,405
1,427
1,442
1,464
M&M
781
790
802
812
824
MARUTI
1,030
1,044
1,064
1,078
1,098
NTPC
170
172
175
177
180
ONGC
257
261
268
272
279
PNB
958
969
985
997
1,013
POWERGRID
98
98
99
100
101
RANBAXY
489
496
507
514
526
RCOM
74
76
77
78
80
RELCAPITAL
332
339
347
354
362
RELIANCE
833
840
849
856
865
RELINFRA
404
411
419
426
433
RPOWER
83
84
85
85
86
SAIL
104
106
109
111
114
SBIN
1,840
1,864
1,899
1,923
1,958
SESAGOA
220
225
229
233
237
SIEMENS
815
826
838
849
862
STER
116
118
121
123
126
SUNPHARMA
467
472
479
484
491
SUZLON
37
37
38
38
39
TATAMOTORS
167
172
179
183
190
TATAPOWER
96
97
100
102
104
TATASTEEL
435
444
451
460
467
TCS
1,068
1,080
1,093
1,105
1,117
WIPRO
345
347
351
354
358
Technical Research Team
For Private Circulation Only |
4
Technical Report
RESEARCH TEAM
Shardul Kulkarni
Head - Technicals
Sameet Chavan
Technical Analyst
Sacchitanand Uttekar
Technical Analyst
Mehul Kothari
Technical Analyst
Ankur Lakhotia
Technical Analyst
Research Team: 022-3952 6600
DISCLAIMER: This document is not for public distribution and has been furnished to you solely for your information and must not
be reproduced or redistributed to any other person. Persons into whose possession this document may come are required to observe
these restrictions.
Opinion expressed is our current opinion as of the date appearing on this material only. While we endeavor to update on a
reasonable basis the information discussed in this material, there may be regulatory, compliance, or other reasons that prevent us
from doing so. Prospective investors and others are cautioned that any forward-looking statements are not predictions and may be
subject to change without notice. Our proprietary trading and investment businesses may make investment decisions that are
inconsistent with the recommendations expressed herein.
The information in this document has been printed on the basis of publicly available information, internal data and other reliable
sources believed to be true and are for general guidance only. While every effort is made to ensure the accuracy and completeness of
information contained, the company takes no guarantee and assumes no liability for any errors or omissions of the information. No
one can use the information as the basis for any claim, demand or cause of action.
Recipients of this material should rely on their own investigations and take their own professional advice. Each recipient of this
document should make such investigations as it deems necessary to arrive at an independent evaluation of an investment in the
securities of companies referred to in this document (including the merits and risks involved), and should consult their own advisors to
determine the merits and risks of such an investment. Price and value of the investments referred to in this material may go up or
down. Past performance is not a guide for future performance. Certain transactions - futures, options and other derivatives as well as
non-investment grade securities - involve substantial risks and are not suitable for all investors. Reports based on technical analysis
centers on studying charts of a stock's price movement and trading volume, as opposed to focusing on a company's fundamentals
and as such, may not match with a report on a company's fundamentals.
We do not undertake to advise you as to any change of our views expressed in this document. While we would endeavor to update
the information herein on a reasonable basis, Angel Broking, its subsidiaries and associated companies, their directors and
employees are under no obligation to update or keep the information current. Also there may be regulatory, compliance, or other
reasons that may prevent Angel Broking and affiliates from doing so. Prospective investors and others are cautioned that any
forward-looking statements are not predictions and may be subject to change without notice.
Angel Broking Limited and affiliates, including the analyst who has issued this report, may, on the date of this report, and from time
to time, have long or short positions in, and buy or sell the securities of the companies mentioned herein or engage in any other
transaction involving such securities and earn brokerage or compensation or act as advisor or have other potential conflict of interest
with respect to company/ies mentioned herein or inconsistent with any recommendation and related information and opinions.
Angel Broking Limited and affiliates may seek to provide or have engaged in providing corporate finance, investment banking or
other advisory services in a merger or specific transaction to the companies referred to in this report, as on the date of this report or
in the past.
Sebi Registration No : INB 010996539
For Private Circulation Only |