Daily Technical Report
August 13, 2012
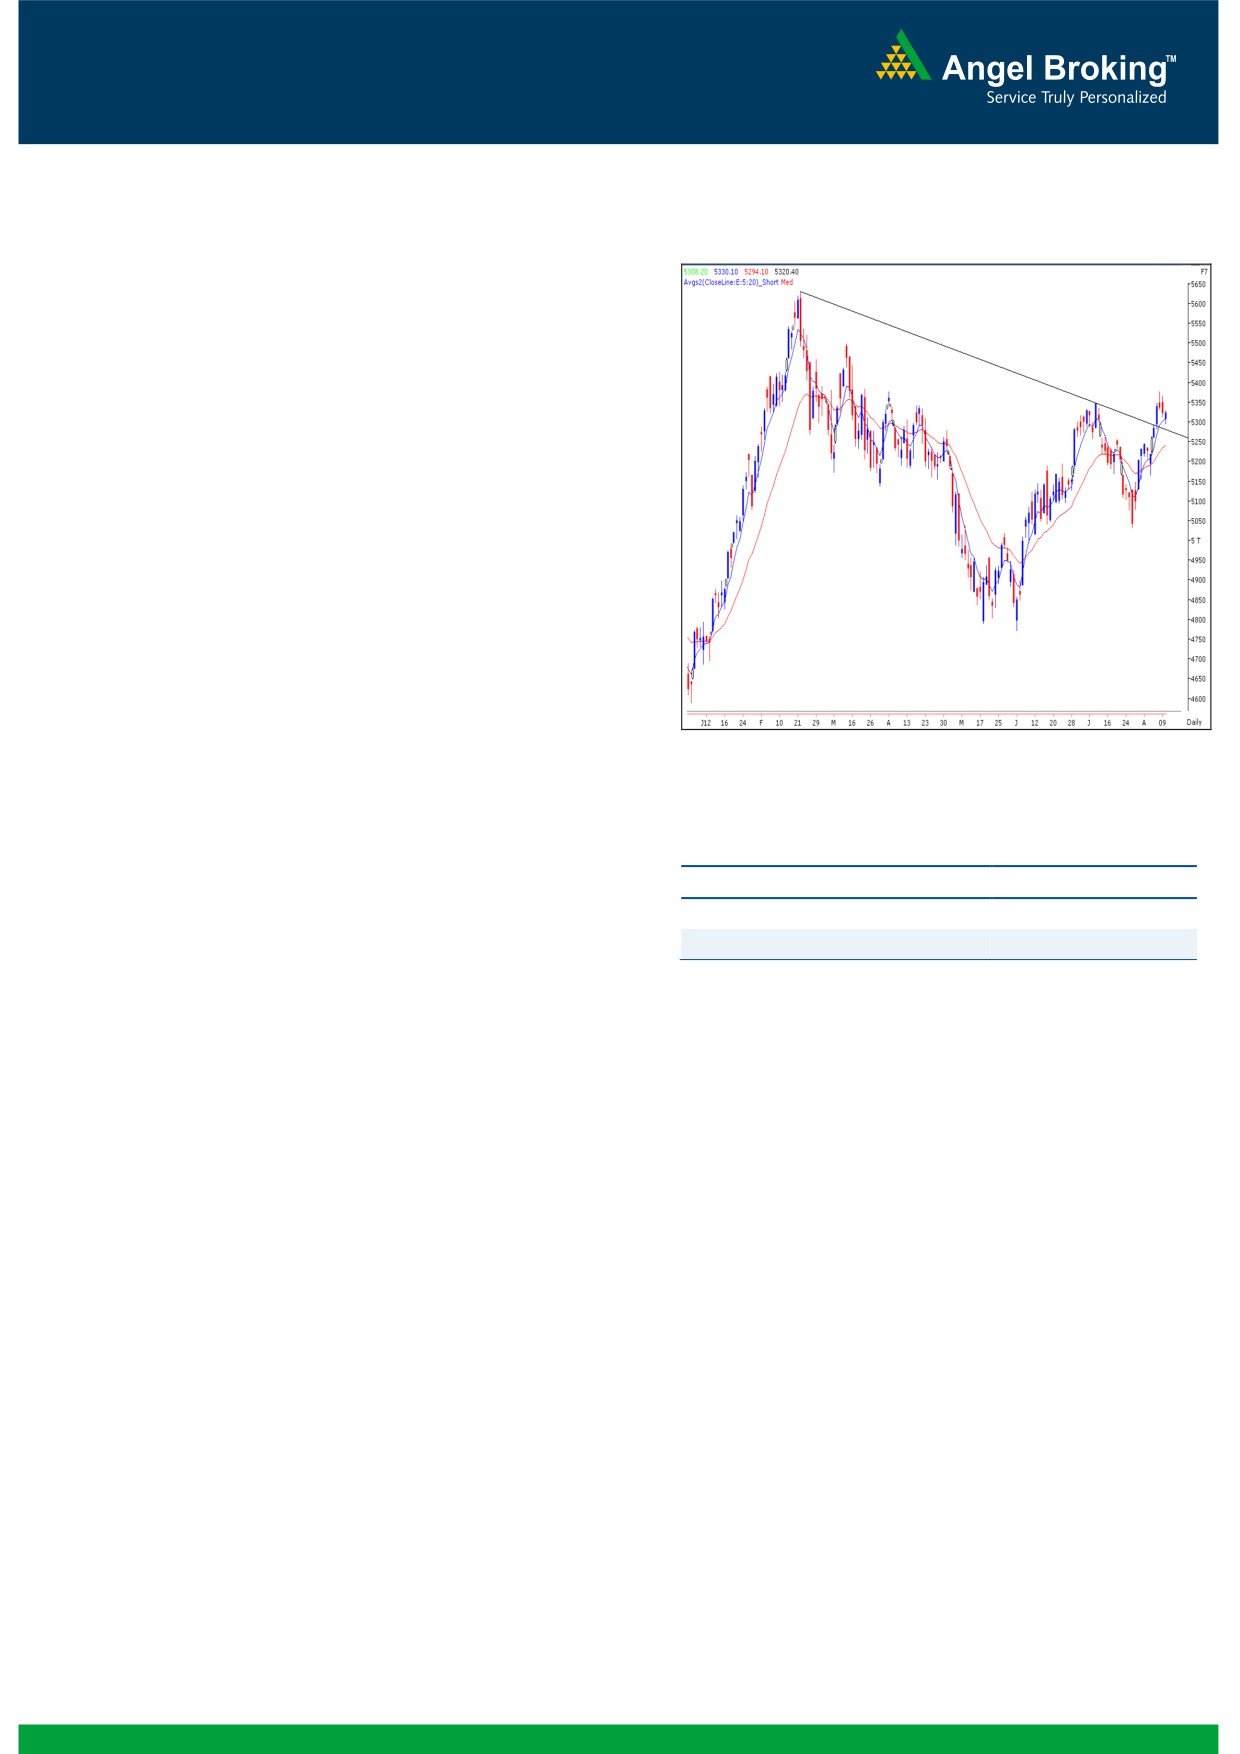
Exhibit 1: Nifty Daily Chart
Sensex (17558) / NIFTY (5320)
We had a sluggish opening in our markets on Friday
and indices drifted marginally lower post the
announcement of SBI quarterly results to test the
mentioned support level of 17450 / 5290. However,
a sharp recovery during the second half led indices to
close well above 5300 mark. On sectoral front, IT,
Teck and FMCG counters traded with strong positive
bias throughout the session; whereas Consumer
Durables, Auto and PSU sectors were among the
major losers. The advance to decline ratio was in
favor of declining counters (A=1202 D=1553)
Formation
On the weekly chart, the indices have precisely
tested the “Downward Sloping Trend Line”
Source: Falcon
resistance near 17727 / 5386 formed by joining
the highs of 21109 / 6339 (November 5, 2010)
Actionable points:
- 18524 / 5630 (February 24, 2012).
The ’20-day EMA’ and the ’200-day SMA’ are
View
Neutral
placed at 17284 / 5242 and 16900 / 5100
Resistance Levels
5354 - 5386
levels, respectively.
Support Levels
5294 - 5260
A weekly closing above 17727 / 5386 level
would confirm a ‘Higher Top - Higher Bottom’
formation on the weekly chart after August 28,
A weekly close above 17727 / 5386 level would
2009.
indicate a breakout and a ‘Higher Top - Higher
Bottom’ formation is likely to begin. In this scenario,
The candlestick pattern on the daily chart
we may witness immense buying interest among
resembles a “Shooting star” and signifies
market participants. Hence, this accelerated
resistance near 17727 / 5386 levels.
momentum may push the market higher to test
17900 - 18050 / 5450 - 5500 levels. Conversely,
17450 - 17313 / 5290 - 5260 levels are likely to act
Trading strategy:
as decent support levels in the coming week. A
Despite negative data pertaining to the domestic
sustainable move below 17313 / 5260 level may
economy, our markets are currently showing strength
result in a loss of current positive momentum and
around the
5300 mark. The minor impact of
hence, may drag indices lower to test 17208 / 5220
‘Shooting Star’ was seen during the last two sessions
mark.
of the week as indices corrected to test strong support
levels of
17450 / 5290, but eventually the Nifty
closed above the 5300 mark. At his juncture, the
correction can also be construed as a pull-back
towards the "Downward Sloping Trend Line" drawn by
joining the highs of 18524 / 5630 (February 22,
2010) - 17631 / 5349 (July 10, 2012).
1
Daily Technical Report
August 13, 2012
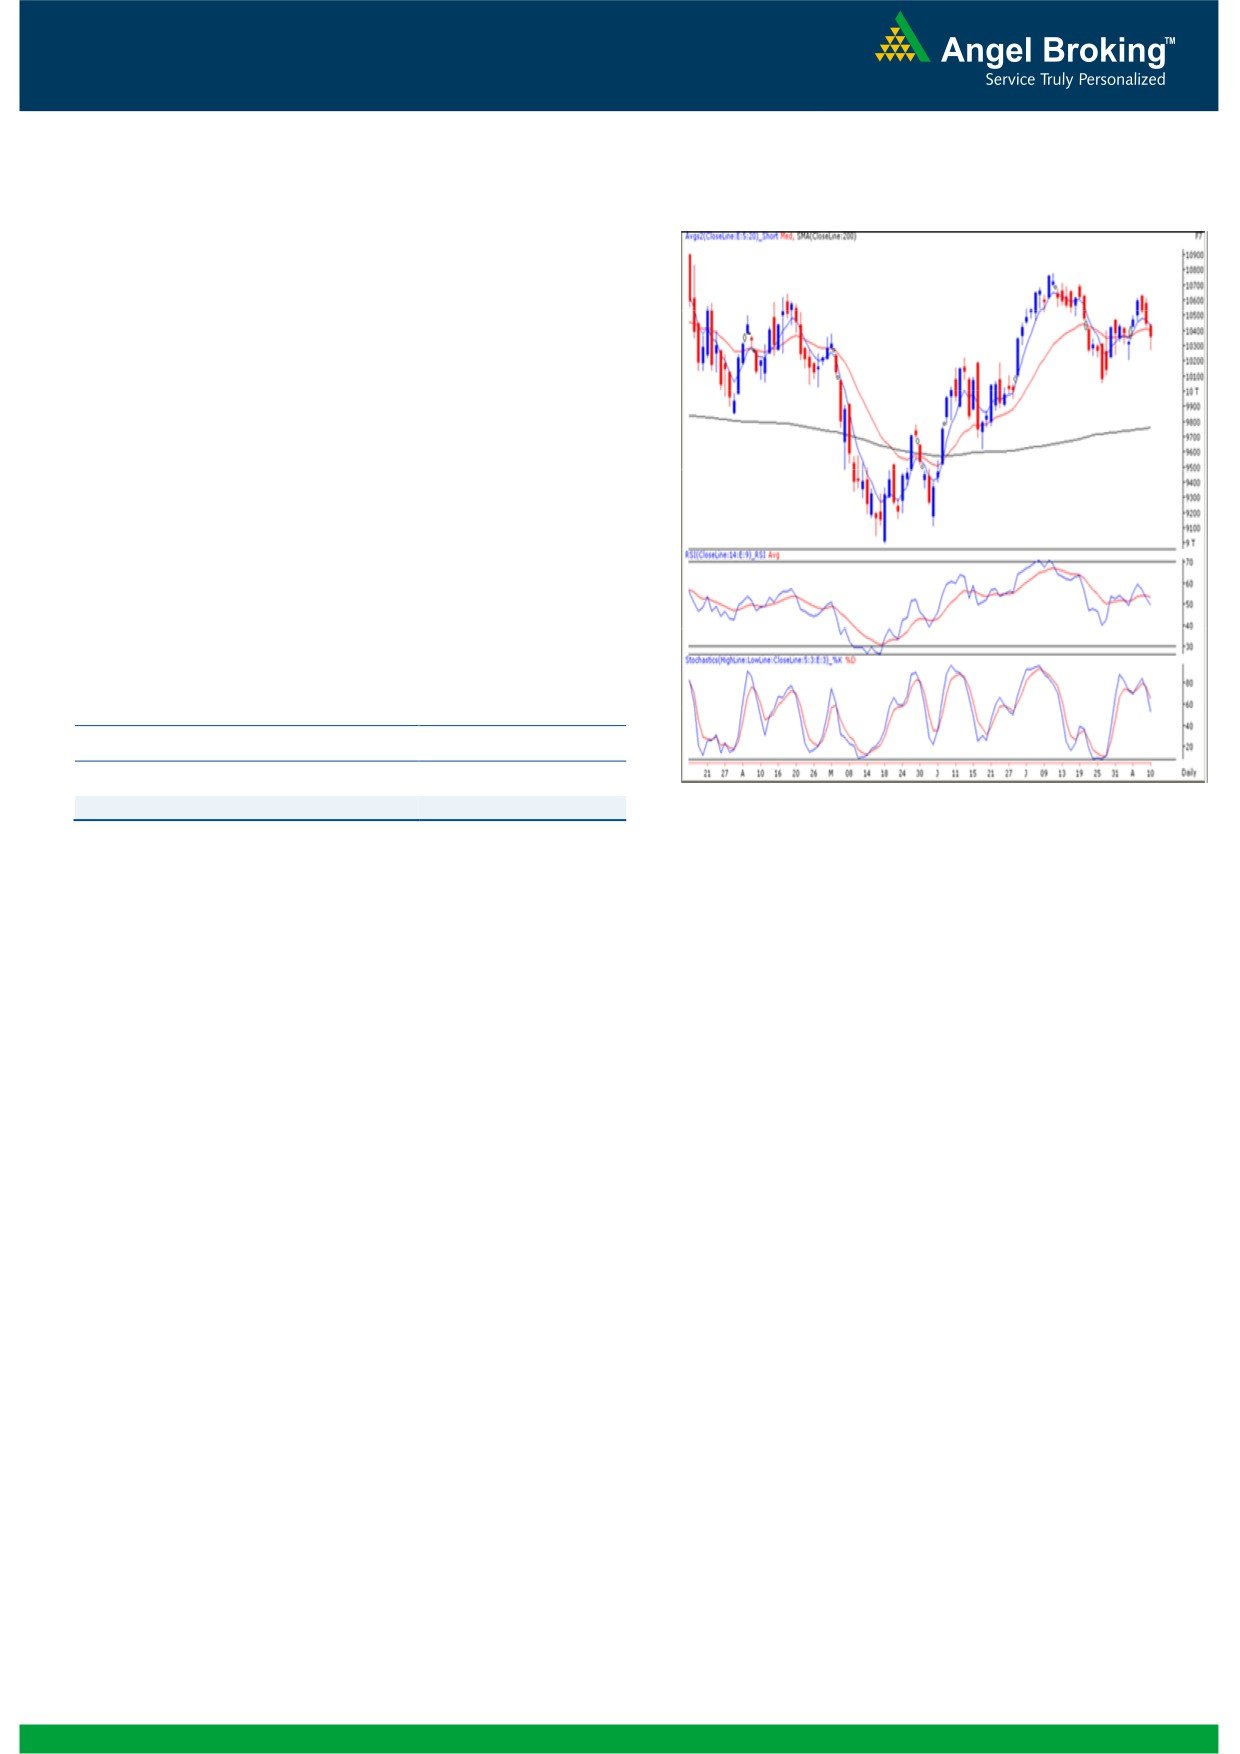
Bank Nifty Outlook - (10359)
Exhibit 2: Bank Nifty Daily Chart
On Friday, Bank Nifty opened on a pessimistic note
and traded with immense volatility to close with a loss
of 1% on the back of disappointing results from SBI.
The momentum oscillators on the daily chart continue
with their sell signal. On the weekly chart we are
witnessing a “Spinning Top” candlestick indicating
indecisiveness at current levels. We are of the opinion
that 10240 mark is an important support level for the
index and a breach of this support level would further
deteriorate the sentiments. In this scenario Bank Nifty
may test 10109 - 10056 levels. On the upside,
10456 - 10511 levels are likely to act as resistance in
coming trading session.
Actionable points:
View
Neutral
Resistance Levels
10456- 10511
Support Levels
10270 - 10240
Source: Falcon
2
Daily Technical Report
August 13, 2012
Daily Pivot Levels for Nifty 50 Stocks
SCRIPS
S2
S1
PIVOT
R1
R2
SENSEX
17,421
17,489
17,540
17,608
17,659
NIFTY
5,279
5,300
5,315
5,336
5,351
BANKNIFTY
10,183
10,271
10,360
10,448
10,537
ACC
1,324
1,333
1,344
1,353
1,364
AMBUJACEM
191
193
194
195
197
ASIANPAINT
3,664
3,688
3,721
3,746
3,779
AXISBANK
1,017
1,044
1,067
1,094
1,117
BAJAJ-AUTO
1,650
1,663
1,679
1,692
1,707
BANKBARODA
608
618
631
641
654
BHARTIARTL
247
251
257
262
268
BHEL
225
227
229
231
233
BPCL
325
339
347
361
369
CAIRN
318
321
323
327
329
CIPLA
342
346
351
355
360
COALINDIA
343
346
350
353
357
DLF
207
209
210
212
214
DRREDDY
1,629
1,637
1,646
1,654
1,662
GAIL
361
364
369
372
376
GRASIM
2,955
2,975
3,000
3,020
3,045
HCLTECH
529
533
536
540
544
HDFC
681
685
689
694
698
HDFCBANK
596
599
603
606
610
HEROMOTOCO
1,862
1,887
1,923
1,948
1,984
HINDALCO
120
121
123
124
126
HINDUNILVR
482
490
494
502
507
ICICIBANK
924
939
950
966
977
IDFC
128
130
133
135
137
INFY
2,242
2,278
2,299
2,335
2,356
ITC
262
265
267
270
272
JINDALSTEL
398
404
409
414
419
JPASSOCIAT
74
74
75
76
77
KOTAKBANK
547
564
574
591
601
LT
1,395
1,410
1,419
1,434
1,443
M&M
728
734
739
745
750
MARUTI
1,126
1,146
1,161
1,181
1,196
NTPC
167
170
171
173
175
ONGC
275
277
280
282
285
PNB
707
714
726
733
744
POWERGRID
116
118
120
121
123
RANBAXY
474
479
487
493
501
RELIANCE
767
775
782
789
797
RELINFRA
492
498
506
512
519
SAIL
83
84
85
86
87
SBIN
1,801
1,845
1,919
1,963
2,037
SESAGOA
185
188
190
193
195
SIEMENS
645
652
658
665
671
STER
107
109
110
112
114
SUNPHARMA
659
667
679
687
698
TATAMOTORS
227
230
233
236
239
TATAPOWER
98
99
100
101
102
TATASTEEL
394
397
402
405
410
TCS
1,244
1,262
1,274
1,291
1,303
WIPRO
340
345
348
353
357
3
Daily Technical Report
August 13, 2012
Research Team Tel: 022 - 39357800
DISCLAIMER
This document is solely for the personal information of the recipient, and must not be singularly used as the basis of any investment
decision. Nothing in this document should be construed as investment or financial advice. Each recipient of this document should make
such investigations as they deem necessary to arrive at an independent evaluation of an investment in the securities of the companies
referred to in this document (including the merits and risks involved), and should consult their own advisors to determine the merits and
risks of such an investment.
Angel Broking Limited, its affiliates, directors, its proprietary trading and investment businesses may, from time to time, make
investment decisions that are inconsistent with or contradictory to the recommendations expressed herein. The views contained in this
document are those of the analyst, and the company may or may not subscribe to all the views expressed within.
Reports based on technical and derivative analysis center on studying charts of a stock's price movement, outstanding positions and
trading volume, as opposed to focusing on a company's fundamentals and, as such, may not match with a report on a company's
fundamentals.
The information in this document has been printed on the basis of publicly available information, internal data and other reliable
sources believed to be true, but we do not represent that it is accurate or complete and it should not be relied on as such, as this
document is for general guidance only. Angel Broking Limited or any of its affiliates/ group companies shall not be in any way
responsible for any loss or damage that may arise to any person from any inadvertent error in the information contained in this report.
Angel Broking Limited has not independently verified all the information contained within this document. Accordingly, we cannot testify,
nor make any representation or warranty, express or implied, to the accuracy, contents or data contained within this document. While
Angel Broking Limited endeavours to update on a reasonable basis the information discussed in this material, there may be regulatory,
compliance, or other reasons that prevent us from doing so.
This document is being supplied to you solely for your information, and its contents, information or data may not be reproduced,
redistributed or passed on, directly or indirectly.
Angel Broking Limited and its affiliates may seek to provide or have engaged in providing corporate finance, investment banking or
other advisory services in a merger or specific transaction to the companies referred to in this report, as on the date of this report or in
the past.
Neither Angel Broking Limited, nor its directors, employees or affiliates shall be liable for any loss or damage that may arise from or in
connection with the use of this information.
Note: Please refer to the important `Stock Holding Disclosure' report on the Angel website (Research Section). Also, please refer to the
latest update on respective stocks for the disclosure status in respect of those stocks. Angel Broking Limited and its affiliates may have
investment positions in the stocks recommended in this report.
Research Team
Shardul Kulkarni
-
Head - Technicals
Sameet Chavan
-
Technical Analyst
Sacchitanand Uttekar
-
Technical Analyst
Mehul Kothari
-
Technical Analyst
Ankur Lakhotia
-
Technical Analyst
Angel Broking Pvt. Ltd.
Registered Office: G-1, Ackruti Trade Centre, Rd. No. 7, MIDC, Andheri (E), Mumbai - 400 093.
Corporate Office: 6th Floor, Ackruti Star, MIDC, Andheri (E), Mumbai - 400 093. Tel: (022) 3952 6600
Sebi Registration No: INB 010996539
4