Daily Technical Report
July 13, 2012
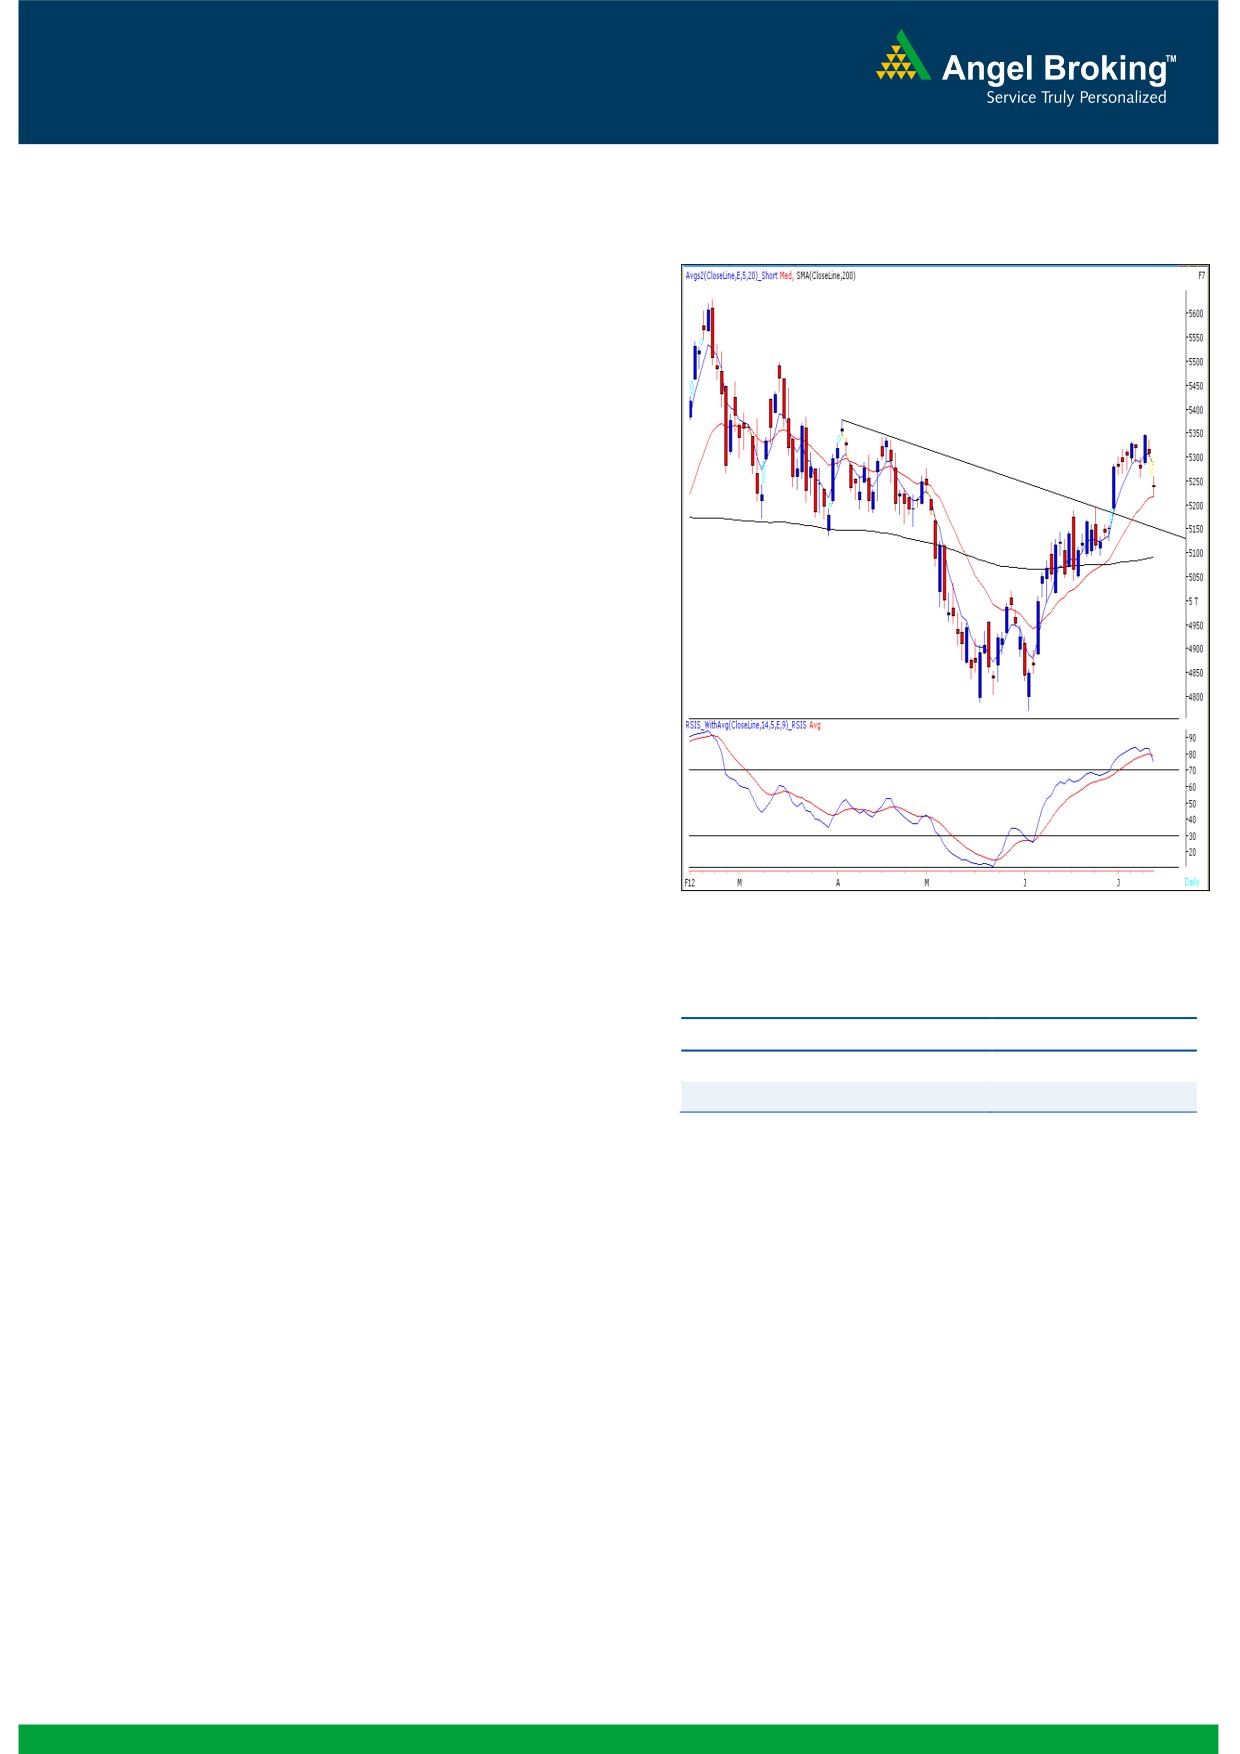
Exhibit 1: Nifty Daily Chart
Sensex (17233) / NIFTY (5235)
Yesterday, our benchmark indices opened lower
below the mentioned support level of 17344 / 5258
and traded with extreme pessimism throughout the
day. Although some recovery was seen from the day’s
low during the second half, Indices closed below the
5250 mark. On the sectoral front, the fall was mainly
led by IT and Teck counters; whereas Realty and Oil &
Gas sector ended with nominal gain. The advance to
decline ratio was strongly in favor of declining
counters
(A=1169 D=1635) (Source
-
Formation
The 200-day SMA (Simple Moving Average) is
placed at 16824 / 5083 level.
Markets have taken support at the Monthly
‘Upward Sloping Trend Line’ and have formed a
‘Bullish Engulfing’ Pattern.
We are witnessing a narrow range body
formation near 61.8% Fibonacci retracement of
the fall from 18524 / 5630 (February 22, 2012)
Source: Falcon
- 15749 / 4770 (June 4, 2012). This level is at
Actionable points:
17464 / 5302.
On the weekly chart we are witnessing a
View
Neutral
“Downward Sloping Trend Line” resistance near
17780 / 5420 formed by joining the highs of
Resistance Levels
5262 - 5300
21109 / 6339 (November 5, 2010) - 18524 /
Support Levels
5217 - 5189 - 5159
5630 (February 24, 2012).
Trading strategy:
On the upside 17329 - 17467 / 5262 - 5300 levels
would now act as resistance in coming trading
Yesterday, we witnessed a gap down opening on the
sessions. While the undertone remains bullish, the
back of negative global clues. Disappointing earnings
indices are likely to trade in a narrow range between
from Infosys further dented sentiment as the counter
16919 / 5159 to 17635 / 5350 over the next 3 to 5
tumbled to close 8% lower. At this juncture we are
sessions.
witnessing that the markets have taken support near
20 day EMA which is placed at 17169 /
5217.
However, on the contrary “RSI-Smoothened”
momentum oscillator, on the daily chart has given a
negative crossover which is a sign of concern in
coming trading session. Therefore, on the downside if
indices sustain below 17169 / 5217, then they are
likely to correct further towards the gap area formed
at 17135 - 16919 / 5189 - 5159 levels.
1
Daily Technical Report
July 13, 2012
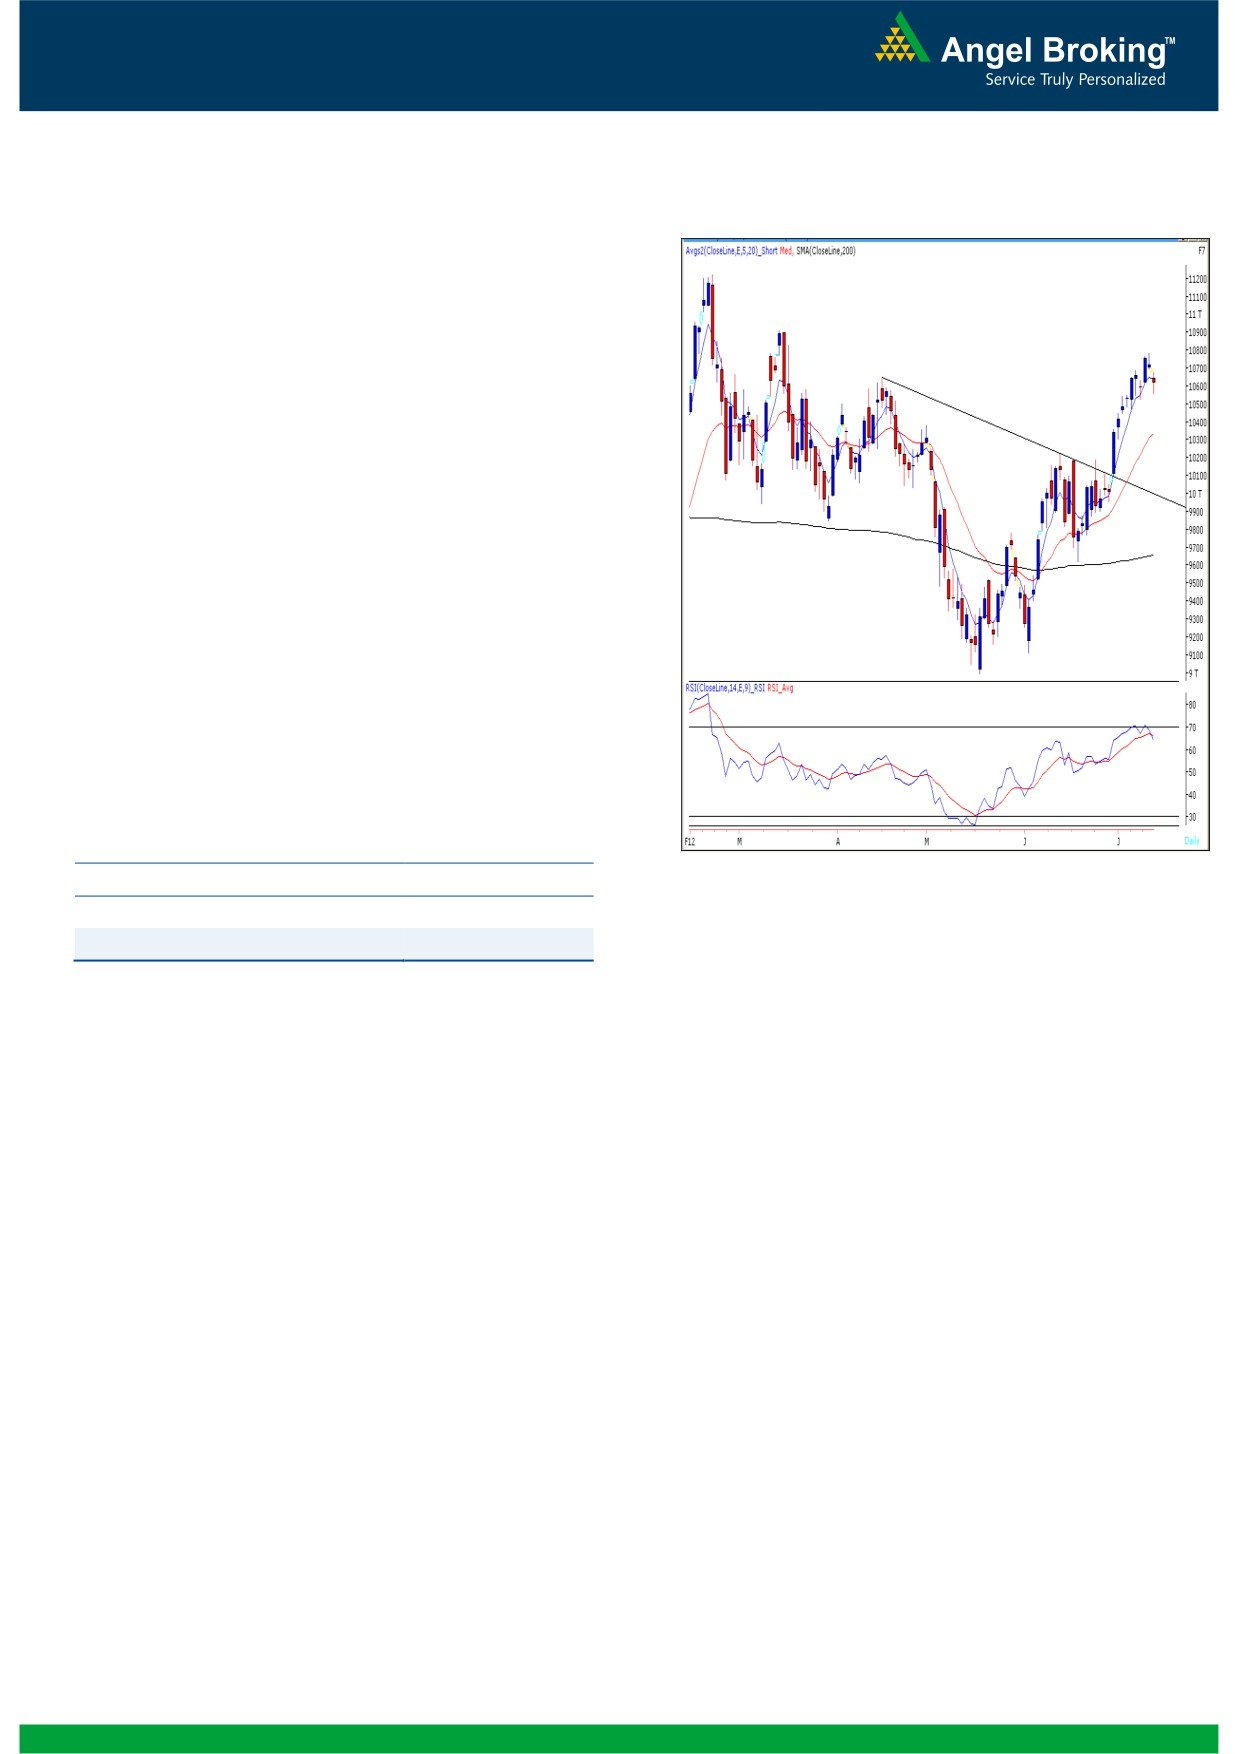
Bank Nifty Outlook - (10616)
Exhibit 2: Bank Nifty Daily Chart
Yesterday, Bank Nifty opened with a downside gap in
line with our benchmark indices and traded with
extreme volatility throughout the session to close near
the initial opening level. We had mentioned in our
previous report that we are witnessing a negative
crossover in “RSI - Smoothened” oscillator on the
hourly chart. The impact of the mentioned tool was
seen and the index tested the support level of 10524.
We are now witnessing a negative crossover in “RSI”
momentum oscillator on the daily chart. The impact of
this technical indicator will be seen once the index
sustains below 10524 level. In such a scenario the
index is likely to drift further lower towards 10440 -
10365 levels. On the upside 10670 - 10700 levels
are likely to act as resistance in coming trading
session. Positional traders holding long positions are
advised to book profits at current levels. Fresh long
positions in Bank Nifty can be added on a close
above 10783 level on Bank Nifty Spot.
Actionable points:
Source: Falcon
View
Bearish Below 10524
Expected Targets
10440 - 10365
Resistance Levels
10670 - 10700
2
Daily Technical Report
July 13, 2012
Daily Pivot Levels for Nifty 50 Stocks
SCRIPS
S2
S1
PIVOT
R1
R2
SENSEX
17,099
17,166
17,248
17,314
17,396
NIFTY
5,194
5,215
5,238
5,259
5,282
BANKNIFTY
10,498
10,557
10,617
10,676
10,735
ACC
1,246
1,255
1,264
1,273
1,282
AMBUJACEM
166
168
169
171
172
ASIANPAINT
3,647
3,685
3,721
3,759
3,795
AXISBANK
1,033
1,041
1,050
1,057
1,067
BAJAJ-AUTO
1,465
1,478
1,498
1,511
1,531
BANKBARODA
708
714
724
730
740
BHARTIARTL
299
303
309
313
320
BHEL
226
229
232
234
237
BPCL
769
777
783
792
798
CAIRN
308
311
313
316
318
CIPLA
322
324
326
328
330
COALINDIA
349
352
354
356
358
DLF
204
207
210
213
215
DRREDDY
1,625
1,637
1,648
1,660
1,671
GAIL
349
355
359
365
369
GRASIM
2,606
2,625
2,639
2,658
2,672
HCLTECH
474
477
481
485
489
HDFC
667
671
677
681
687
HDFCBANK
567
574
582
589
598
HEROMOTOCO
1,998
2,030
2,053
2,085
2,108
HINDALCO
120
122
123
125
126
HINDUNILVR
435
439
443
447
452
ICICIBANK
915
922
928
935
941
IDFC
133
135
137
139
142
INFY
2,193
2,229
2,254
2,290
2,315
ITC
248
250
253
255
259
JINDALSTEL
435
440
446
450
456
JPASSOCIAT
73
76
77
80
81
KOTAKBANK
595
600
603
608
611
LT
1,386
1,397
1,415
1,425
1,443
M&M
712
715
719
723
727
MARUTI
1,173
1,185
1,200
1,211
1,227
NTPC
155
157
159
161
162
ONGC
273
278
280
285
288
PNB
826
835
849
858
872
POWERGRID
111
112
113
113
114
RANBAXY
478
483
488
493
498
RELIANCE
710
716
723
728
735
RELINFRA
535
544
551
561
567
SAIL
90
91
93
94
95
SBIN
2,173
2,197
2,218
2,242
2,263
SESAGOA
190
191
194
195
197
SIEMENS
689
697
710
718
731
STER
103
104
105
106
107
SUNPHARMA
613
617
622
625
630
TATAMOTORS
233
235
238
240
243
TATAPOWER
98
99
101
102
103
TATASTEEL
421
425
431
434
440
TCS
1,204
1,220
1,235
1,251
1,266
WIPRO
348
354
361
367
375
3
Daily Technical Report
July 13, 2012
Research Team Tel: 022 - 39357800
DISCLAIMER
This document is solely for the personal information of the recipient, and must not be singularly used as the basis of any investment
decision. Nothing in this document should be construed as investment or financial advice. Each recipient of this document should make
such investigations as they deem necessary to arrive at an independent evaluation of an investment in the securities of the companies
referred to in this document (including the merits and risks involved), and should consult their own advisors to determine the merits and
risks of such an investment.
Angel Broking Limited, its affiliates, directors, its proprietary trading and investment businesses may, from time to time, make
investment decisions that are inconsistent with or contradictory to the recommendations expressed herein. The views contained in this
document are those of the analyst, and the company may or may not subscribe to all the views expressed within.
Reports based on technical and derivative analysis center on studying charts of a stock's price movement, outstanding positions and
trading volume, as opposed to focusing on a company's fundamentals and, as such, may not match with a report on a company's
fundamentals.
The information in this document has been printed on the basis of publicly available information, internal data and other reliable
sources believed to be true, but we do not represent that it is accurate or complete and it should not be relied on as such, as this
document is for general guidance only. Angel Broking Limited or any of its affiliates/ group companies shall not be in any way
responsible for any loss or damage that may arise to any person from any inadvertent error in the information contained in this report.
Angel Broking Limited has not independently verified all the information contained within this document. Accordingly, we cannot testify,
nor make any representation or warranty, express or implied, to the accuracy, contents or data contained within this document. While
Angel Broking Limited endeavours to update on a reasonable basis the information discussed in this material, there may be regulatory,
compliance, or other reasons that prevent us from doing so.
This document is being supplied to you solely for your information, and its contents, information or data may not be reproduced,
redistributed or passed on, directly or indirectly.
Angel Broking Limited and its affiliates may seek to provide or have engaged in providing corporate finance, investment banking or
other advisory services in a merger or specific transaction to the companies referred to in this report, as on the date of this report or in
the past.
Neither Angel Broking Limited, nor its directors, employees or affiliates shall be liable for any loss or damage that may arise from or in
connection with the use of this information.
Note: Please refer to the important `Stock Holding Disclosure' report on the Angel website (Research Section). Also, please refer to the
latest update on respective stocks for the disclosure status in respect of those stocks. Angel Broking Limited and its affiliates may have
investment positions in the stocks recommended in this report.
Research Team
Shardul Kulkarni
-
Head - Technicals
Sameet Chavan
-
Technical Analyst
Sacchitanand Uttekar
-
Technical Analyst
Mehul Kothari
-
Technical Analyst
Ankur Lakhotia
-
Technical Analyst
Angel Broking Pvt. Ltd.
Registered Office: G-1, Ackruti Trade Centre, Rd. No. 7, MIDC, Andheri (E), Mumbai - 400 093.
Corporate Office: 6th Floor, Ackruti Star, MIDC, Andheri (E), Mumbai - 400 093. Tel: (022) 3952 6600
Sebi Registration No: INB 010996539
4