Technical Research | April 13, 2012
Daily Technical Report
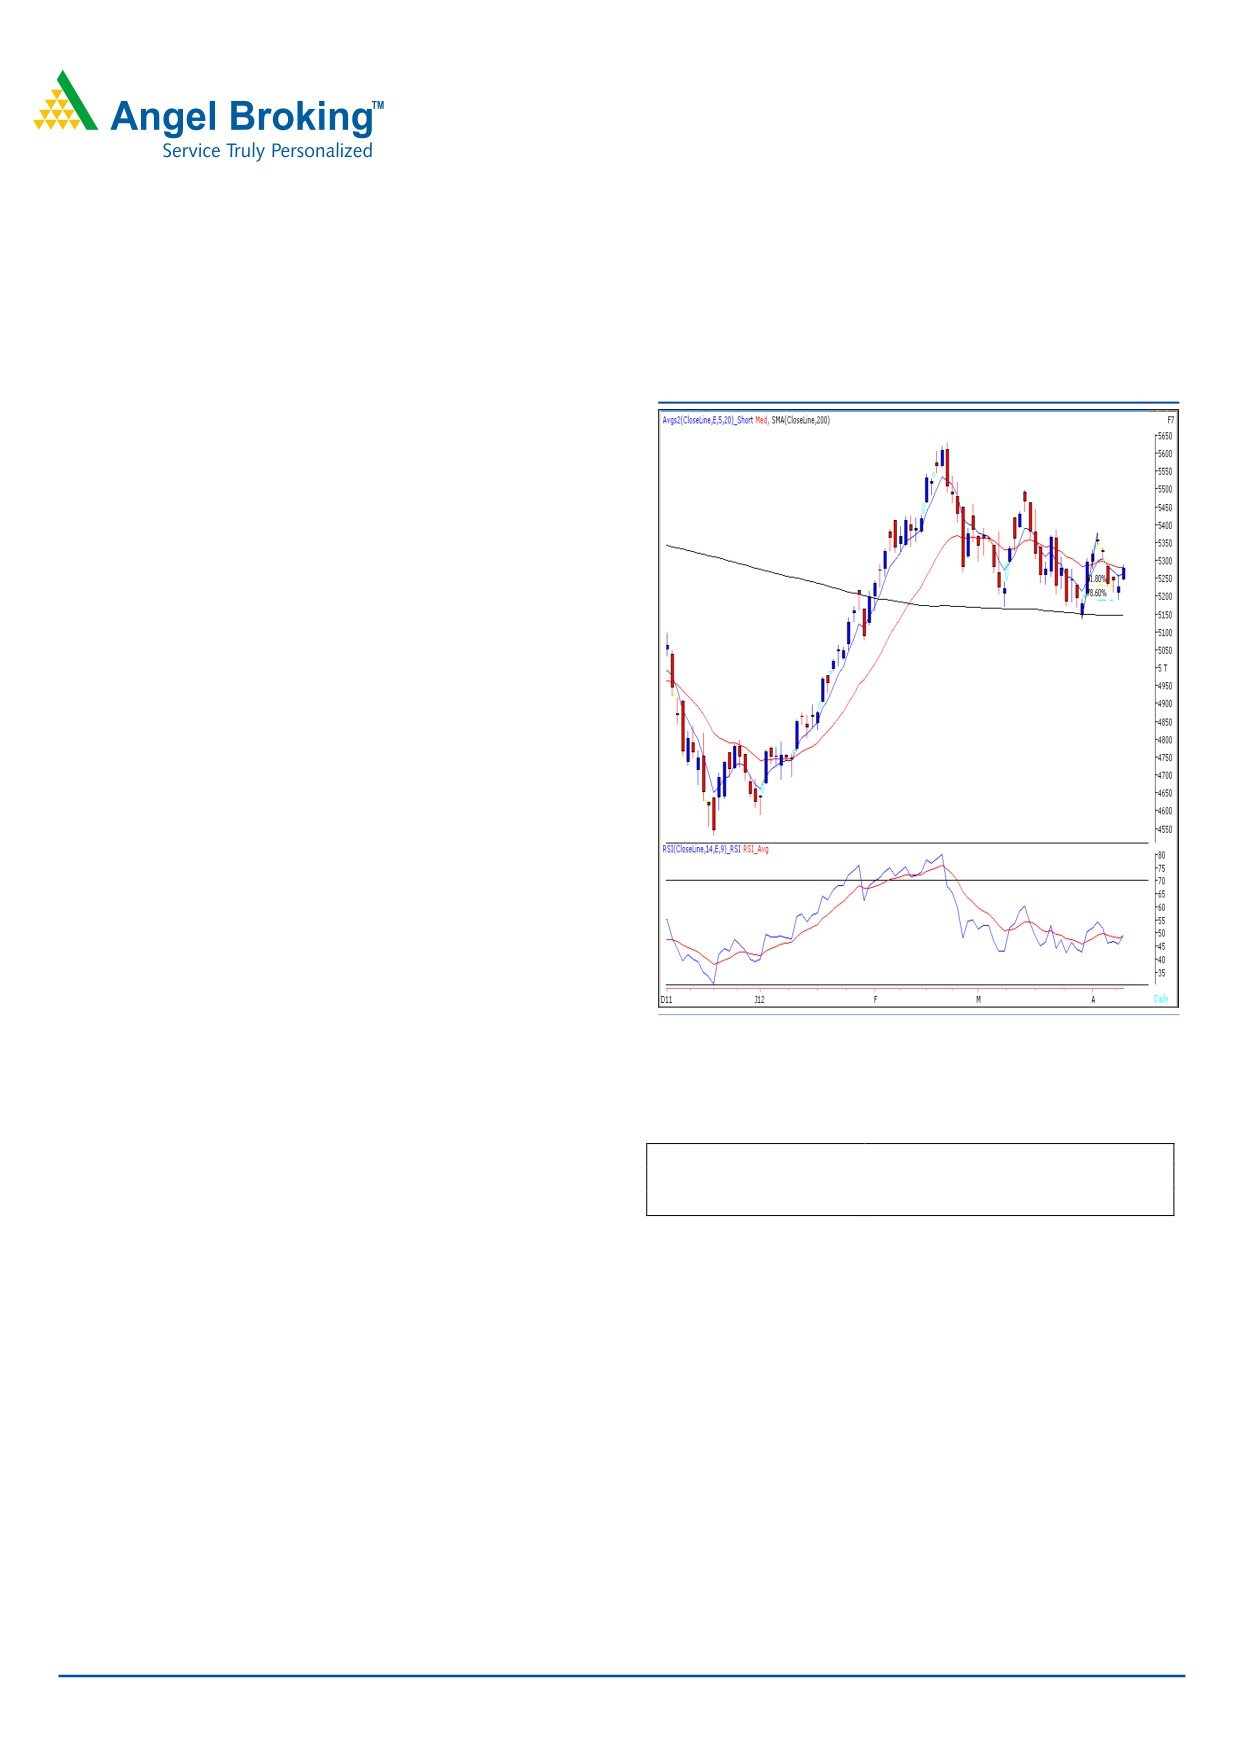
Sensex (17333) / NIFTY (5277)
Exhibit 1: Nifty Daily Chart
Yesterday, we witnessed a gap up opening on the back of
strong cues from U.S. and European bourses. Indices
maintained their early gains throughtout the day and closed
above the 5250 mark. On sectoral front, Metal, Banking
and FMCG counters surged during yesterday’s session;
whereas IT and Teck sectors remained under pressure. The
advance to decline ratio was strongly in favor of advancing
Formation:
• The 200-day SMA (Simple Moving Average) and 20-
day EMA (Exponential Moving Average) have now shifted to
17100 / 5150 and 17360 / 5280, respectively.
• The ‘20-Week EMA’ is placed at 17200 / 5200 level.
• Indices have taken support near 78.60% Fibonacci
Retracement level (17080 / 5187) of the rise from 16920 to
17664 / 5135 to 5379 levels.
• We are now observing a positive crossover in daily
“RSI” momentum oscillator.
Source: Falcon
Trading strategy:
Actionable points:
View
Positive Above 5291
After a gap up opening, indices crossed Wednesday’s high
Expected Targets
5339 - 5379
of 17319 / 5264 during the initial hour of the session. As
Support Levels
5246 - 5190
expected, indices then moved towards their immediate
resistance level of 17407 / 5288. At present, Wednesday’s
low of 17075 / 5190, near 78.60% Fibonacci Retracement
level (17080 / 5187), is a key support for the markets in
coming trading sessions. Considering the global cues
today, it is likely that our markets too will open on an
optimistic note. We are also observing a positive crossover
in daily ‘RSI’ momentum oscillator which indicates possibility
of an upside momentum if indices manage to sustain above
yesterday’s high of 17395 / 5291 level. In this case, indices
are likely to rally towards 17554 - 17664 /5339 - 5379
levels. On the flip side, the immediate support levels are
seen at 17276 - 17075 / 5246 - 5190.
For Private Circulation Only |
1
Technical Research | April 13, 2012
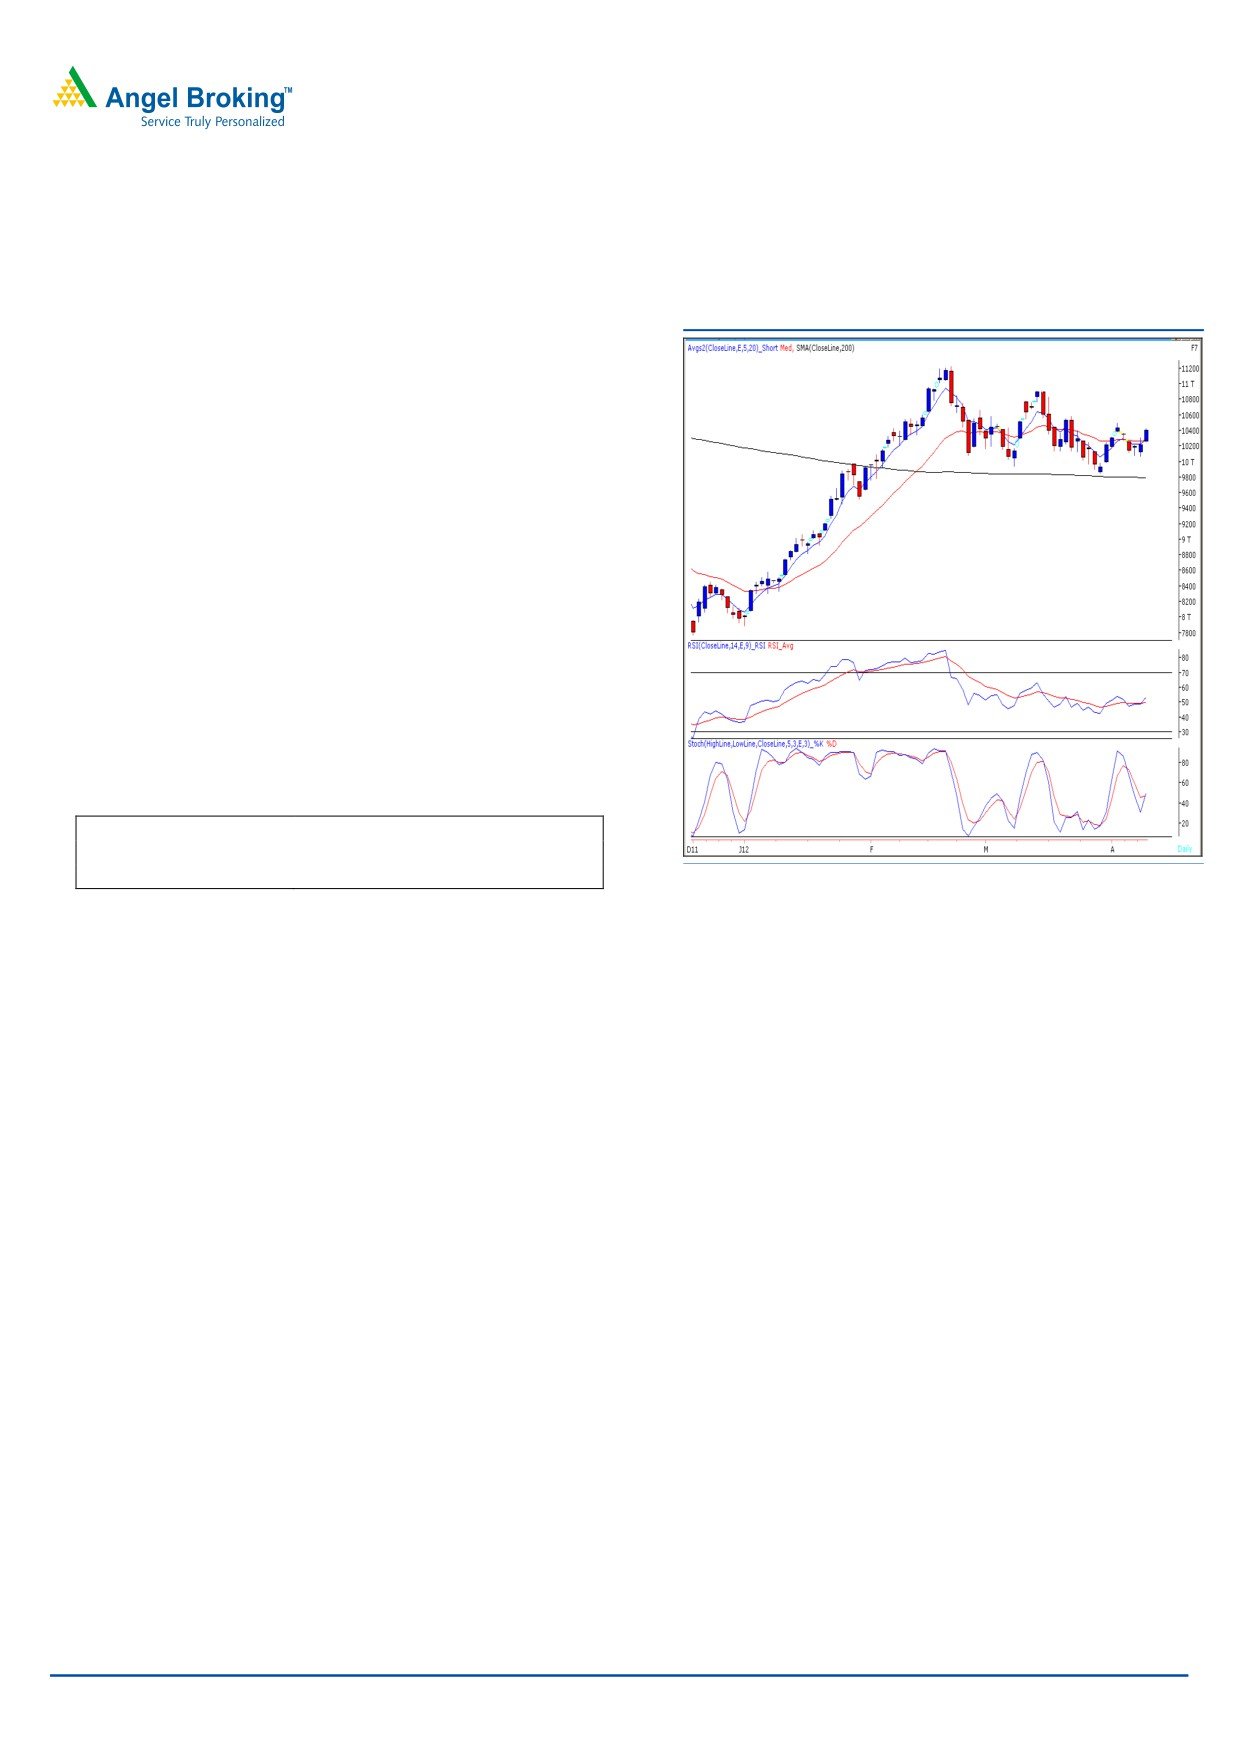
Bank Nifty Outlook - (10401)
Exhibit 2: Bank Nifty Daily Chart
Yesterday, Bank Nifty opened on an optimistic note and
gained strength as the day progressed to close near the
10400 level. On the daily chart, the momentum
oscillators, (RSI and Stochastic) have given a positive
crossover. However, on the hourly chart we are witnessing
narrow range body formations which suggest signs of
exhaustion if the bank nifty is unable to cross 10435
levels. Looking at the mixed picture from hourly and daily
chart we expect volatility to increase in coming trading
session. On the upside if the Bank nifty can sustain above
10435, it is likely to test 10520 - 10625 levels. On the
downside 10315 - 10250 levels may act as support.
Actionable points:
View
Positive above 10435
Target levels
10520-10625
Support Levels
10315 - 10250
Source: Falcon
For Private Circulation Only |
2
Technical Research | April 13, 2012
Positive Bias:
Positive
Expected
Stock Name
CMP
5 Day EMA
20 Day EMA
Remarks
Above
Target
BHEL
View will change below
257.5
257.5
263.9
258
264
253.9
For Private Circulation Only |
3
Technical Research | April 13, 2012
Daily Pivot Levels for Nifty 50 Stocks
SCRIPS
S2
S1
PIVOT
R1
R2
SENSEX
17,217
17,275
17,335
17,393
17,453
NIFTY
5,228
5,252
5,271
5,296
5,315
BANKNIFTY
10,179
10,290
10,361
10,472
10,544
ACC
1,232
1,256
1,270
1,294
1,308
AMBUJACEM
159
161
162
163
164
AXISBANK
1,148
1,172
1,188
1,212
1,227
BAJAJ-AUTO
1,620
1,629
1,640
1,649
1,660
BHARTIARTL
319
322
325
327
330
BHEL
252
255
256
259
260
BPCL
665
672
677
685
690
CAIRN
330
335
342
347
354
CIPLA
307
309
313
315
318
COALINDIA
330
331
334
335
338
DLF
193
196
201
204
208
DRREDDY
1,661
1,677
1,705
1,721
1,748
GAIL
352
356
358
361
363
HCLTECH
483
489
496
502
509
HDFC
670
675
678
683
687
HDFCBANK
520
525
530
535
540
HEROMOTOCO
1,955
1,991
2,013
2,050
2,072
HINDALCO
124
126
127
129
130
HINDUNILVR
412
417
419
424
427
ICICIBANK
863
871
878
886
893
IDFC
132
133
135
137
138
INFY
2,680
2,715
2,774
2,809
2,867
ITC
226
231
233
237
239
JINDALSTEL
468
490
502
524
537
JPASSOCIAT
78
79
80
81
82
KOTAKBANK
554
561
565
572
577
LT
1,277
1,284
1,295
1,303
1,314
M&M
684
690
696
701
707
MARUTI
1,262
1,287
1,301
1,327
1,341
NTPC
163
164
166
167
168
ONGC
257
259
263
265
269
PNB
889
901
912
924
935
POWERGRID
110
111
112
113
115
RANBAXY
475
490
499
514
523
RCOM
81
84
86
89
91
RELIANCE
728
736
741
748
753
RELINFRA
538
546
555
563
572
RPOWER
114
115
117
118
120
SAIL
93
93
94
95
96
SBIN
2,153
2,190
2,212
2,249
2,271
SESAGOA
179
182
184
187
189
SIEMENS
762
775
785
798
808
STER
102
102
103
103
105
SUNPHARMA
557
565
572
580
587
SUZLON
24
24
25
25
25
TATAMOTORS
282
284
286
288
290
TATAPOWER
101
102
104
105
106
TATASTEEL
444
449
453
457
461
TCS
1,117
1,125
1,136
1,143
1,155
WIPRO
432
436
441
444
450
Technical Research Team
For Private Circulation Only |
4
Technical Report
RESEARCH TEAM
Shardul Kulkarni
Head - Technicals
Sameet Chavan
Technical Analyst
Sacchitanand Uttekar
Technical Analyst
Mehul Kothari
Technical Analyst
Ankur Lakhotia
Technical Analyst
Research Team: 022-3952 6600
DISCLAIMER: This document is not for public distribution and has been furnished to you solely for your information and must not
be reproduced or redistributed to any other person. Persons into whose possession this document may come are required to observe
these restrictions.
Opinion expressed is our current opinion as of the date appearing on this material only. While we endeavor to update on a
reasonable basis the information discussed in this material, there may be regulatory, compliance, or other reasons that prevent us
from doing so. Prospective investors and others are cautioned that any forward-looking statements are not predictions and may be
subject to change without notice. Our proprietary trading and investment businesses may make investment decisions that are
inconsistent with the recommendations expressed herein.
The information in this document has been printed on the basis of publicly available information, internal data and other reliable
sources believed to be true and are for general guidance only. While every effort is made to ensure the accuracy and completeness of
information contained, the company takes no guarantee and assumes no liability for any errors or omissions of the information. No
one can use the information as the basis for any claim, demand or cause of action.
Recipients of this material should rely on their own investigations and take their own professional advice. Each recipient of this
document should make such investigations as it deems necessary to arrive at an independent evaluation of an investment in the
securities of companies referred to in this document (including the merits and risks involved), and should consult their own advisors to
determine the merits and risks of such an investment. Price and value of the investments referred to in this material may go up or
down. Past performance is not a guide for future performance. Certain transactions - futures, options and other derivatives as well as
non-investment grade securities - involve substantial risks and are not suitable for all investors. Reports based on technical analysis
centers on studying charts of a stock's price movement and trading volume, as opposed to focusing on a company's fundamentals
and as such, may not match with a report on a company's fundamentals.
We do not undertake to advise you as to any change of our views expressed in this document. While we would endeavor to update
the information herein on a reasonable basis, Angel Broking, its subsidiaries and associated companies, their directors and
employees are under no obligation to update or keep the information current. Also there may be regulatory, compliance, or other
reasons that may prevent Angel Broking and affiliates from doing so. Prospective investors and others are cautioned that any
forward-looking statements are not predictions and may be subject to change without notice.
Angel Broking Limited and affiliates, including the analyst who has issued this report, may, on the date of this report, and from time
to time, have long or short positions in, and buy or sell the securities of the companies mentioned herein or engage in any other
transaction involving such securities and earn brokerage or compensation or act as advisor or have other potential conflict of interest
with respect to company/ies mentioned herein or inconsistent with any recommendation and related information and opinions.
Angel Broking Limited and affiliates may seek to provide or have engaged in providing corporate finance, investment banking or
other advisory services in a merger or specific transaction to the companies referred to in this report, as on the date of this report or
in the past.
Sebi Registration No: INB 010996539
For Private Circulation Only |