Technical Research | March 13, 2012
Daily Technical Report
Sensex (17588) / NIFTY (5360)
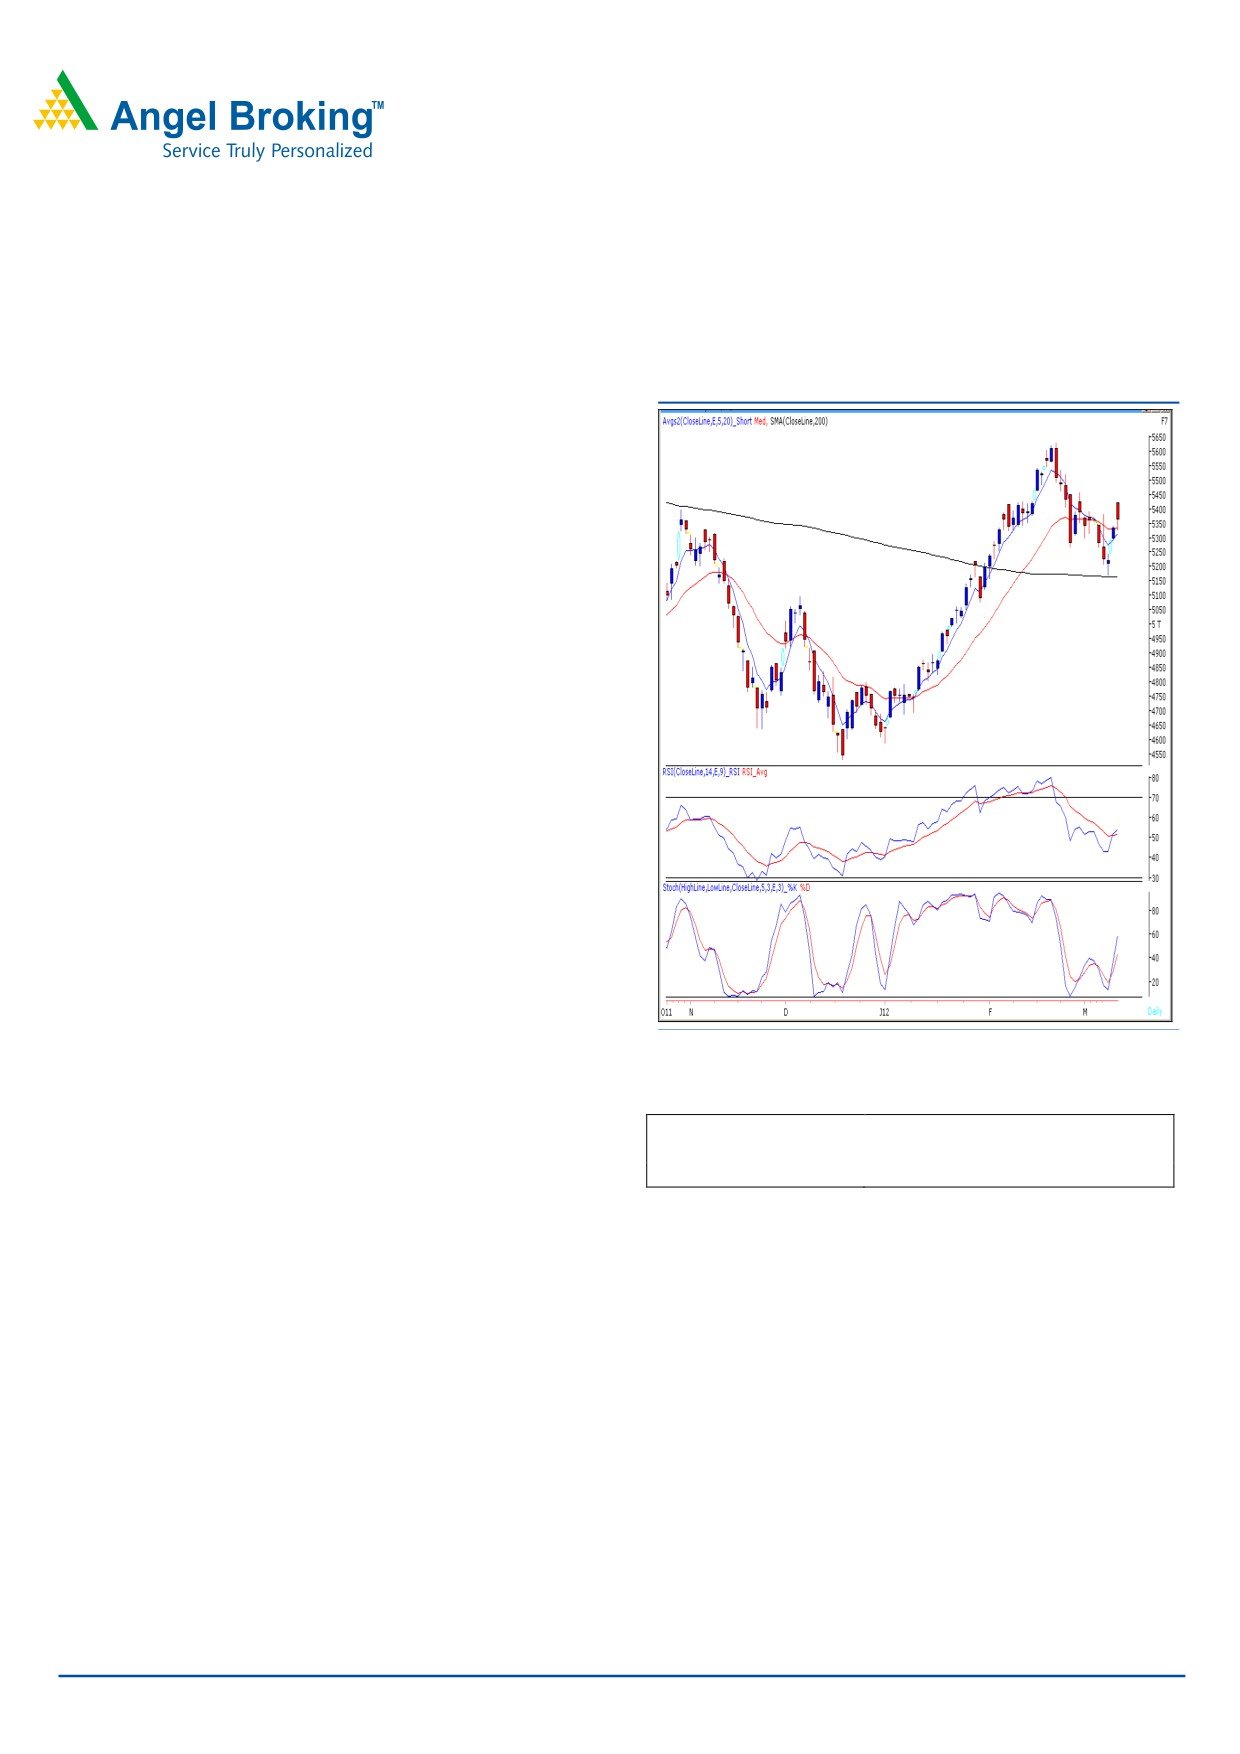
Exhibit 1: Nifty Daily Chart
The week began on an optimistic note in-line with strong
cues from other Asian markets but pared early gains to
close marginally in the positive territory. On the sectoral
front, the Capital Goods, Consumer Durable and Realty
sectors were among the major gainers whereas IT and Teck
counters ended on a losing side. The advance to decline
ratio was in favor of advancing counters. (A=1598
Formation:
• The 200-day SMA and 20-day EMA have now shifted to
17164 / 5163 and 17556 / 5330, respectively.
• The “20-Week EMA” is placed at 17120 / 5170 level.
• The Daily momentum oscillators viz., the RSI and the
Stochastic are positively poised.
• The weekly chart depicts a “Bullish Hammer” and
“Bullish Dragon Fly Doji” Japanese candlesticks pattern
in Sensex and Nifty, respectively.
Source: Falcon
Trading strategy:
Actionable points:
View
Bullish Above 5382
Indices opened higher during yesterday’s session and
Expected Targets
5459 - 5475
initially moved towards the immediate resistance level of
Support level
5327 - 5291
17692 / 5382. There is no significant change in the chart
structure and thus we would reiterate that 17692 / 5382
level remains to be a near term resistance for the markets.
A move beyond this level on the back of positive global
markets may push indices higher to test 18001 - 18250 /
5459 - 5538 levels. The immediate support is seen around
17494 - 17401 / 5327 - 5291 levels.
For Private Circulation Only |
1
Technical Research | March 13, 2012
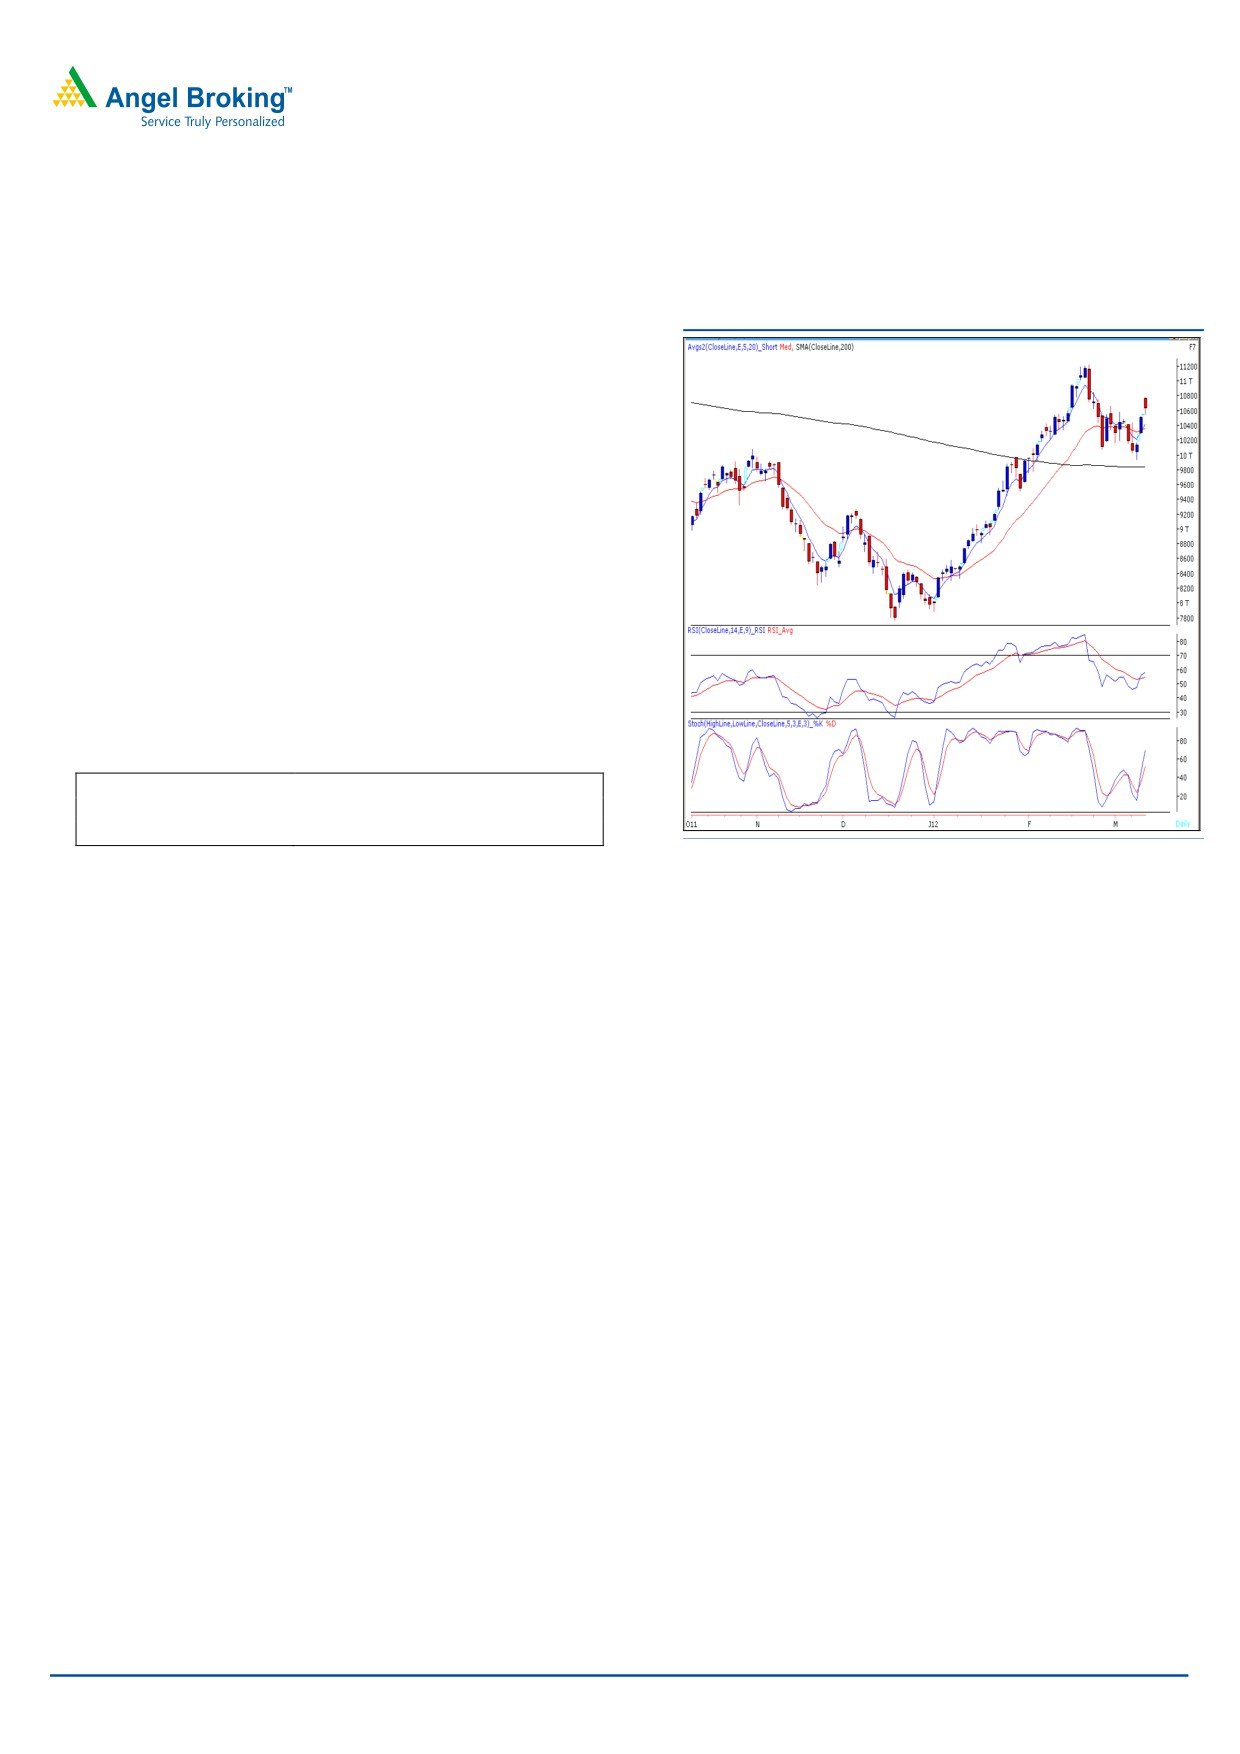
Bank Nifty Outlook - (10626)
Exhibit 2: Bank Nifty Daily Chart
Yesterday, for the second consecutive session Bank Nifty
opened with an upside but lost gains in the latter half of
the day. It was seen that the optimism on the back of a
75 bps CRR cut on Friday did not last long and the Index
witnessed profit booking. The positive crossover in “RSI”
and “Stochastic” momentum oscillator mentioned in our
previous report is still intact. The impact of the mentioned
crossover will come into force only if the index manages
to sustain above yesterday’s high of 10786. In this case
the index is likely to rally towards 10850 - 11035 levels.
On the downside 10543 - 10391 levels are likely to act
as support in coming trading session.
Actionable points:
View
Neutral
Resistance Levels
10786 - 10850
Support Levels
10543 - 10391
Source: Falcon
For Private Circulation Only |
2
Technical Report
RESEARCH TEAM
Shardul Kulkarni
Head - Technicals
Sameet Chavan
Technical Analyst
Sacchitanand Uttekar
Technical Analyst
Mehul Kothari
Technical Analyst
Ankur Lakhotia
Technical Analyst
Research Team: 022-3952 6600
DISCLAIMER: This document is not for public distribution and has been furnished to you solely for your information and must not
be reproduced or redistributed to any other person. Persons into whose possession this document may come are required to observe
these restrictions.
Opinion expressed is our current opinion as of the date appearing on this material only. While we endeavor to update on a
reasonable basis the information discussed in this material, there may be regulatory, compliance, or other reasons that prevent us
from doing so. Prospective investors and others are cautioned that any forward-looking statements are not predictions and may be
subject to change without notice. Our proprietary trading and investment businesses may make investment decisions that are
inconsistent with the recommendations expressed herein.
The information in this document has been printed on the basis of publicly available information, internal data and other reliable
sources believed to be true and are for general guidance only. While every effort is made to ensure the accuracy and completeness of
information contained, the company takes no guarantee and assumes no liability for any errors or omissions of the information. No
one can use the information as the basis for any claim, demand or cause of action.
Recipients of this material should rely on their own investigations and take their own professional advice. Each recipient of this
document should make such investigations as it deems necessary to arrive at an independent evaluation of an investment in the
securities of companies referred to in this document (including the merits and risks involved), and should consult their own advisors to
determine the merits and risks of such an investment. Price and value of the investments referred to in this material may go up or
down. Past performance is not a guide for future performance. Certain transactions - futures, options and other derivatives as well as
non-investment grade securities - involve substantial risks and are not suitable for all investors. Reports based on technical analysis
centers on studying charts of a stock's price movement and trading volume, as opposed to focusing on a company's fundamentals
and as such, may not match with a report on a company's fundamentals.
We do not undertake to advise you as to any change of our views expressed in this document. While we would endeavor to update
the information herein on a reasonable basis, Angel Broking, its subsidiaries and associated companies, their directors and
employees are under no obligation to update or keep the information current. Also there may be regulatory, compliance, or other
reasons that may prevent Angel Broking and affiliates from doing so. Prospective investors and others are cautioned that any
forward-looking statements are not predictions and may be subject to change without notice.
Angel Broking Limited and affiliates, including the analyst who has issued this report, may, on the date of this report, and from time
to time, have long or short positions in, and buy or sell the securities of the companies mentioned herein or engage in any other
transaction involving such securities and earn brokerage or compensation or act as advisor or have other potential conflict of interest
with respect to company/ies mentioned herein or inconsistent with any recommendation and related information and opinions.
Angel Broking Limited and affiliates may seek to provide or have engaged in providing corporate finance, investment banking or
other advisory services in a merger or specific transaction to the companies referred to in this report, as on the date of this report or
in the past.
Sebi Registration No : INB 010996539
For Private Circulation Only |