Technical Research | February 13, 2012
Daily Technical Report
Sensex (17749) / NIFTY (5382)
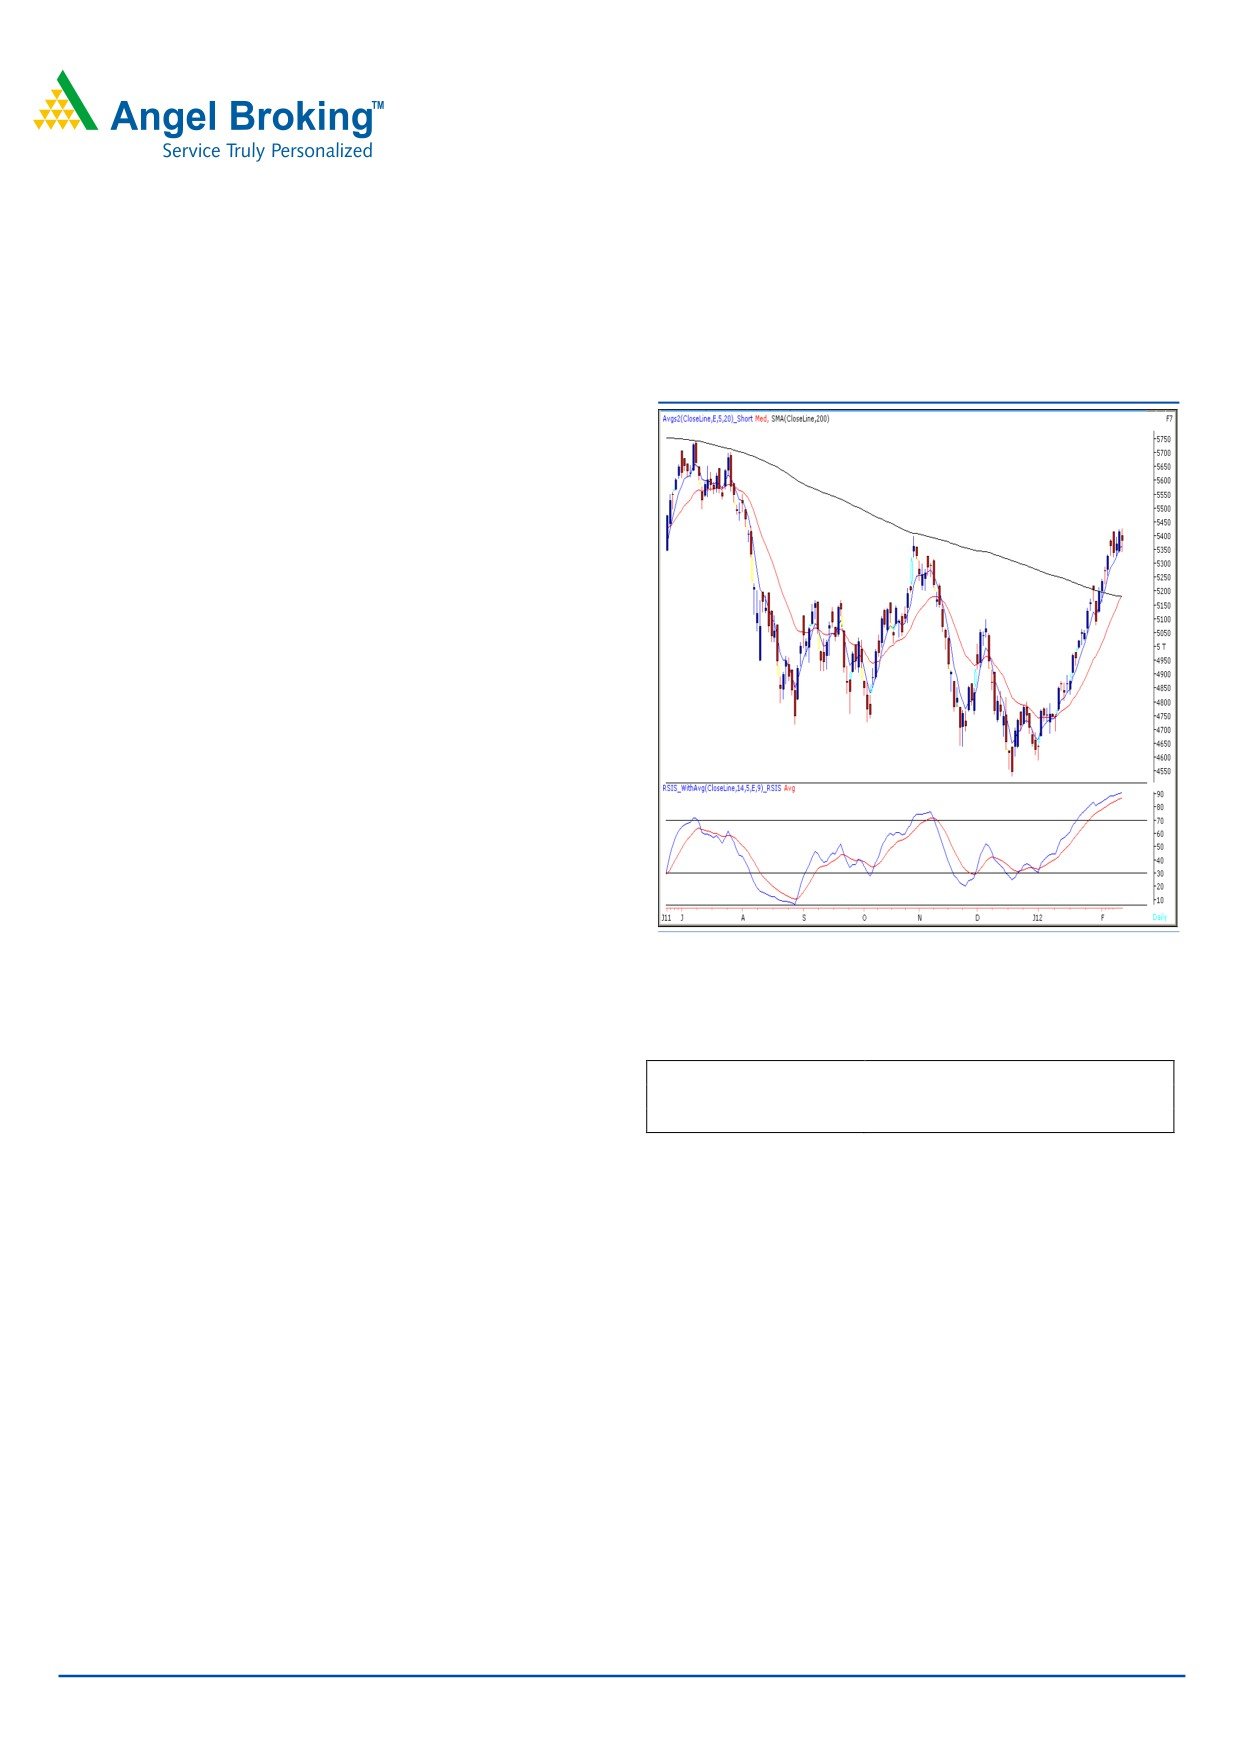
Exhibit 1: Nifty Daily Chart
On Friday, once again our indices traded in a range of
17582 - 18000 / 5322 - 5435 throughout the day.
However, we witnessed some selling pressure as soon as
indices drifted below 17800 / 5400 mark and finally closed
in the negative territory. On the sectoral front, most of the
sectors remained under pressure, whereas Metal counters
ended with a nominal gain. The advance to decline ratio
was marginally in favor of declining counters. (A=1435
Formation:
• On the Weekly chart, indices are hovering around the
“Horizontal Resistance Line” placed at 17908 / 5400
level.
• The Weekly chart depicts a “Doji” formation.
• The 200-day SMA and 20-day EMA are placed at
17235 / 5178 and 17160 / 5185, respectively.
Source: Falcon
• The “RSI-Smoothened” oscillator on the daily chart is
placed in extreme overbought territory.
Trading strategy:
Actionable points:
View
Negative Below 5322
Broadly speaking, last week markets traded in a narrow
Expected targets
5250 - 5185
range of 17579 - 17890 / 5322 - 5428, whereas, few of
Resistance level
5428
the individual stocks have outperformed indices. Markets
stuck in a range mainly due to extreme overbought
Conversely, the pattern will be negated on the violation
condition of momentum oscillators. We are now observing
of the high of “Doji”, which are 17890 / 5428. In this
that markets are hovering near the “Horizontal Resistance
scenario, indices may move higher to test the next
Line” placed at 17908 / 5400 level (Refer Exhibit 1). Also,
resistance level of 18440 - 18932 / 5552 - 5702.
the current weekly candle is known as “Doji” pattern, which
We advise traders to stay light on positions and trade
indicates lack of confidence and uncertainty among market
with strict stop losses.
participants. The said pattern has a minor bearish
implication and requires confirmation. The negative outlook
will be confirmed only if indices sustain below the low of
17579 / 5322. In this case, we may witness a corrective
move up to 17200 - 17000 / 5250 - 5185 levels, which
also coincides with the support zone of 200-Day EMA and
20-day EMA.
For Private Circulation Only |
1
Technical Research | February 13, 2012
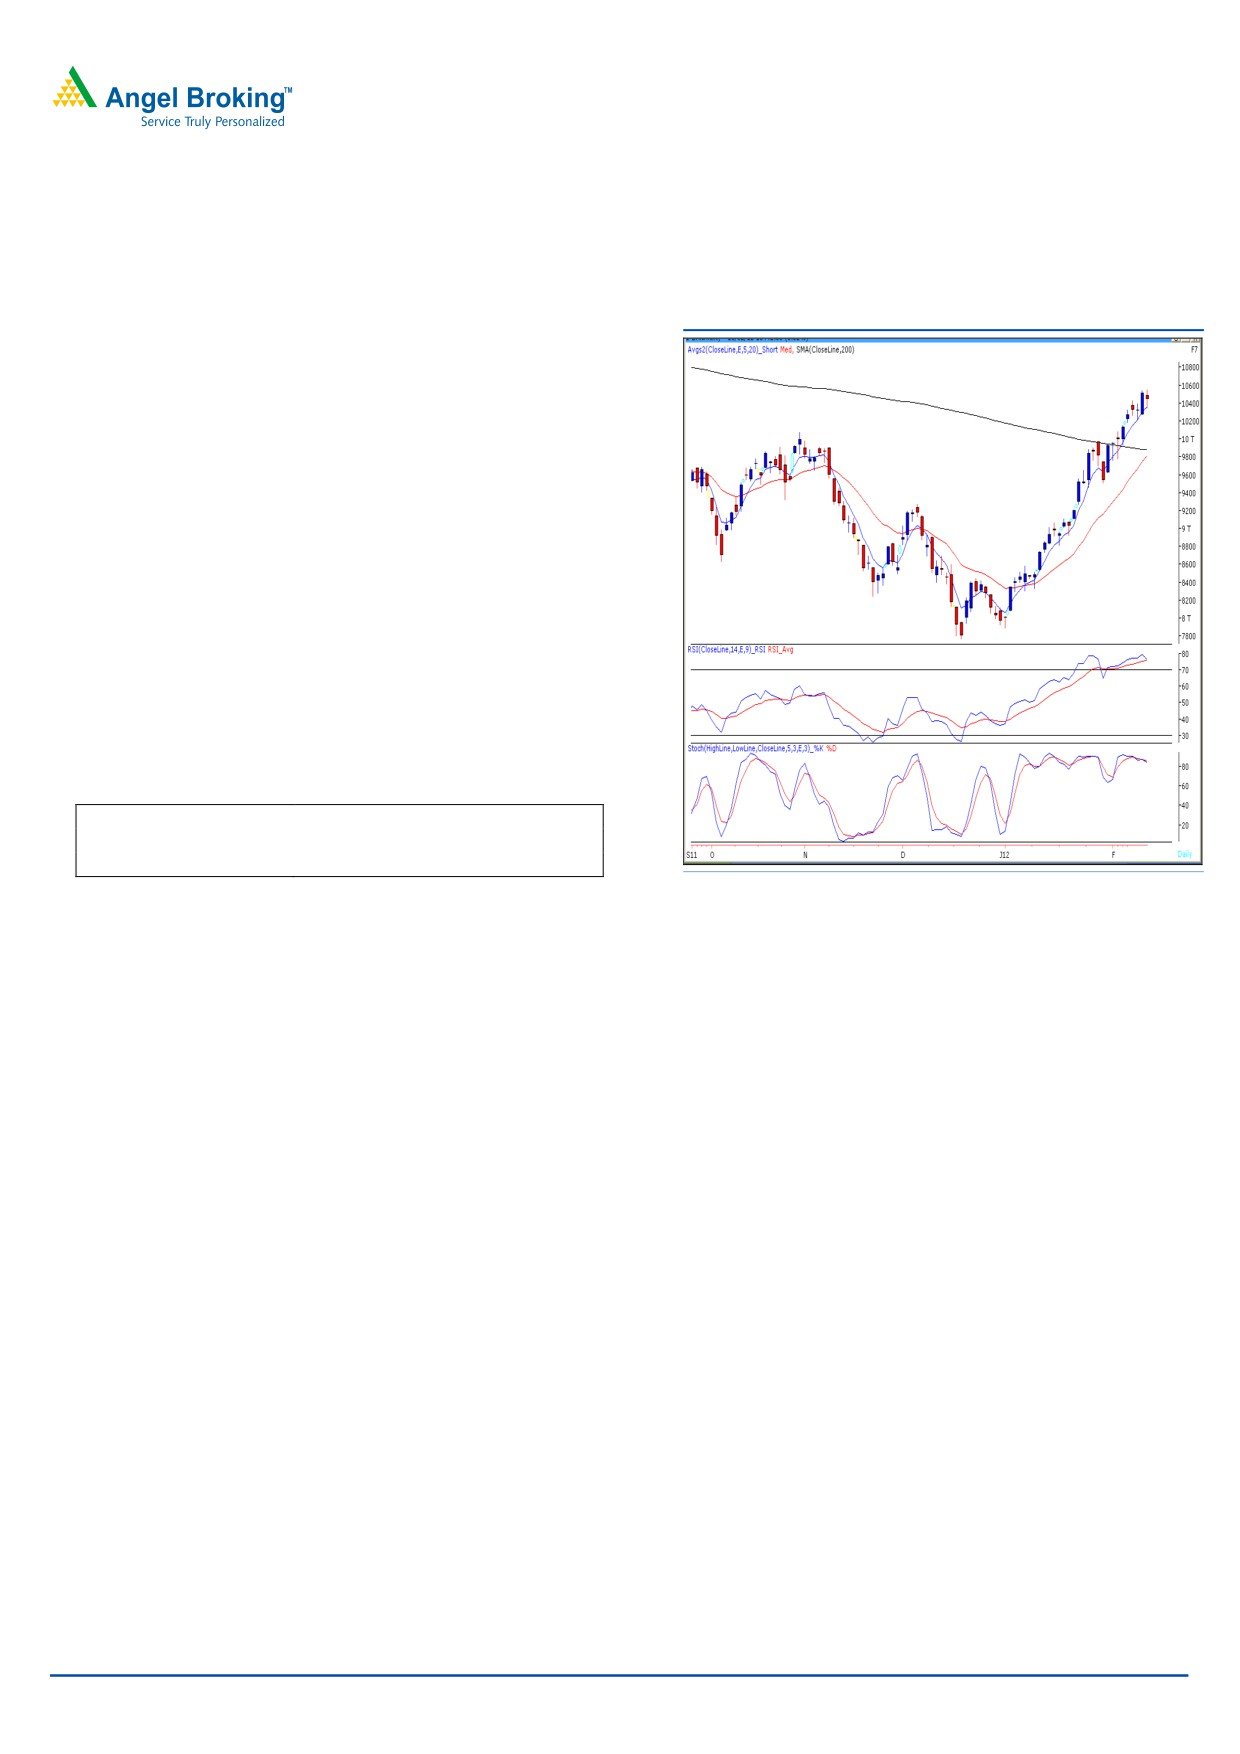
Bank Nifty Outlook - (10443)
Exhibit 2: Bank Nifty Daily Chart
On Friday, Bank Nifty opened on a flat note and traded
with extreme volatility throughout the session to close
marginally below the initial opening level. We are now
witnessing a “Bearish Harami” candle stick pattern on the
daily chart which is a reversal pattern but requires a
confirmation. We reiterate our view, that the momentum
oscillators are placed in an extreme overbought condition
and a possibility of correction cannot be ruled out.
Therefore, if the index manages to sustain below Friday’s
low of 10344 then it is likely to drift towards 10183 -
10150 levels. On the upside, 10528 - 10555 levels are
likely to act as resistance in coming trading session. The
said pattern will be negated only if Bank Nifty manages to
close above 10555.
Actionable points:
View
Negative Below 10344
Expected Target
10183 - 10150
Resistance levels
10528 - 10555
Source: Falcon
For Private Circulation Only |
2
Technical Research | February 13, 2012
Positive Bias:
Expected
Stock Name
CMP
5 Day EMA
20 Day EMA
Remarks
Target
Dabur
103
99.9
97.7
109
View will change below 97
Negative Bias:
Expected
Stock Name
CMP
5 Day EMA
20 Day EMA
Remarks
Target
Aurobindo
110.65
115.3
110.3
104
View will change above 118.4
pharma
For Private Circulation Only |
3
Technical Research | February 13, 2012
Daily Pivot Levels for Nifty 50 Stocks
SCRIPS
S2
S1
PIVOT
R1
R2
SENSEX
17,492
17,621
17,755
17,883
18,018
NIFTY
5,297
5,339
5,383
5,426
5,470
BANKNIFTY
10,236
10,340
10,447
10,550
10,658
ACC
1,283
1,315
1,368
1,400
1,454
AMBUJACEM
165
169
174
177
182
AXISBANK
1,079
1,099
1,121
1,141
1,163
BAJAJ-AUTO
1,682
1,709
1,729
1,756
1,776
BHARTIARTL
342
346
352
356
361
BHEL
255
258
261
264
267
BPCL
568
583
606
621
643
CAIRN
360
367
378
384
395
CIPLA
343
346
350
353
357
COALINDIA
324
328
331
335
339
DLF
219
225
230
236
240
DRREDDY
1,597
1,610
1,627
1,640
1,657
GAIL
376
381
386
391
397
HCLTECH
458
463
467
472
476
HDFC
666
680
690
704
714
HDFCBANK
507
512
519
524
531
HEROMOTOCO
1,912
1,941
1,983
2,012
2,053
HINDALCO
147
150
155
158
162
HINDUNILVR
380
384
389
393
399
ICICIBANK
906
918
929
941
951
IDFC
125
129
135
140
145
INFY
2,730
2,760
2,781
2,811
2,832
ITC
201
202
204
205
206
JINDALSTEL
583
593
604
615
625
JPASSOCIAT
73
75
77
79
82
KOTAKBANK
531
539
549
557
567
LT
1,316
1,333
1,354
1,372
1,393
M&M
668
680
696
708
724
MARUTI
1,210
1,227
1,251
1,268
1,291
NTPC
177
179
180
182
183
ONGC
274
278
283
287
293
PNB
981
995
1,009
1,022
1,037
POWERGRID
104
106
108
109
111
RANBAXY
430
436
447
453
464
RCOM
90
92
94
96
99
RELIANCE
826
835
847
856
868
RELINFRA
550
561
577
589
605
RPOWER
99
102
105
109
112
SAIL
106
109
112
116
118
SBIN
2,118
2,145
2,177
2,204
2,236
SESAGOA
218
227
234
243
251
SIEMENS
770
780
790
801
811
STER
123
126
129
132
135
SUNPHARMA
534
538
542
545
549
SUZLON
29
30
31
32
34
TATAMOTORS
252
255
258
261
265
TATAPOWER
106
109
112
114
117
TATASTEEL
416
446
462
491
508
TCS
1,202
1,218
1,228
1,244
1,254
WIPRO
438
443
447
453
456
Technical Research Team
For Private Circulation Only |
4
Technical Report
RESEARCH TEAM
Shardul Kulkarni
Head - Technicals
Sameet Chavan
Technical Analyst
Sacchitanand Uttekar
Technical Analyst
Mehul Kothari
Technical Analyst
Ankur Lakhotia
Technical Analyst
Research Team: 022-3952 6600
DISCLAIMER: This document is not for public distribution and has been furnished to you solely for your information and must not
be reproduced or redistributed to any other person. Persons into whose possession this document may come are required to observe
these restrictions.
Opinion expressed is our current opinion as of the date appearing on this material only. While we endeavor to update on a
reasonable basis the information discussed in this material, there may be regulatory, compliance, or other reasons that prevent us
from doing so. Prospective investors and others are cautioned that any forward-looking statements are not predictions and may be
subject to change without notice. Our proprietary trading and investment businesses may make investment decisions that are
inconsistent with the recommendations expressed herein.
The information in this document has been printed on the basis of publicly available information, internal data and other reliable
sources believed to be true and are for general guidance only. While every effort is made to ensure the accuracy and completeness of
information contained, the company takes no guarantee and assumes no liability for any errors or omissions of the information. No
one can use the information as the basis for any claim, demand or cause of action.
Recipients of this material should rely on their own investigations and take their own professional advice. Each recipient of this
document should make such investigations as it deems necessary to arrive at an independent evaluation of an investment in the
securities of companies referred to in this document (including the merits and risks involved), and should consult their own advisors to
determine the merits and risks of such an investment. Price and value of the investments referred to in this material may go up or
down. Past performance is not a guide for future performance. Certain transactions - futures, options and other derivatives as well as
non-investment grade securities - involve substantial risks and are not suitable for all investors. Reports based on technical analysis
centers on studying charts of a stock's price movement and trading volume, as opposed to focusing on a company's fundamentals
and as such, may not match with a report on a company's fundamentals.
We do not undertake to advise you as to any change of our views expressed in this document. While we would endeavor to update
the information herein on a reasonable basis, Angel Broking, its subsidiaries and associated companies, their directors and
employees are under no obligation to update or keep the information current. Also there may be regulatory, compliance, or other
reasons that may prevent Angel Broking and affiliates from doing so. Prospective investors and others are cautioned that any
forward-looking statements are not predictions and may be subject to change without notice.
Angel Broking Limited and affiliates, including the analyst who has issued this report, may, on the date of this report, and from time
to time, have long or short positions in, and buy or sell the securities of the companies mentioned herein or engage in any other
transaction involving such securities and earn brokerage or compensation or act as advisor or have other potential conflict of interest
with respect to company/ies mentioned herein or inconsistent with any recommendation and related information and opinions.
Angel Broking Limited and affiliates may seek to provide or have engaged in providing corporate finance, investment banking or
other advisory services in a merger or specific transaction to the companies referred to in this report, as on the date of this report or
in the past.
Sebi Registration No : INB 010996539
For Private Circulation Only |