Technical Research | January 13, 2012
Daily Technical Report
Sensex (16038) / NIFTY (4831)
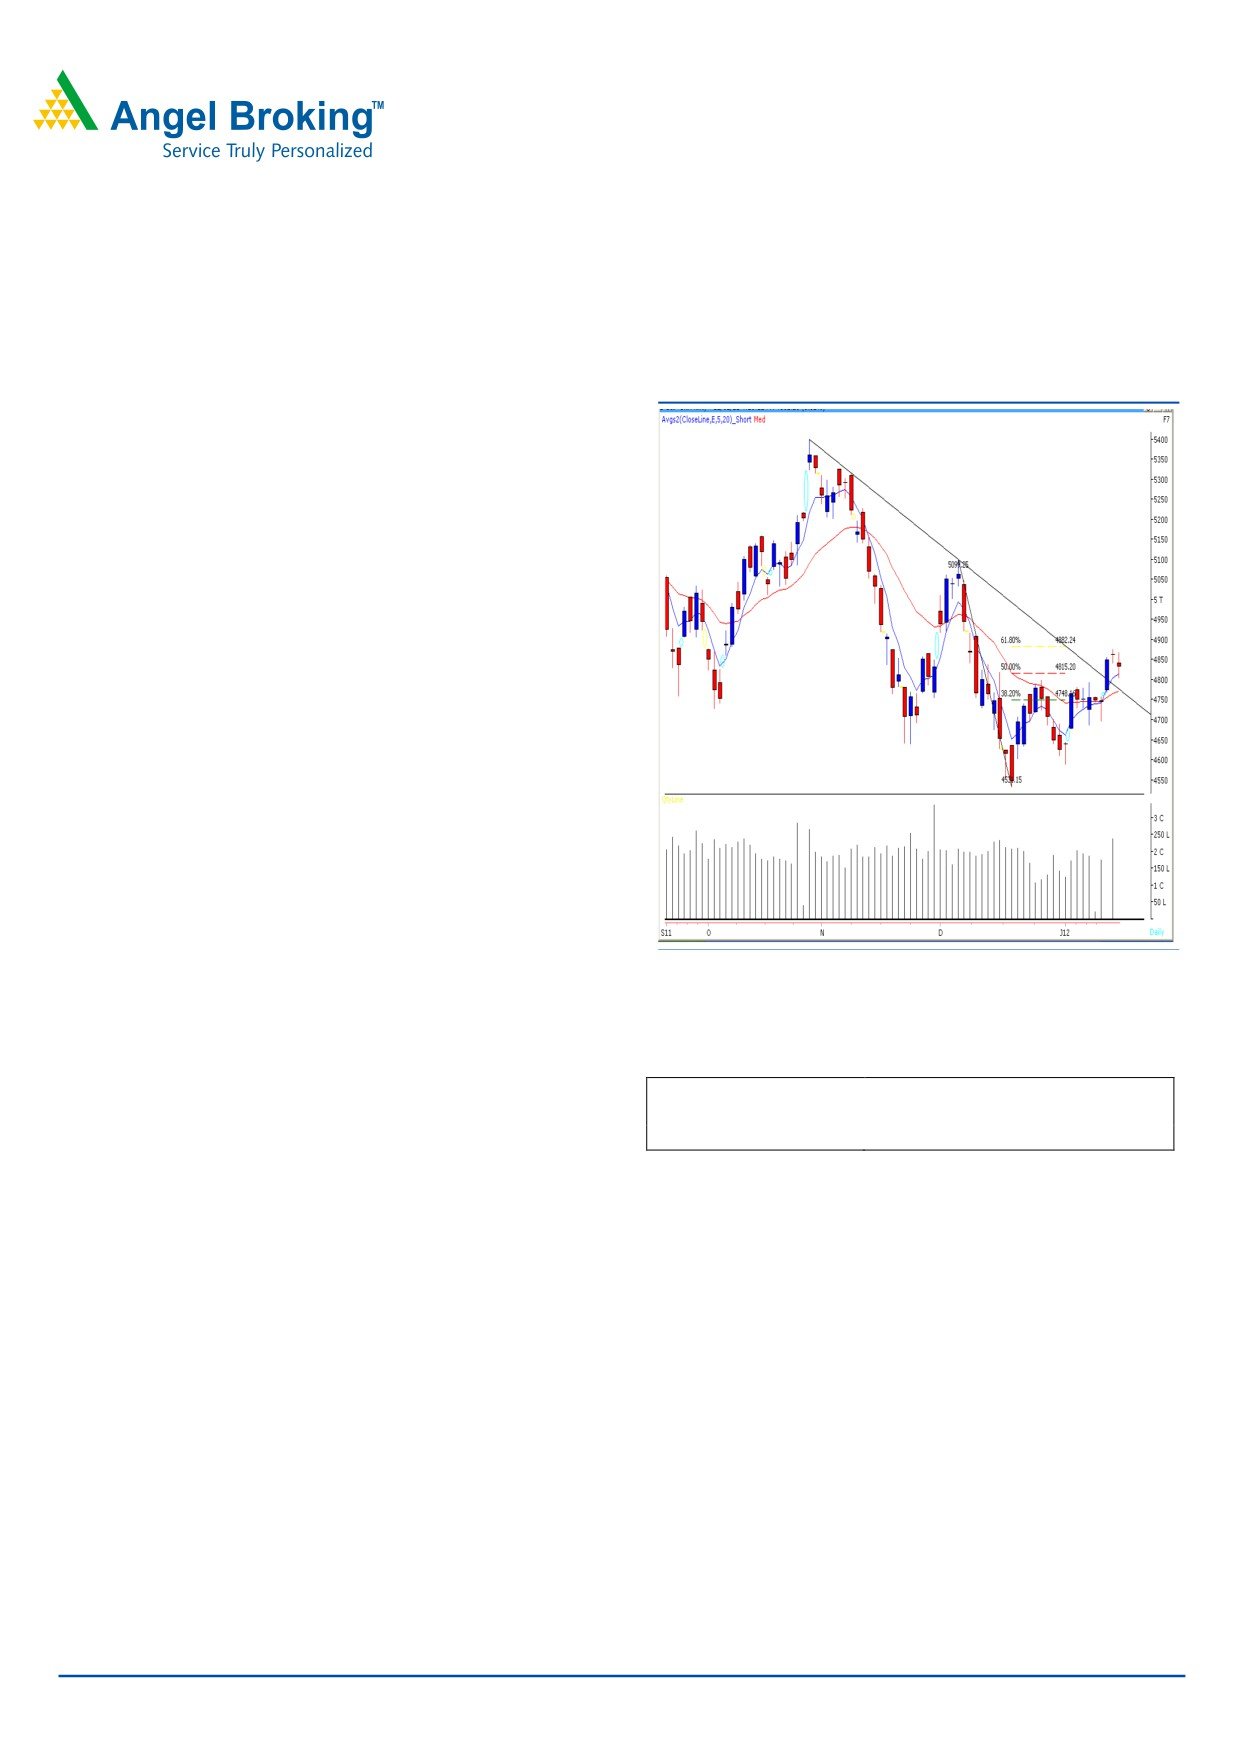
Exhibit 1: Nifty Daily Chart
Yesterday, markets opened on a pessimistic note in-line
with global cues. Selling pressure was seen during the first
half and indices tested mentioned support level of 16030 /
4800. A bounce from the lows during the second half of the
session led indices to close marginally in the negative
territory. On the sectoral front, IT, Teck and Oil & Gas
sectors corrected sharply in yesterday’s session, whereas
Power, Metal and Banking counters ended on a gaining
side. The advance to decline ratio was in favor of gaining
Formation:
• On the Daily chart, we are now witnessing a breakout
from the “Downward Sloping Trend Line” resistance around
16070 / 4820 level.
• The 61.8% Fibonacci retracement level of the fall from
17004 to 15135 / 5100 to 4531 is at 16286 / 4881.
Source: Falcon
• The 20 Day EMA is placed at 15915 / 4771level.
Actionable points:
Trading strategy:
View
Positive Above 4881
Expected Targets
4920 - 4976
After a gap down opening, indices remained under
Support levels
4841 - 4820
pressure during the first half and breached Wednesday’s
low of 16127 / 4841 to test mentioned support level of
16030 / 4800. Reduction in the guidance given by Infosys
(Dollar terms) led the slide in IT counters but the positive
IIP numbers provided the bulls some reason to cheer.
Going forward, 16030 / 4800 level remains to be a decent
psychological support. A move below this level may drag
indices towards the 20 Day EMA support level of 15915/
4771. On the upside, the positive momentum may resume
only if indices sustain above the key resistance level of
16286 / 4881. In this case, indices are likely to rally
towards 16421 - 16600 / 4920 - 4976 levels.
For Private Circulation Only |
1
Technical Research | January 13, 2012
Bank Nifty Outlook - (8930)
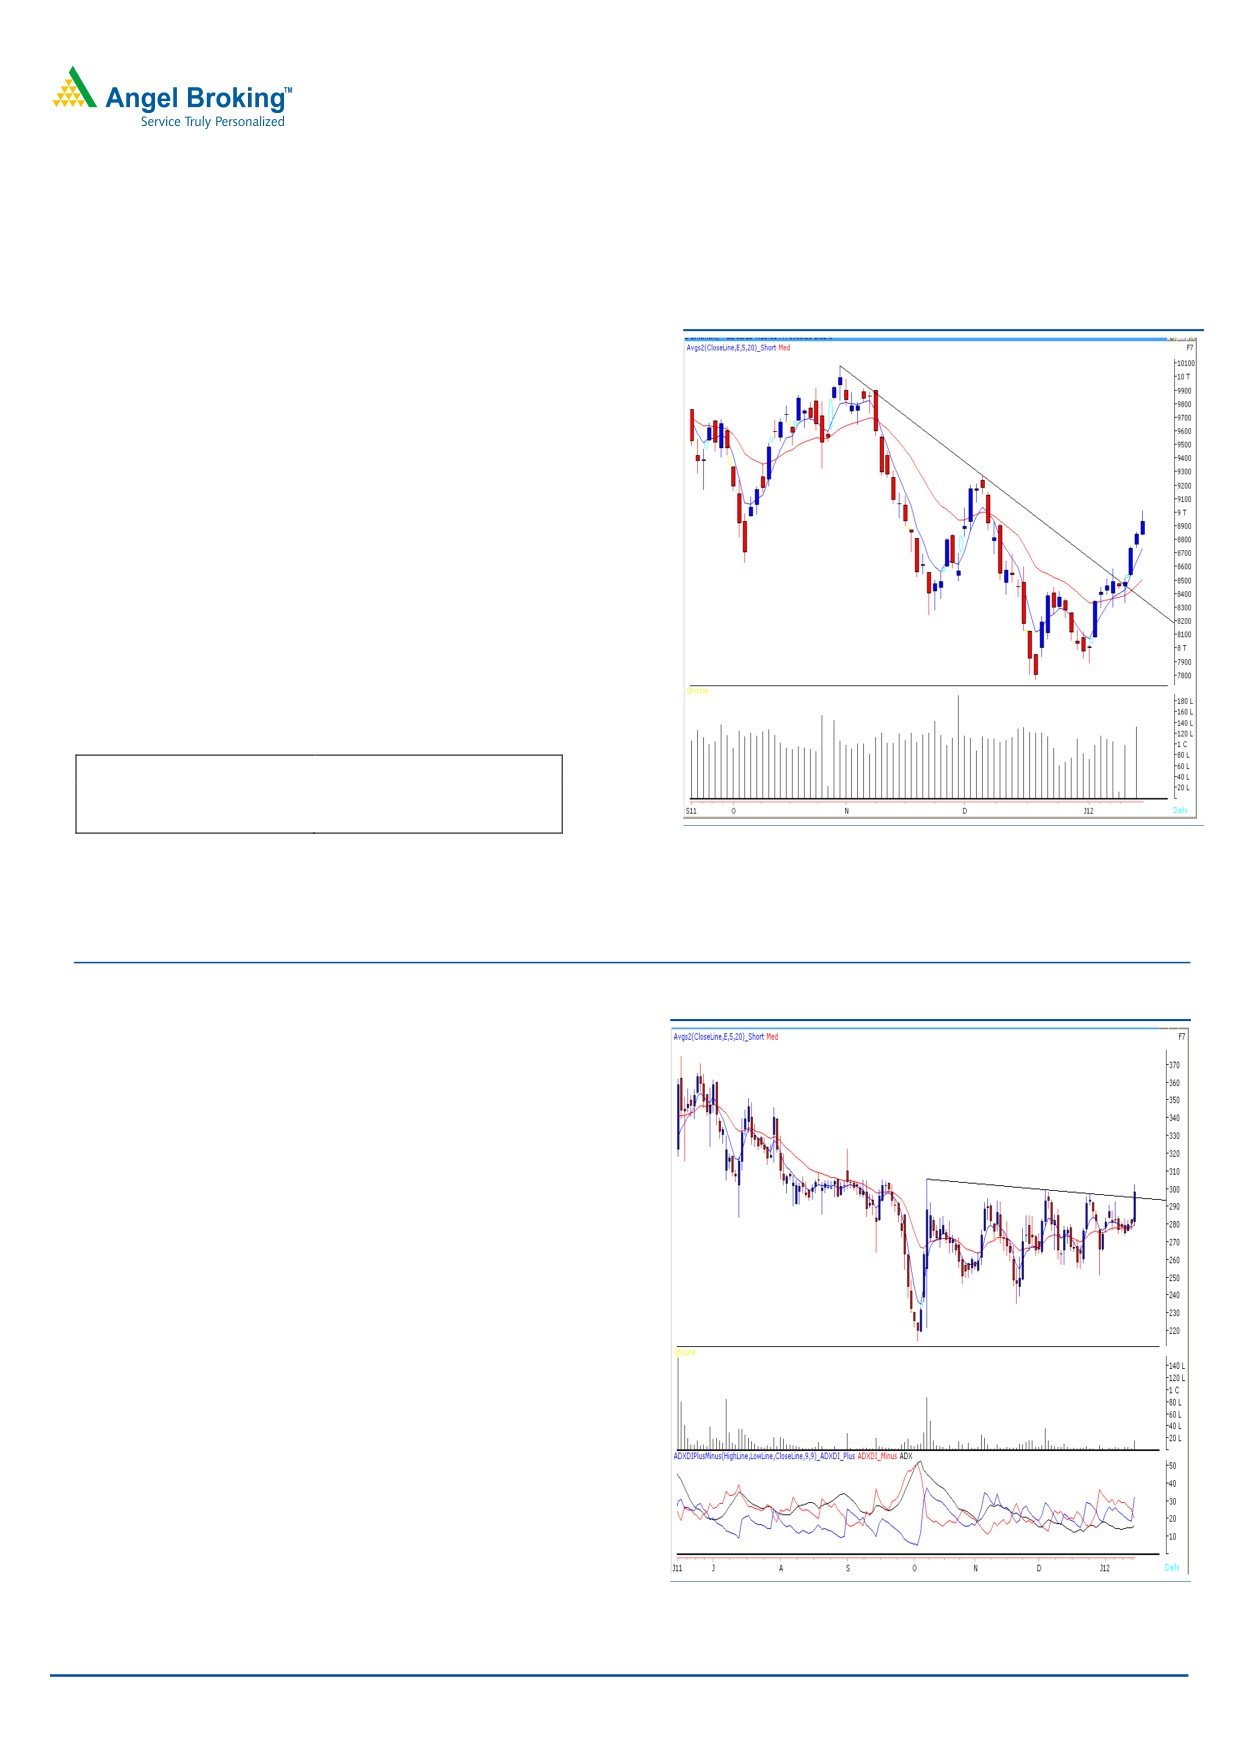
Exhibit 2: Bank Nifty Daily Chart
Yesterday, Bank Nifty opened on an optimistic note and
traded with positive bias throughout the session to close
marginally below the mentioned resistance level of 8950.
The positive crossover in “ADX (14)” indicator mentioned in
our previous reports is still intact. In case of individual large
cap banking majors, we are witnessing that the weekly
charts are giving the first signs of a sustainable move on the
upside. Therefore, if Bank Nifty sustains above yesterday’s
high of 9015, then it is likely to test 9105 - 9166 levels.
However, on the downside, if the index falls below 8848
level, then it is likely to undergo a minor correction and may
test 8743 - 8700 levels.
Actionable points:
View
Positive Above 9015
Expected Target
9105 - 9166
Support Levels
8848 - 8743 - 8700
Source: Falcon
Stock Recommendations:
Exhibit 3: SUN TV Network Ltd (NSE Cash)
Stock - SUN TV Network Ltd (NSE Cash)
Action - Buy
Last close
` 297.75
Buy Above
` 302.50
Stop Loss
` 288
Target
` 336
Justification - On the Weekly chart, we have observed that
after consolidating in the range of ` 250 - ` 300 for more
than two months, yesterday the stock has given a breakout
above ` 300 with impressive volumes. Also, the momentum
oscillators on the Daily and Monthly chart are suggesting
momentum to continue on the upside. In addition, we are
witnessing a positive crossover in Daily “ADX (9)” indicator.
Hence, we advise buying the stock ONLY above ` 302.5 for
a target of ` 336 in coming 8 - 10 trading sessions.
Source: Falcon
For Private Circulation Only |
2
Technical Research | January 13, 2012
Positive Bias:
Expected
Stock Name
CMP
5 Day EMA
20 Day EMA
Remarks
Target
United Spirits
576.5
544.9
566
620
View will change below 559
Negative Bias:
Expected
Stock Name
CMP
5 Day EMA
20 Day EMA
Remarks
Target
Biocon
264.2
271.5
276.6
240
View will change above 285
Bata
561.3
568.8
565.3
520
View will change above 608
For Private Circulation Only |
3
Technical Research | January 13, 2012
Daily Pivot Levels for Nifty 50 Stocks
SCRIPS
S2
S1
PIVOT
R1
R2
SENSEX
15,844
15,941
16,060
16,157
16,276
NIFTY
4,769
4,800
4,835
4,866
4,900
BANKNIFTY
8,740
8,835
8,925
9,020
9,110
ACC
1,101
1,111
1,119
1,129
1,137
AMBUJACEM
148
149
151
152
153
AXISBANK
904
922
945
964
987
BAJAJ-AUTO
1,444
1,460
1,473
1,489
1,502
BHARTIARTL
321
324
327
330
333
BHEL
255
259
265
269
276
BPCL
494
503
510
519
525
CAIRN
317
323
328
333
338
CIPLA
334
336
341
343
348
DLF
186
189
192
195
199
DRREDDY
1,632
1,645
1,657
1,670
1,683
GAIL
379
382
385
388
391
HCLTECH
395
400
408
413
421
HDFC
654
671
686
703
718
HDFCBANK
458
462
466
470
474
HEROMOTOCO
1,765
1,789
1,806
1,830
1,847
HINDALCO
127
130
132
135
137
HINDUNILVR
385
389
393
398
402
ICICIBANK
761
771
784
794
807
IDFC
103
106
108
111
113
INFY
2,467
2,528
2,639
2,699
2,811
ITC
202
203
204
206
207
JINDALSTEL
478
482
489
494
501
JPASSOCIAT
55
57
58
60
61
KOTAKBANK
452
460
469
476
485
LT
1,095
1,113
1,143
1,161
1,191
M&M
665
676
682
693
699
MARUTI
968
981
995
1,008
1,022
NTPC
158
160
161
162
164
ONGC
253
256
259
261
264
PNB
861
882
896
916
930
POWERGRID
99
100
100
101
102
RANBAXY
434
442
449
458
465
RCOM
79
81
82
84
86
RELCAPITAL
271
276
281
286
292
RELIANCE
720
729
741
749
761
RELINFRA
390
397
404
411
418
RPOWER
79
81
83
85
86
SAIL
89
90
92
93
94
SBIN
1,698
1,731
1,754
1,787
1,810
SESAGOA
172
179
183
191
195
SIEMENS
681
699
719
737
758
STER
98
100
102
104
105
SUNPHARMA
510
515
520
525
531
SUZLON
20
20
21
21
22
TATAMOTORS
199
203
206
210
213
TATAPOWER
91
93
94
96
97
TATASTEEL
376
382
387
394
399
TCS
1,045
1,067
1,091
1,113
1,137
WIPRO
376
383
390
398
405
Technical Research Team
For Private Circulation Only |
4
Technical Report
RESEARCH TEAM
Shardul Kulkarni
Head - Technicals
Sameet Chavan
Technical Analyst
Sacchitanand Uttekar
Technical Analyst
Mehul Kothari
Technical Analyst
Ankur Lakhotia
Technical Analyst
Research Team: 022-3952 6600
DISCLAIMER: This document is not for public distribution and has been furnished to you solely for your information and must not
be reproduced or redistributed to any other person. Persons into whose possession this document may come are required to observe
these restrictions.
Opinion expressed is our current opinion as of the date appearing on this material only. While we endeavor to update on a
reasonable basis the information discussed in this material, there may be regulatory, compliance, or other reasons that prevent us
from doing so. Prospective investors and others are cautioned that any forward-looking statements are not predictions and may be
subject to change without notice. Our proprietary trading and investment businesses may make investment decisions that are
inconsistent with the recommendations expressed herein.
The information in this document has been printed on the basis of publicly available information, internal data and other reliable
sources believed to be true and are for general guidance only. While every effort is made to ensure the accuracy and completeness of
information contained, the company takes no guarantee and assumes no liability for any errors or omissions of the information. No
one can use the information as the basis for any claim, demand or cause of action.
Recipients of this material should rely on their own investigations and take their own professional advice. Each recipient of this
document should make such investigations as it deems necessary to arrive at an independent evaluation of an investment in the
securities of companies referred to in this document (including the merits and risks involved), and should consult their own advisors to
determine the merits and risks of such an investment. Price and value of the investments referred to in this material may go up or
down. Past performance is not a guide for future performance. Certain transactions - futures, options and other derivatives as well as
non-investment grade securities - involve substantial risks and are not suitable for all investors. Reports based on technical analysis
centers on studying charts of a stock's price movement and trading volume, as opposed to focusing on a company's fundamentals
and as such, may not match with a report on a company's fundamentals.
We do not undertake to advise you as to any change of our views expressed in this document. While we would endeavor to update
the information herein on a reasonable basis, Angel Broking, its subsidiaries and associated companies, their directors and
employees are under no obligation to update or keep the information current. Also there may be regulatory, compliance, or other
reasons that may prevent Angel Broking and affiliates from doing so. Prospective investors and others are cautioned that any
forward-looking statements are not predictions and may be subject to change without notice.
Angel Broking Limited and affiliates, including the analyst who has issued this report, may, on the date of this report, and from time
to time, have long or short positions in, and buy or sell the securities of the companies mentioned herein or engage in any other
transaction involving such securities and earn brokerage or compensation or act as advisor or have other potential conflict of interest
with respect to company/ies mentioned herein or inconsistent with any recommendation and related information and opinions.
Angel Broking Limited and affiliates may seek to provide or have engaged in providing corporate finance, investment banking or
other advisory services in a merger or specific transaction to the companies referred to in this report, as on the date of this report or
in the past.
Sebi Registration No : INB 010996539
For Private Circulation Only |