Technical Research | December 13, 2011
Daily Technical Report
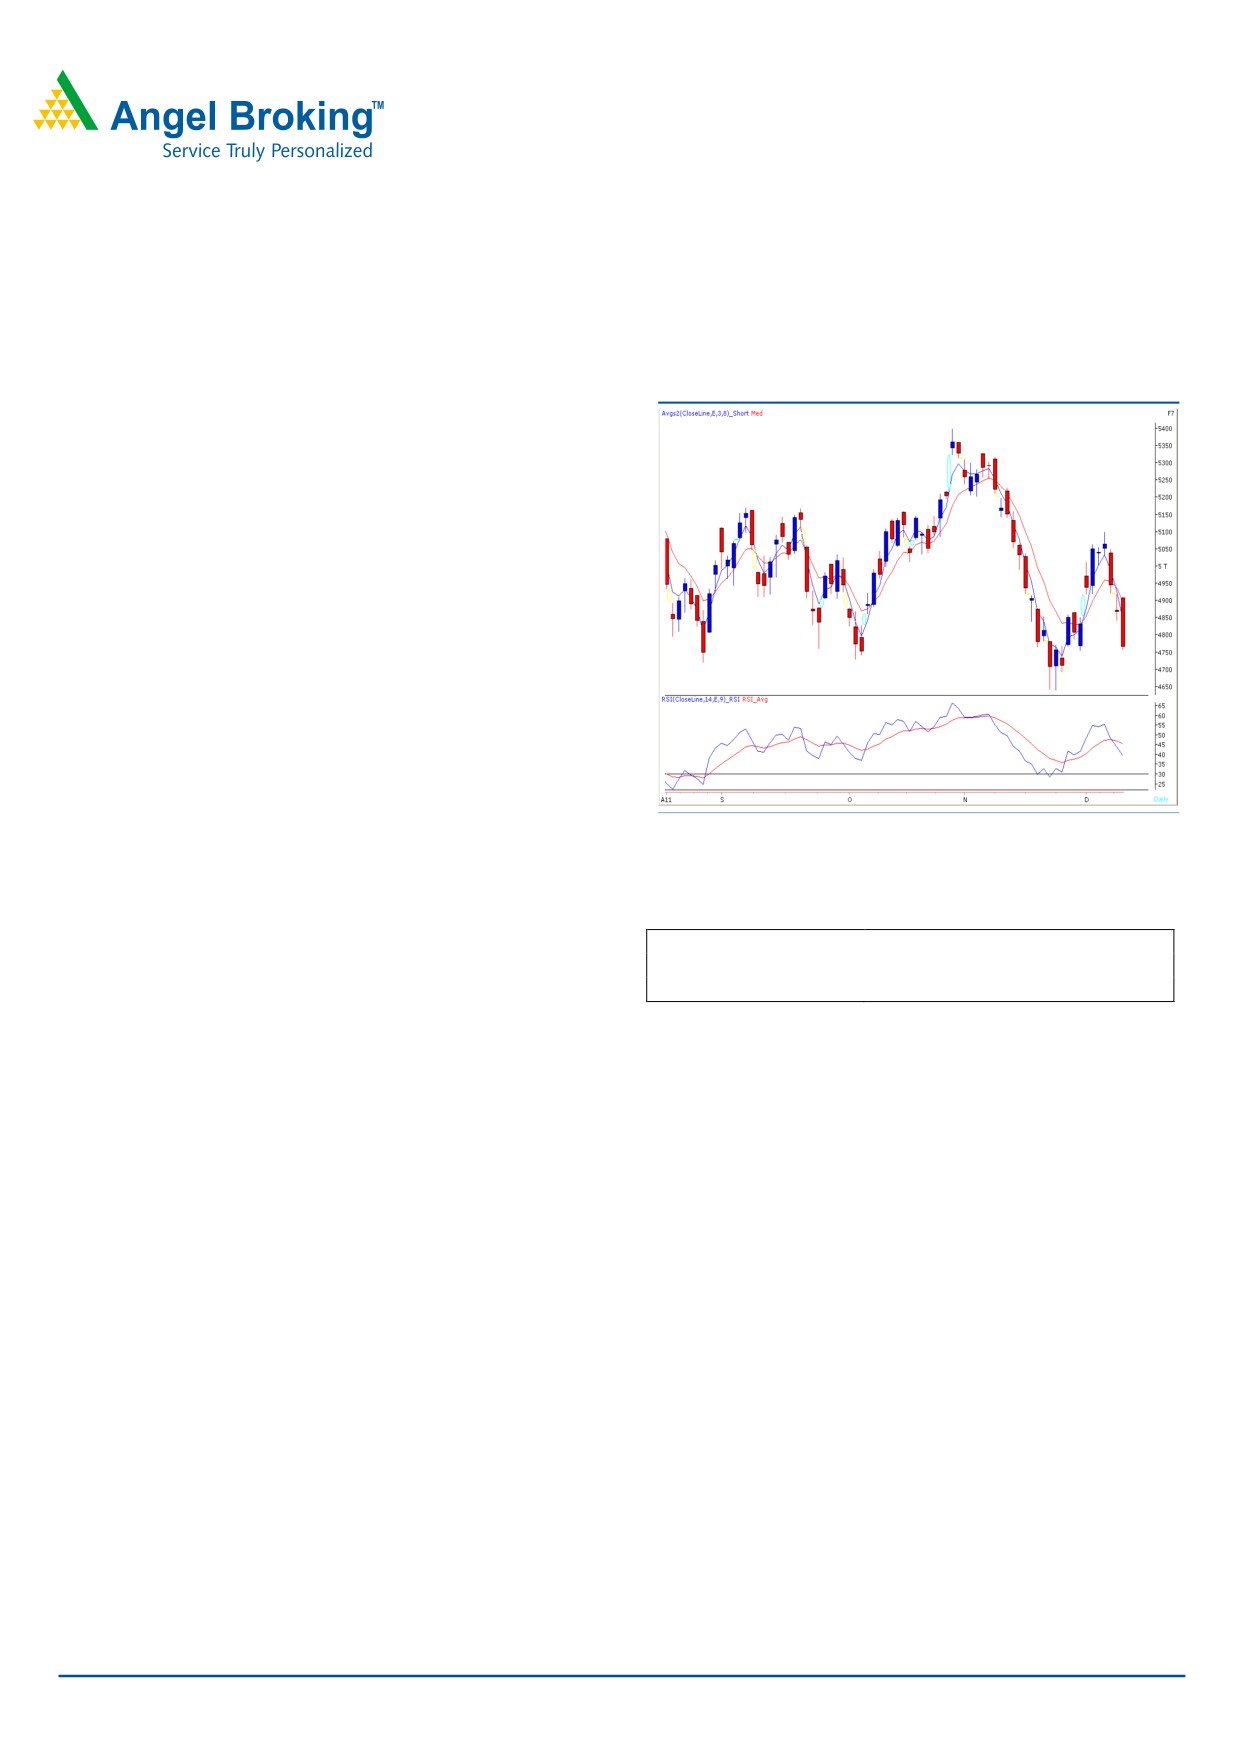
Sensex (15870) / NIFTY (4765)
Exhibit 1: Nifty Daily Chart
Yesterday markets opened on a positive note in-line with
global cues. However profit booking was seen at higher
levels and the Index tumbled sharply post-announcement of
negative IIP numbers to close marginally above 4750 mark.
On the sectoral front, Metal, Banking and Oil & Gas
counters contributed heavily in yesterday’s sharp correction.
The advance decline ratio was strongly in favour of
declining counters. (A=799 D=1941).
(Source
-
Formation
• On the Daily chart, the negative crossover in “3 & 8
EMA” as well as in “RSI” momentum oscillator is still intact.
Source: Falcon
Actionable points:
Trading strategy:
Indices opened on an optimistic note but selling pressure at
View
Neutral
Resistance levels
4782 - 4841
higher levels dragged indices lower and negated “Spinning
Support level
4754 - 4639
Top” formation mentioned in our earlier report.
Subsequently, the market corrected sharply to test expected
support level of 15850 / 4754 and closed marginally above
it. The negative crossover in “3 & 8 EMA” as well as in “RSI”
momentum oscillator is still intact. Therefore, going
forward, if indices manage to sustain below 15850 / 4754
they may drift towards 15645 - 15478 / 4693 - 4639. On
the upside, 16045 - 16142 / 4782 - 4841 levels are likely
to act as resistance in coming trading sessions. Only a
move above this can push indices higher to test 16383 /
4918 level.
For Private Circulation Only |
1
Technical Research | December 13, 2011
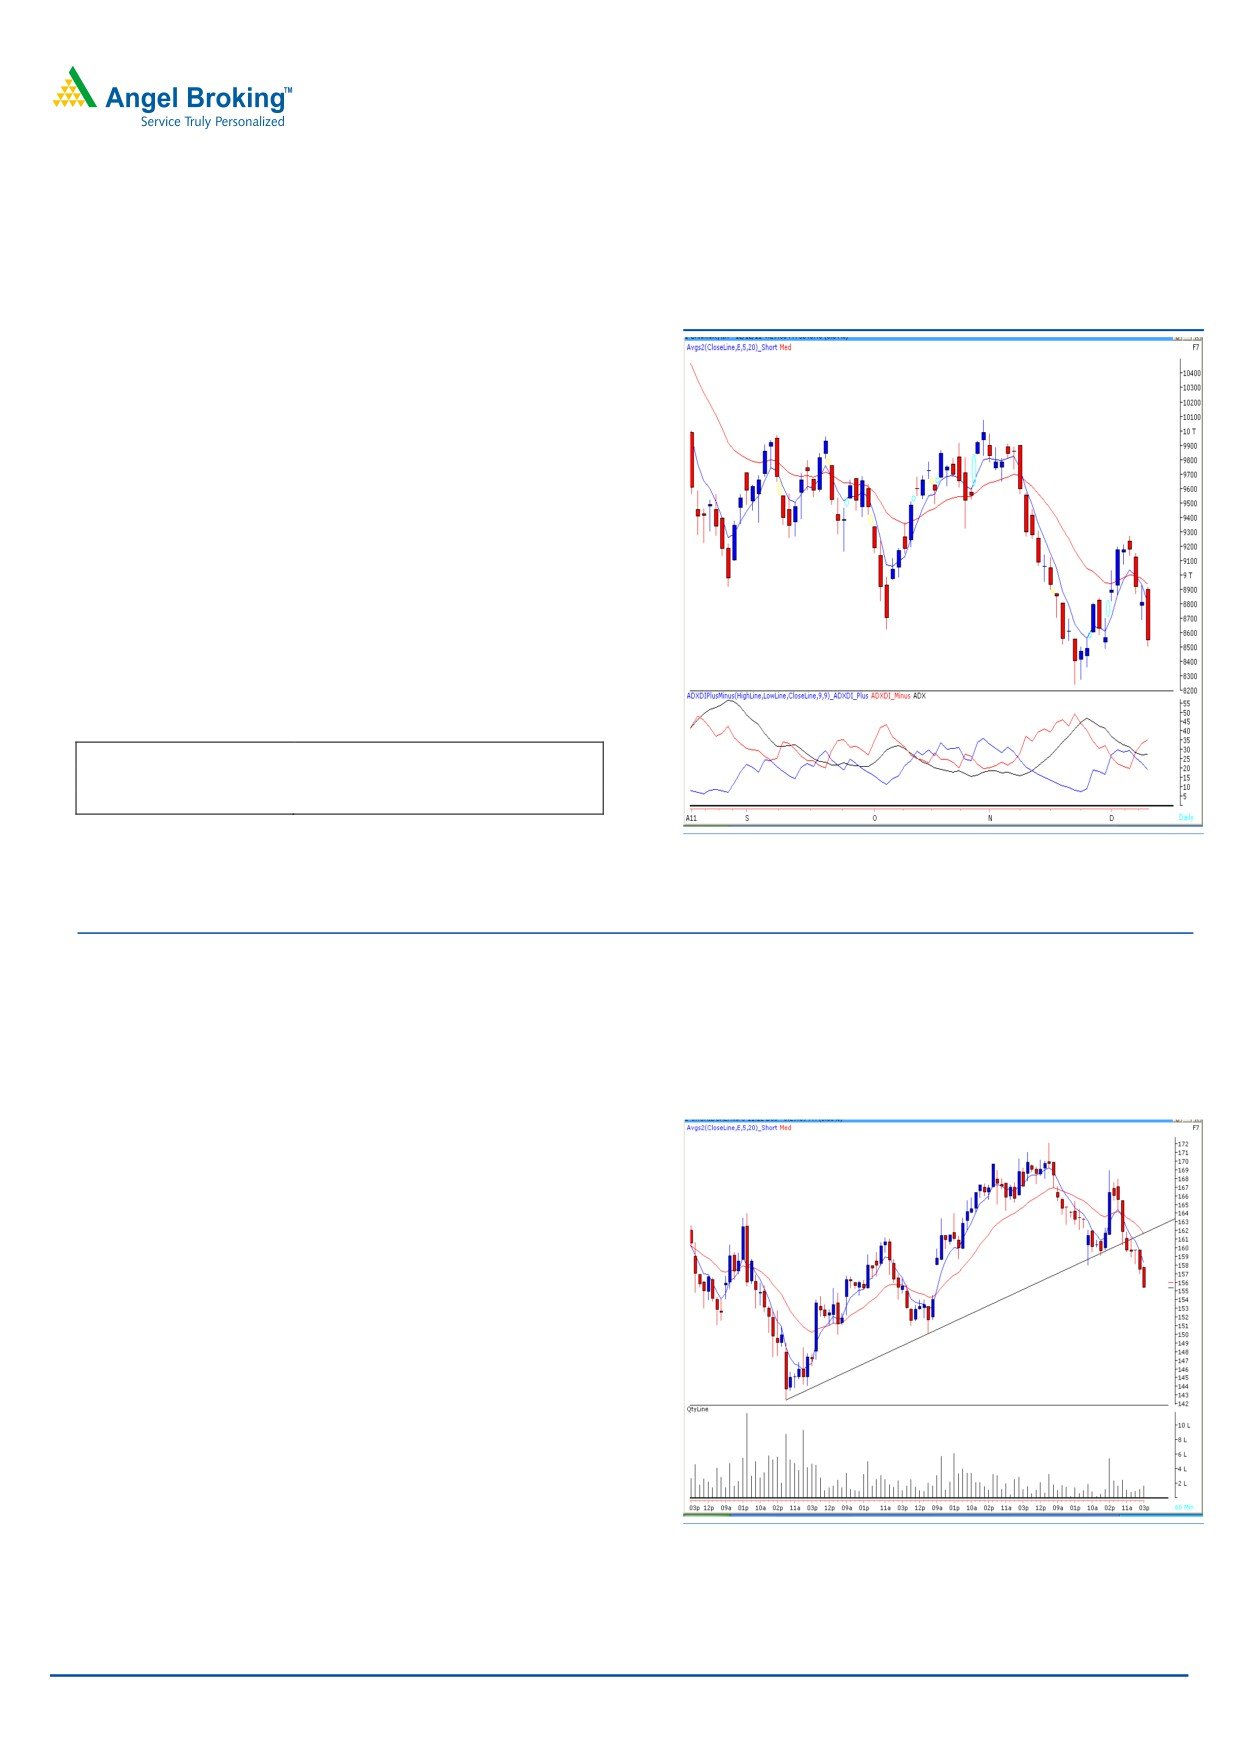
Bank Nifty Outlook - (8543)
Exhibit 2: Bank Nifty Daily Chart
Bank nifty opened on a flat note but failed to cross Friday’s
high of 8932 and drifted towards our mentioned support
level of 8490 during the day. As the index has closed well
below the low of the spinning top formed during the Friday’s
session, the said pattern has been negated. The technical
indicator “ADX (9)” is at 27.45 and pointing upwards,
signaling that the downtrend is gaining strength. Therefore,
if Bank Nifty sustains below yesterday’s low of 8504 then it is
likely to test 8405 - 8295. On the upside, 8706 - 8780 is
likely to act as resistance for the coming trading session.
Actionable points:
View
Neutral
Resistance level
8706 - 8780
Support levels
8405 - 8295
Source: Falcon
Stock Recommendations:
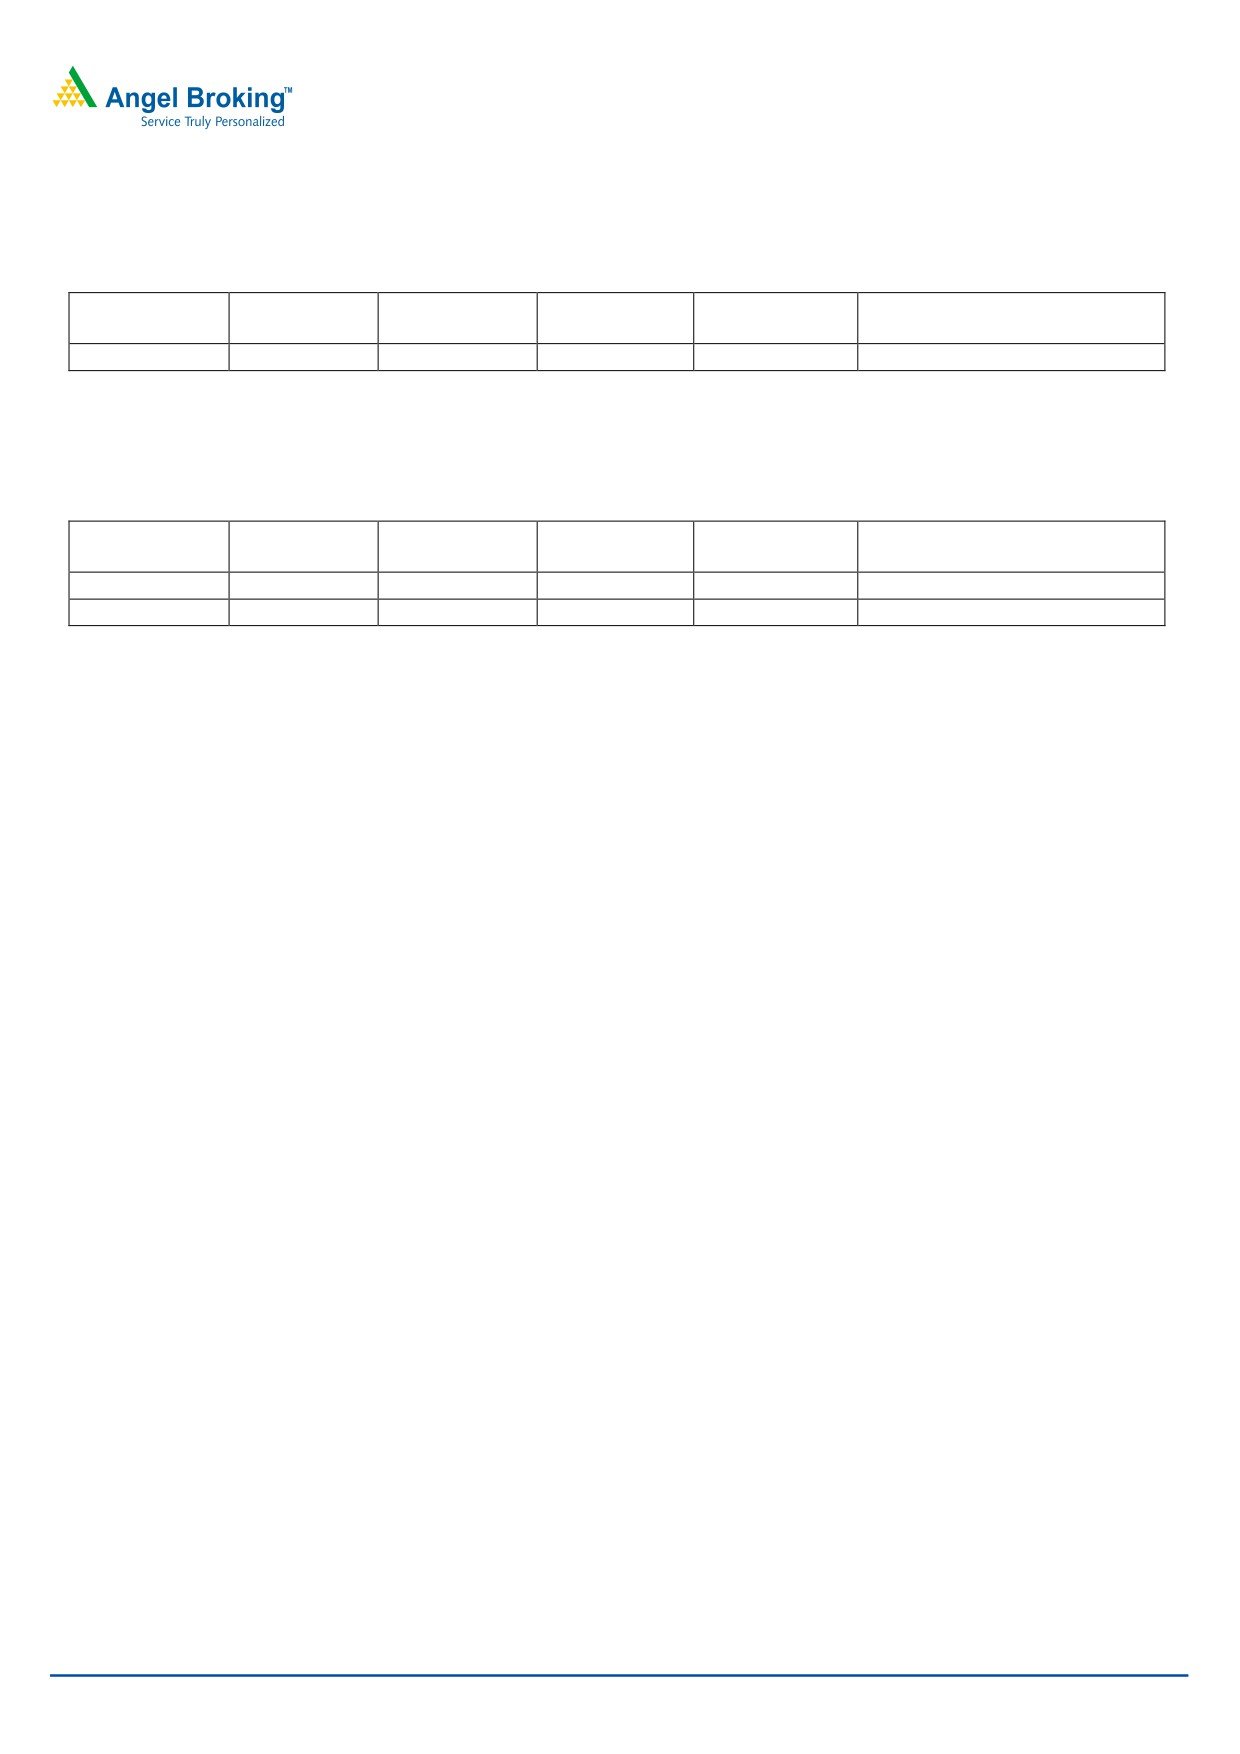
Exhibit 3: Orchid Chemicals (Dec.fut.)
Stock - Orchid Chemicals (Dec.Fut.)
Action - Sell
Last close
` 156.75
Selling Range
` 157 - 158
Stop Loss
` 161.55
Target
` 150
Justification - On the hourly chart, we are witnessing an
upward sloping trend line breakdown at ` 160 along with
negative crossover in momentum oscillators viz. “RSI “and
“Stochastic” on the Daily chart. Further, the “ADX
(9)
indicators is negatively poised. We advise selling the stock
in a range of ` 157 - 158 for a target of ` 150 in coming
3-4 trading sessions.
Source: Falcon
For Private Circulation Only |
2
Technical Research | December 13, 2011
Positive Bias:
Expected
Stock Name
CMP
5 Day EMA
20 Day EMA
Remarks
Target
Infosys
2740.2
2719.2
2705
2800
View will change below 2695
Negative Bias:
Expected
Stock Name
CMP
5 Day EMA
20 Day EMA
Remarks
Target
Arvind Ltd
80.5
83.4
87.8
78
View will change above 84.5
DLF
204.4
212.7
214.4
198
View will change above 218
For Private Circulation Only |
3
Technical Research | December 13, 2011
Daily Pivot Levels for Nifty 50 Stocks
SCRIPS
S2
S1
PIVOT
R1
R2
SENSEX
15,503
15,687
16,024
16,207
16,544
NIFTY
4,655
4,710
4,810
4,865
4,965
BANKNIFTY
8,240
8,392
8,656
8,808
9,072
ACC
1,072
1,097
1,137
1,161
1,202
AMBUJACEM
145
149
155
159
166
AXISBANK
941
956
982
997
1,023
BAJAJ-AUTO
1,571
1,601
1,648
1,678
1,724
BHARTIARTL
326
334
349
357
371
BHEL
248
253
261
266
274
BPCL
532
538
547
553
562
CAIRN
291
296
303
308
315
CIPLA
318
321
324
327
330
DLF
194
199
208
214
223
DRREDDY
1,523
1,546
1,565
1,588
1,607
GAIL
383
387
393
397
403
HCLTECH
397
405
410
419
424
HDFC
634
641
651
658
668
HDFCBANK
412
422
436
447
461
HEROMOTOCO
1,919
1,948
1,999
2,028
2,079
HINDALCO
115
119
127
131
139
HINDUNILVR
378
381
384
386
389
ICICIBANK
679
693
718
733
758
IDFC
99
102
107
109
114
INFY
2,673
2,707
2,731
2,765
2,790
ITC
192
194
197
199
201
JINDALSTEL
478
492
516
530
554
JPASSOCIAT
57
58
62
63
66
KOTAKBANK
469
477
487
494
504
LT
1,153
1,174
1,208
1,229
1,263
M&M
661
672
692
703
723
MARUTI
927
943
966
982
1,005
NTPC
156
160
164
168
171
ONGC
249
253
260
264
270
PNB
850
871
904
926
959
POWERGRID
94
95
97
99
101
RANBAXY
393
400
411
418
429
RCOM
70
72
75
77
80
RELCAPITAL
266
274
287
294
307
RELIANCE
700
714
738
752
776
RELINFRA
374
379
389
395
404
RPOWER
79
80
83
84
87
SAIL
74
76
80
83
86
SBIN
1,677
1,725
1,811
1,859
1,944
SESAGOA
167
169
173
176
179
SIEMENS
657
668
684
696
712
STER
94
96
100
102
105
SUNPHARMA
491
498
509
516
528
SUZLON
21
21
22
23
23
TATAMOTORS
169
173
180
185
192
TATAPOWER
80
84
90
95
101
TATASTEEL
370
378
392
399
413
TCS
1,140
1,160
1,175
1,195
1,210
WIPRO
395
405
412
422
430
Technical Research Team
For Private Circulation Only |
4
Technical Report
RESEARCH TEAM
Shardul Kulkarni
Head - Technicals
Sameet Chavan
Technical Analyst
Sacchitanand Uttekar
Technical Analyst
Mehul Kothari
Technical Analyst
Ankur Lakhotia
Technical Analyst
Research Team: 022-3952 6600
DISCLAIMER: This document is not for public distribution and has been furnished to you solely for your information and must not
be reproduced or redistributed to any other person. Persons into whose possession this document may come are required to observe
these restrictions.
Opinion expressed is our current opinion as of the date appearing on this material only. While we endeavor to update on a
reasonable basis the information discussed in this material, there may be regulatory, compliance, or other reasons that prevent us
from doing so. Prospective investors and others are cautioned that any forward-looking statements are not predictions and may be
subject to change without notice. Our proprietary trading and investment businesses may make investment decisions that are
inconsistent with the recommendations expressed herein.
The information in this document has been printed on the basis of publicly available information, internal data and other reliable
sources believed to be true and are for general guidance only. While every effort is made to ensure the accuracy and completeness of
information contained, the company takes no guarantee and assumes no liability for any errors or omissions of the information. No
one can use the information as the basis for any claim, demand or cause of action.
Recipients of this material should rely on their own investigations and take their own professional advice. Each recipient of this
document should make such investigations as it deems necessary to arrive at an independent evaluation of an investment in the
securities of companies referred to in this document (including the merits and risks involved), and should consult their own advisors to
determine the merits and risks of such an investment. Price and value of the investments referred to in this material may go up or
down. Past performance is not a guide for future performance. Certain transactions - futures, options and other derivatives as well as
non-investment grade securities - involve substantial risks and are not suitable for all investors. Reports based on technical analysis
centers on studying charts of a stock's price movement and trading volume, as opposed to focusing on a company's fundamentals
and as such, may not match with a report on a company's fundamentals.
We do not undertake to advise you as to any change of our views expressed in this document. While we would endeavor to update
the information herein on a reasonable basis, Angel Broking, its subsidiaries and associated companies, their directors and
employees are under no obligation to update or keep the information current. Also there may be regulatory, compliance, or other
reasons that may prevent Angel Broking and affiliates from doing so. Prospective investors and others are cautioned that any
forward-looking statements are not predictions and may be subject to change without notice.
Angel Broking Limited and affiliates, including the analyst who has issued this report, may, on the date of this report, and from time
to time, have long or short positions in, and buy or sell the securities of the companies mentioned herein or engage in any other
transaction involving such securities and earn brokerage or compensation or act as advisor or have other potential conflict of interest
with respect to company/ies mentioned herein or inconsistent with any recommendation and related information and opinions.
Angel Broking Limited and affiliates may seek to provide or have engaged in providing corporate finance, investment banking or
other advisory services in a merger or specific transaction to the companies referred to in this report, as on the date of this report or
in the past.
Sebi Registration No : INB 010996539
For Private Circulation Only |