Technical Research | October 13, 2011
Daily Technical Report
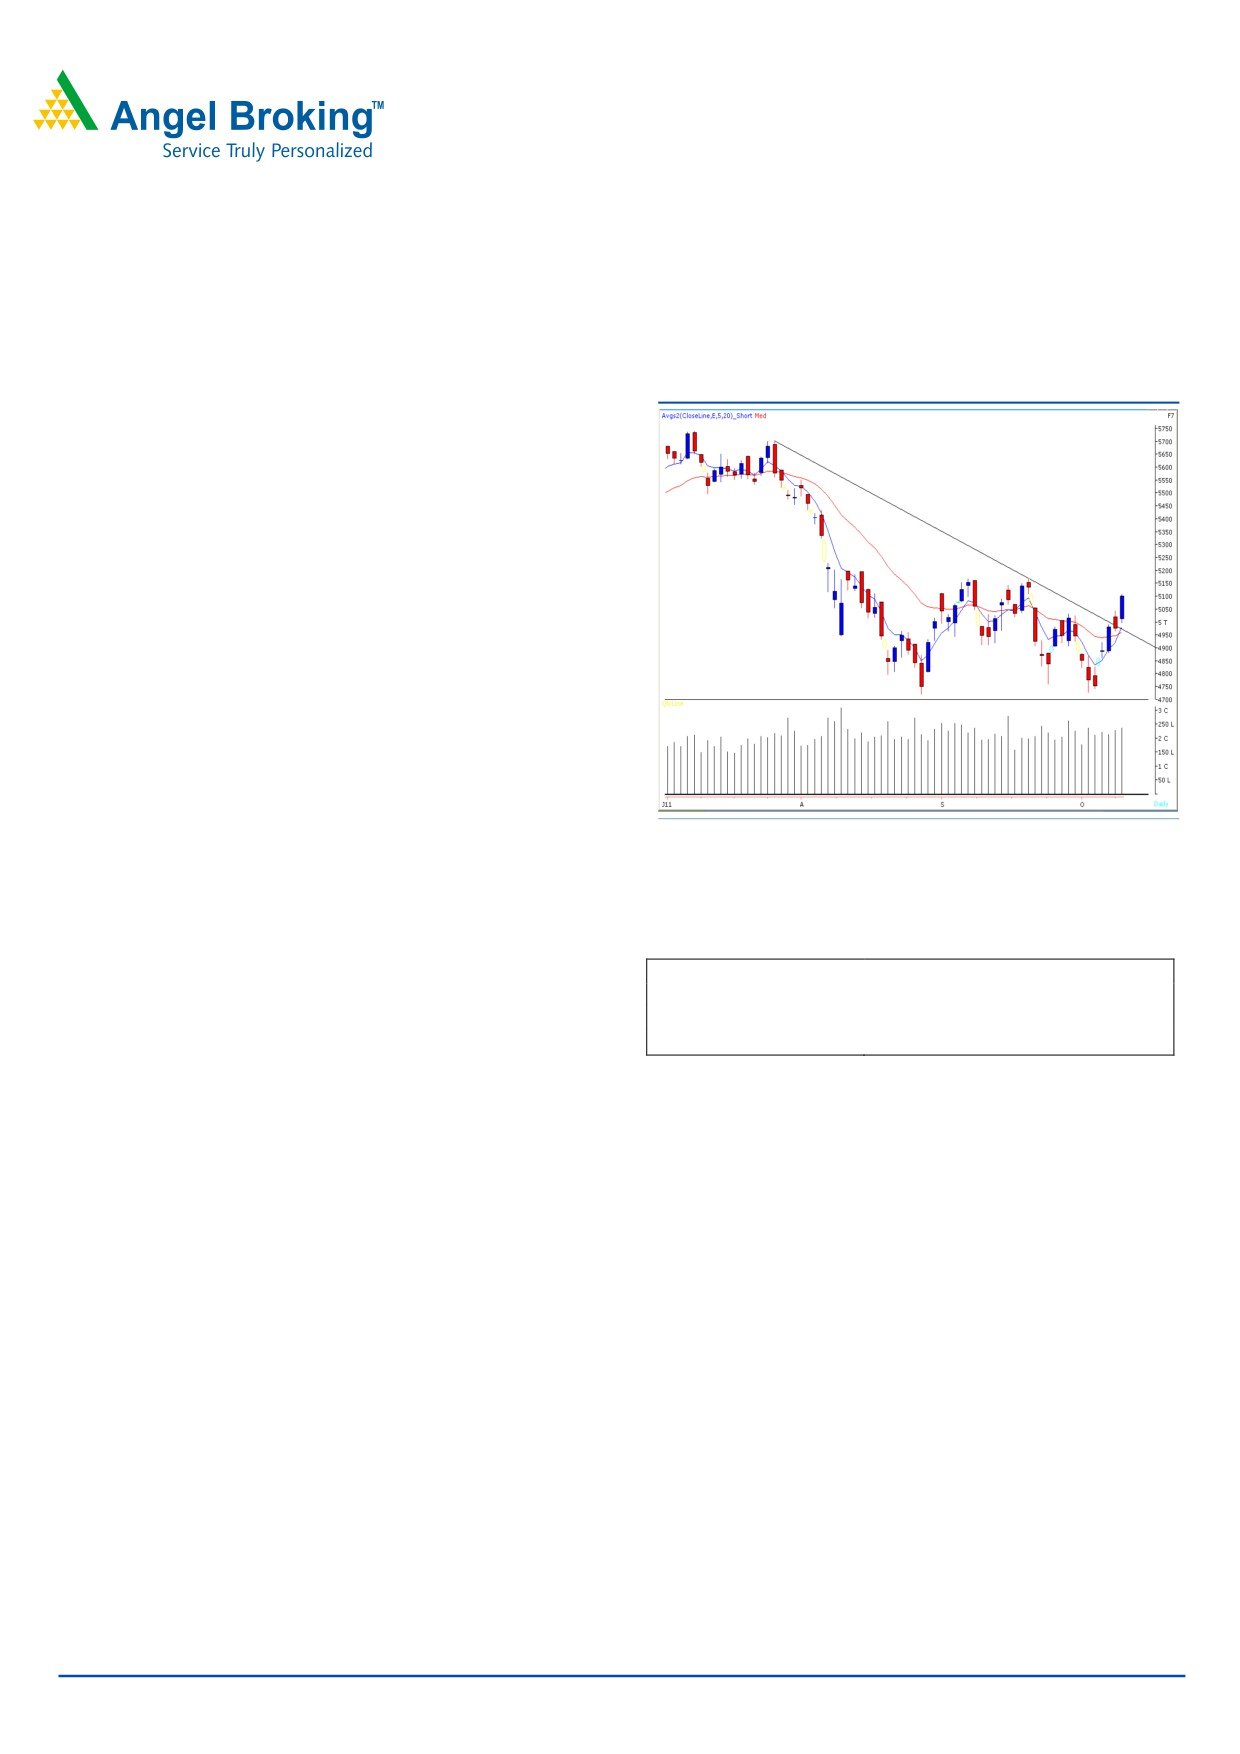
Sensex (16959) / NIFTY (5099)
Yesterday markets opened flat in-line with global cues and
Exhibit 1: Nifty Daily Chart
traded with choppiness during the first half. However,
buying emerged during the latter part of the session which
led indices to close in positive territory. On the sector front,
IT, Teck and Banking counters were among the major
contributors in yesterday’s gain. The advance decline ratio
was strongly in favor of advancing counters (A=1846
Formation
• On the Daily chart, we are observing a “Downward
Sloping trend line” joining two highs of 18945 and 17191 /
5702 and 5168.
• We are also observing a positive crossover in “5 & 20
Day EMA” on the Daily chart.
Source: Falcon
Actionable points:
Trading strategy:
After a quite opening, indices moved in a narrow range and
View
Mildly Bullish
strong positive momentum was observed after crossing
Positive Above
5110
Expected Target
5169 - 5230
Tuesday’s high of 16774 / 5045. Thus indices headed
Support Levels
5045 - 4964
higher to fill the downside gap near to 17000 / 5110
created on 22nd September 2011. Also, yesterday’s price
action resulted in a closing well above “Downward Sloping
trend line” joining two highs of 18945 and 17191 / 5702
and
5168. Going forward, considering the positive
crossover in “5 & 20 Day EMA”, upside momentum is likely
to continue if indices manage to sustain above yesterday’s
high of 16987 / 5110. In this case, indices are likely to rally
towards next resistance levels of 17210 - 17358 / 5169 -
5230. On the downside, 16774 - 16510 / 5045 - 4964
levels may act as support levels for the day.
For Private Circulation Only |
1
Technical Research | October 13, 2011
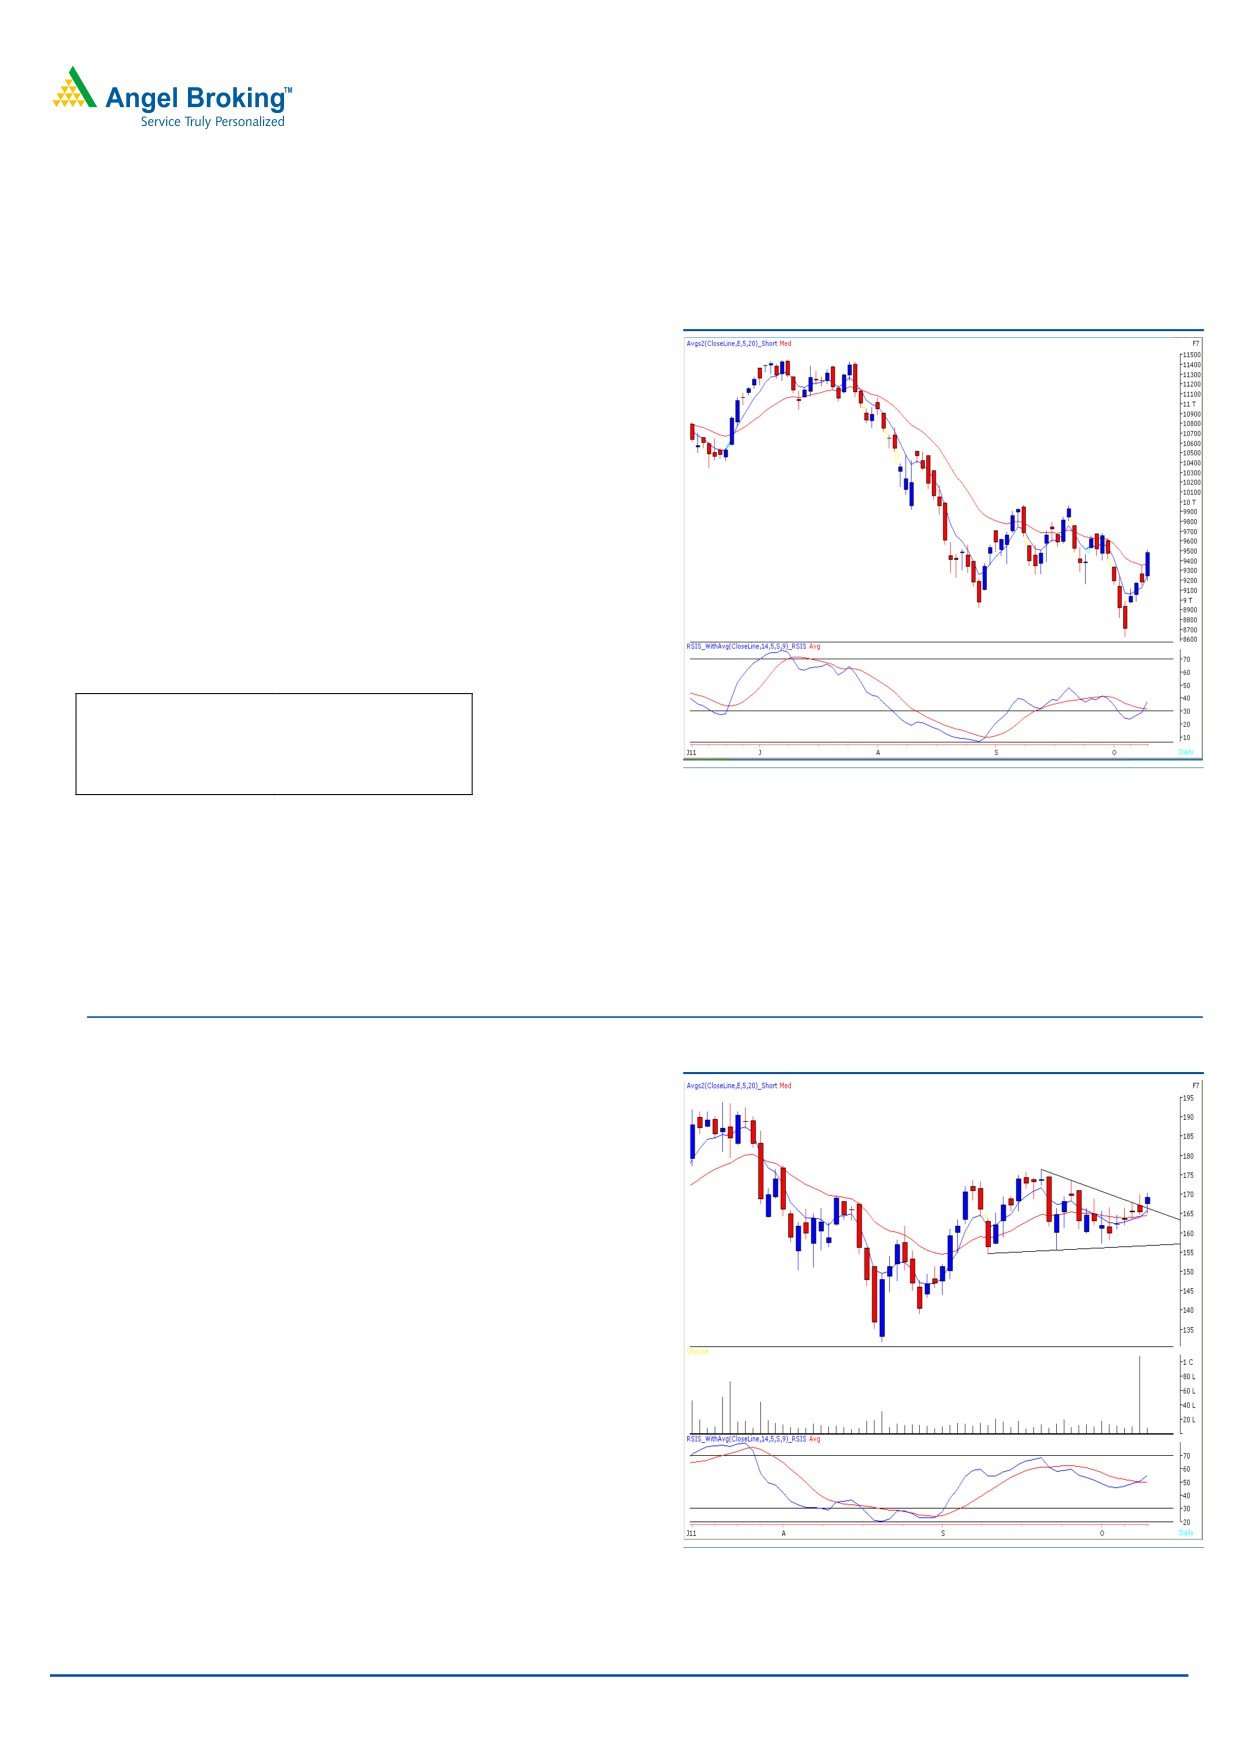
Bank Nifty Outlook - (9482)
Yesterday, In line with the broader markets positive
Exhibit 2: Bank Nifty Daily Chart
momentum was witnessed in the bank nifty and the Index
crossed the mentioned resistance level of 9363 to close
near day’s high. We are now observing that bank nifty has
managed to give a close above “20 EMA”, coupled with
positive crossover in “RSI smoothened” momentum
oscillator on daily chart. In view of the, above mentioned
indicators, if bank nifty sustain above yesterday’s high of
9514 level then is likely to test 9700-9970 levels. On the
downside, 9363 - 9148 levels may act as support for the
day.
Actionable points:
View
Bullish
Positive Above
9514
Expected Target
9700 - 9970
Support Levels
9363 - 9148
Source: Falcon
Stock Recommendations:
Exhibit 3: IRB Infra Daily chart
Stock - IRB Infra
Action - BUY
Last close - ` 169.20
Range
- ` 170 - 168
Stop Loss - ` 164.50
Target
- ` 182
Justification - On the Daily chart we are observing a
triangular pattern breakout along with positive crossovers
in RSI smoothened momentum ossiclator.Also a positive
crossover in 5 & 20 day EMA indicates possibility of further
upside.We advise buying the counter in the range of ` 170
–
`
168 with stoploss of
164.50 for a target of
`182.Timeframe 3-5 days.
Source: Falcon
For Private Circulation Only |
2
Technical Research | October 13, 2011
Positive Bias:
Stock Name
5 Day EMA
20 Day EMA
Expected Target
Remarks
Escorts
72.87
72.84
77.50
View will be negated below 72.15
Exide Industries
132.68
133.91
141.50
View will be negated below 131.50
Venkys India
399.43
402.48
427
View will be negated below 400.50
Negative Bias:
Stock Name
5 Day EMA
20 Day EMA
Expected Target
Remarks
Coal India
339.45
351.35
328
View will be negated above 350
Ruchi Soya
111.58
111.75
106.50
View will be negated above 114.70
For Private Circulation Only |
3
Technical Research | October 13, 2011
Daily Pivot Levels for Nifty 50 Stocks
SCRIPS
S2
S1
PIVOT
R1
R2
SENSEX
16,473
16,716
16,851
17,094
17,230
NIFTY
4,957
5,028
5,069
5,140
5,181
BANKNIFTY
9,076
9,279
9,397
9,600
9,717
ACC
1,127
1,134
1,139
1,146
1,151
AMBUJACEM
141
145
148
152
154
AXISBANK
1,015
1,054
1,077
1,116
1,139
BAJAJ-AUTO
1,527
1,557
1,587
1,616
1,647
BHARTIARTL
366
370
374
377
382
BHEL
321
330
335
344
349
BPCL
660
666
673
679
685
CAIRN
276
280
282
286
288
CIPLA
279
283
285
288
290
DLF
221
229
233
241
246
DRREDDY
1,500
1,515
1,525
1,540
1,550
GAIL
412
416
419
423
426
HCLTECH
404
412
418
425
431
HDFC
652
661
667
676
681
HDFCBANK
447
457
464
474
480
HEROMOTOCO
1,930
1,965
2,000
2,036
2,071
HINDALCO
125
129
132
135
138
HINDUNILVR
324
327
329
332
334
ICICIBANK
823
841
852
871
882
IDFC
120
121
123
125
126
INFY
2,561
2,620
2,654
2,713
2,747
ITC
198
201
203
206
208
JINDALSTEL
471
494
512
534
552
JPASSOCIAT
72
74
75
76
77
KOTAKBANK
446
459
467
479
487
LT
1,388
1,416
1,431
1,459
1,475
M&M
773
790
801
818
829
MARUTI
1,056
1,071
1,081
1,095
1,105
NTPC
173
175
177
179
181
ONGC
265
268
270
273
275
PNB
931
959
978
1,005
1,024
POWERGRID
97
98
99
100
101
RANBAXY
505
511
516
521
526
RCOM
72
75
76
78
79
RELCAPITAL
331
342
348
358
365
RELIANCE
817
833
843
859
868
RELINFRA
398
407
413
422
427
RPOWER
81
83
84
85
86
SAIL
103
107
109
112
114
SBIN
1,714
1,793
1,836
1,916
1,959
SESAGOA
222
225
228
231
234
SIEMENS
801
824
862
885
923
STER
114
117
119
122
124
SUNPHARMA
476
480
483
487
490
SUZLON
37
38
38
38
39
TATAMOTORS
161
171
180
190
200
TATAPOWER
96
99
101
104
106
TATASTEEL
430
437
441
448
452
TCS
1,049
1,064
1,077
1,092
1,104
WIPRO
340
346
352
357
364
Technical Research Team
For Private Circulation Only |
4
Technical Report
RESEARCH TEAM
Shardul Kulkarni
Head - Technicals
Sameet Chavan
Technical Analyst
Sacchitanand Uttekar
Technical Analyst
Mehul Kothari
Technical Analyst
Ankur Lakhotia
Technical Analyst
Research Team: 022-3952 6600
DISCLAIMER: This document is not for public distribution and has been furnished to you solely for your information and must not
be reproduced or redistributed to any other person. Persons into whose possession this document may come are required to observe
these restrictions.
Opinion expressed is our current opinion as of the date appearing on this material only. While we endeavor to update on a
reasonable basis the information discussed in this material, there may be regulatory, compliance, or other reasons that prevent us
from doing so. Prospective investors and others are cautioned that any forward-looking statements are not predictions and may be
subject to change without notice. Our proprietary trading and investment businesses may make investment decisions that are
inconsistent with the recommendations expressed herein.
The information in this document has been printed on the basis of publicly available information, internal data and other reliable
sources believed to be true and are for general guidance only. While every effort is made to ensure the accuracy and completeness of
information contained, the company takes no guarantee and assumes no liability for any errors or omissions of the information. No
one can use the information as the basis for any claim, demand or cause of action.
Recipients of this material should rely on their own investigations and take their own professional advice. Each recipient of this
document should make such investigations as it deems necessary to arrive at an independent evaluation of an investment in the
securities of companies referred to in this document (including the merits and risks involved), and should consult their own advisors to
determine the merits and risks of such an investment. Price and value of the investments referred to in this material may go up or
down. Past performance is not a guide for future performance. Certain transactions - futures, options and other derivatives as well as
non-investment grade securities - involve substantial risks and are not suitable for all investors. Reports based on technical analysis
centers on studying charts of a stock's price movement and trading volume, as opposed to focusing on a company's fundamentals
and as such, may not match with a report on a company's fundamentals.
We do not undertake to advise you as to any change of our views expressed in this document. While we would endeavor to update
the information herein on a reasonable basis, Angel Broking, its subsidiaries and associated companies, their directors and
employees are under no obligation to update or keep the information current. Also there may be regulatory, compliance, or other
reasons that may prevent Angel Broking and affiliates from doing so. Prospective investors and others are cautioned that any
forward-looking statements are not predictions and may be subject to change without notice.
Angel Broking Limited and affiliates, including the analyst who has issued this report, may, on the date of this report, and from time
to time, have long or short positions in, and buy or sell the securities of the companies mentioned herein or engage in any other
transaction involving such securities and earn brokerage or compensation or act as advisor or have other potential conflict of interest
with respect to company/ies mentioned herein or inconsistent with any recommendation and related information and opinions.
Angel Broking Limited and affiliates may seek to provide or have engaged in providing corporate finance, investment banking or
other advisory services in a merger or specific transaction to the companies referred to in this report, as on the date of this report or
in the past.
Sebi Registration No : INB 010996539
For Private Circulation Only |